Quality of life in the region will be compromised as increasing population, the migration of individuals from rural to urban locations, and a changing climate redistribute demand at the intersection of food consumption, energy production, and water resources. A growing number of adaptation strategies, improved climate services, and early warning decision support systems will more effectively manage the complex regional, national, and transnational issues associated with food, energy, and water.
The built environment is vulnerable to increasing temperature, extreme precipitation, and continued sea level rise, particularly as infrastructure ages and populations shift to urban centers. Along the Texas Gulf Coast, relative sea level rise of twice the global average will put coastal infrastructure at risk. Regional adaptation efforts that harden or relocate critical infrastructure will reduce the risk of climate change impacts.
Terrestrial and aquatic ecosystems are being directly and indirectly altered by climate change. Some species can adapt to extreme droughts, unprecedented floods, and wildfires from a changing climate, while others cannot, resulting in significant impacts to both services and people living in these ecosystems. Landscape-scale ecological services will increase the resilience of the most vulnerable species.
Health threats, including heat illness and diseases transmitted through food, water, and insects, will increase as temperature rises. Weather conditions supporting these health threats are projected to be of longer duration or occur at times of the year when these threats are not normally experienced. Extreme weather events with resultant physical injury and population displacement are also a threat. These threats are likely to increase in frequency and distribution and are likely to create significant economic burdens. Vulnerability and adaptation assessments, comprehensive response plans, seasonal health forecasts, and early warning systems can be useful adaptation strategies.
Tribal and Indigenous communities are particularly vulnerable to climate change due to water resource constraints, extreme weather events, higher temperature, and other likely public health issues. Efforts to build community resilience can be hindered by economic, political, and infrastructure limitations, but traditional knowledge and intertribal organizations provide opportunities to adapt to the potential challenges of climate change.
Quality of life in the region will be compromised as increasing population, the migration of individuals from rural to urban locations, and a changing climate redistribute demand at the intersection of food consumption, energy production, and water resources. A growing number of adaptation strategies, improved climate services, and early warning decision support systems will more effectively manage the complex regional, national, and transnational issues associated with food, energy, and water.
Key Message 2
The built environment is vulnerable to increasing temperature, extreme precipitation, and continued sea level rise, particularly as infrastructure ages and populations shift to urban centers. Along the Texas Gulf Coast, relative sea level rise of twice the global average will put coastal infrastructure at risk. Regional adaptation efforts that harden or relocate critical infrastructure will reduce the risk of climate change impacts.
Key Message 3
Terrestrial and aquatic ecosystems are being directly and indirectly altered by climate change. Some species can adapt to extreme droughts, unprecedented floods, and wildfires from a changing climate, while others cannot, resulting in significant impacts to both services and people living in these ecosystems. Landscape-scale ecological services will increase the resilience of the most vulnerable species.
Key Message 4
Health threats, including heat illness and diseases transmitted through food, water, and insects, will increase as temperature rises. Weather conditions supporting these health threats are projected to be of longer duration or occur at times of the year when these threats are not normally experienced. Extreme weather events with resultant physical injury and population displacement are also a threat. These threats are likely to increase in frequency and distribution and are likely to create significant economic burdens. Vulnerability and adaptation assessments, comprehensive response plans, seasonal health forecasts, and early warning systems can be useful adaptation strategies.
Key Message 5
Tribal and Indigenous communities are particularly vulnerable to climate change due to water resource constraints, extreme weather events, higher temperature, and other likely public health issues. Efforts to build community resilience can be hindered by economic, political, and infrastructure limitations, but traditional knowledge and intertribal organizations provide opportunities to adapt to the potential challenges of climate change.
Likelihood
Virtually Certain
Extremely Likely
Very Likely
Likely
About as Likely as Not
Unlikely
Very Unikely
Extremely Unlikely
Exceptionally Unlikely
99%–100%
95%–100%
90%–100%
66%-100%
33%-66%
0%-33%
0%-10%
0%-5%
0%-1%
Confidence Level
Very High
High
Medium
Low
Strong evidence (established theory, multiple sources, consistent results, well documented and accepted methods, etc.), high consensus
Moderate evidence (several sources, some consistency, methods vary and/or documentation limited, etc.), medium consensus
Suggestive evidence (a few sources, limited consistency, models incomplete, methods emerging, etc.), competing schools of thought
Inconclusive evidence (limited sources, extrapolations, inconsistent findings, poor documentation and/or methods not tested, etc.), disagreement or lack of opinions among experts
Documenting Uncertainty: This assessment relies on two metrics to communicate the degree of
certainty in Key Findings. See Guide to this Report for more on
assessments of likelihood and confidence.
EXECUTIVE SUMMARY: Chapter 23: Southern Great Plains
The Southern Great Plains experiences weather that is dramatic and consequential; from hurricanes and flooding to heat waves and drought, its 34 million people, their infrastructure, and economies are often stressed, greatly impacting socioeconomic systems. The quality of life for the region’s residents is dependent upon resources and natural systems for the sustainable provision of our basic needs—food, energy, and water. Extreme weather and climate events have redistributed demands for consumption, production, and supply across the region. Adaptation strategies that integrate climate services and early warning systems are improving our abilities to develop sustainable infrastructure and increase agricultural production, yet include the flexibility needed to embrace any changing demand patterns.
Regional adaptation efforts that harden or relocate critical infrastructure will reduce the risk of climate change impacts. Redesigns of coastal infrastructure and the use of green/gray methodologies are improving future coastal resilience. Energy industry reinvention is ensuring operations and reliability during extreme climatic events. Increasingly robust considerations of economic resilience allow us to anticipate risk, evaluate how that risk can affect our needs, and build a responsive adaptive capacity.
With climate change, terrestrial and aquatic ecosystems, and species within them, have winners and losers. Those that can adapt are “increasers,” while others cannot, resulting in impacts to traditional services and the livelihoods of the people who depend on those resources. The warming of coastal bay waters has been documented since at least the 1980s, and those increases in water temperature directly affect water quality, leading to hypoxia, harmful algal blooms, and fish kills—thus lowering the productivity and diversity of estuaries. Natural wetlands like the playa lakes in the High Plains, which have served for centuries as important habitat for migrating waterfowl, are virtually nonexistent during drought.
Direct human health threats follow a similar pattern of species within our natural ecosystems. Extreme weather results in both direct and indirect impacts to people; physical injury and population displacement are anticipated to result with climate change. Heat illness and diseases transmitted through food, water, and insects increase human risk as temperature rises. Acute awareness of these future impacts allows us to plan for the most vulnerable and adapt through response plans, health forecasting, and early warning strategies, including those that span transboundary contexts and systems.
The impacts of climate change in general become more acute when considering tribal and Indigenous communities. Resilience to climate change will be hindered by economic, political, and infrastructure limitations for these groups; at the same time, connectivity of the tribes and Indigenous communities offers opportunities for teaching adaptably through their cultural means of applying traditional knowledge and intertribal organization. These well-honed connections of adapting through the centuries may help all of us learn how to offset the impacts and potential challenges of climate change.
Projected Increase in Number of Days Above 100ºF
Under both lower- and higher-scenario climate change projections, the number of days exceeding 100°F is projected to increase markedly across the Southern Great Plains by the end of the century (2070–2099 as compared to 1976–2005). From Figure 23.4 (Sources: NOAA NCEI and CICS-NC).
The role of climate change in altering the frequency of the types of severe weather most typically associated with the Southern Great Plains, such as severe local storms, hailstorms, and tornadoes, remains difficult to quantify.1,2 Indirect approaches suggest a possible increase in the circumstances conducive to such severe weather,3 including an increase in the instances of larger hail sizes in the region by 2040,4 but changes are unlikely to be uniform across the region, and additional research is needed.
CHAPTER 23 Southern Great Plains
Background
Federal Coordinating Lead Author:
Bill Bartush, U.S. Fish and Wildlife Service
Chapter Lead:
Kevin Kloesel, University of Oklahoma
Chapter Authors:
Jay Banner, University of Texas at Austin
David Brown, USDA-ARS Grazinglands Research Laboratory
Jay Lemery, University of Colorado
Xiaomao Lin, Kansas State University
Cindy Loeffler, Texas Parks and Wildlife Department
Gary McManus, Oklahoma Climatological Survey
Esther Mullens, DOI South Central Climate Adaptation Science Center
John Nielsen-Gammon, Texas A&M University
Mark Shafer, NOAA-RISA Southern Climate Impacts Planning Program
Cecilia Sorensen, University of Colorado
Sid Sperry, Oklahoma Association of Electric Cooperatives
Daniel Wildcat, Haskell Indian Nations University
Jadwiga Ziolkowska, University of Oklahoma
Review Editor:
Ellu Nasser, Adaptation International
Technical Contributor:
Katharine Hayhoe, Texas Tech University
USGCRP Coordinators:
Susan Aragon-Long, Senior Scientist
Christopher W. Avery, Senior Manager
<b>Kloesel</b>, K., B. Bartush, J. Banner, D. Brown, J. Lemery, X. Lin, C. Loeffler, G. McManus, E. Mullens, J. Nielsen-Gammon, M. Shafer, C. Sorensen, S. Sperry, D. Wildcat, and J. Ziolkowska, 2018: Southern Great Plains. In <i>Impacts, Risks, and Adaptation in the United States: Fourth National Climate Assessment, Volume II</i> [Reidmiller, D.R., C.W. Avery, D.R. Easterling, K.E. Kunkel, K.L.M. Lewis, T.K. Maycock, and B.C. Stewart (eds.)]. U.S. Global Change Research Program, Washington, DC, USA, pp. 987–1035. doi: 10.7930/NCA4.2018.CH23
The Southern Great Plains, composed of Kansas, Oklahoma, and Texas, experiences weather that is dramatic and consequential. Hurricanes, flooding, severe storms with large hail and tornadoes, blizzards, ice storms, relentless winds, heat waves, and drought—its people and economies are often at the mercy of some of the most diverse and extreme weather hazards on the planet. These events cause significant stress to existing infrastructure and socioeconomic systems and can result in significant loss of life and the loss of billions of dollars in property.
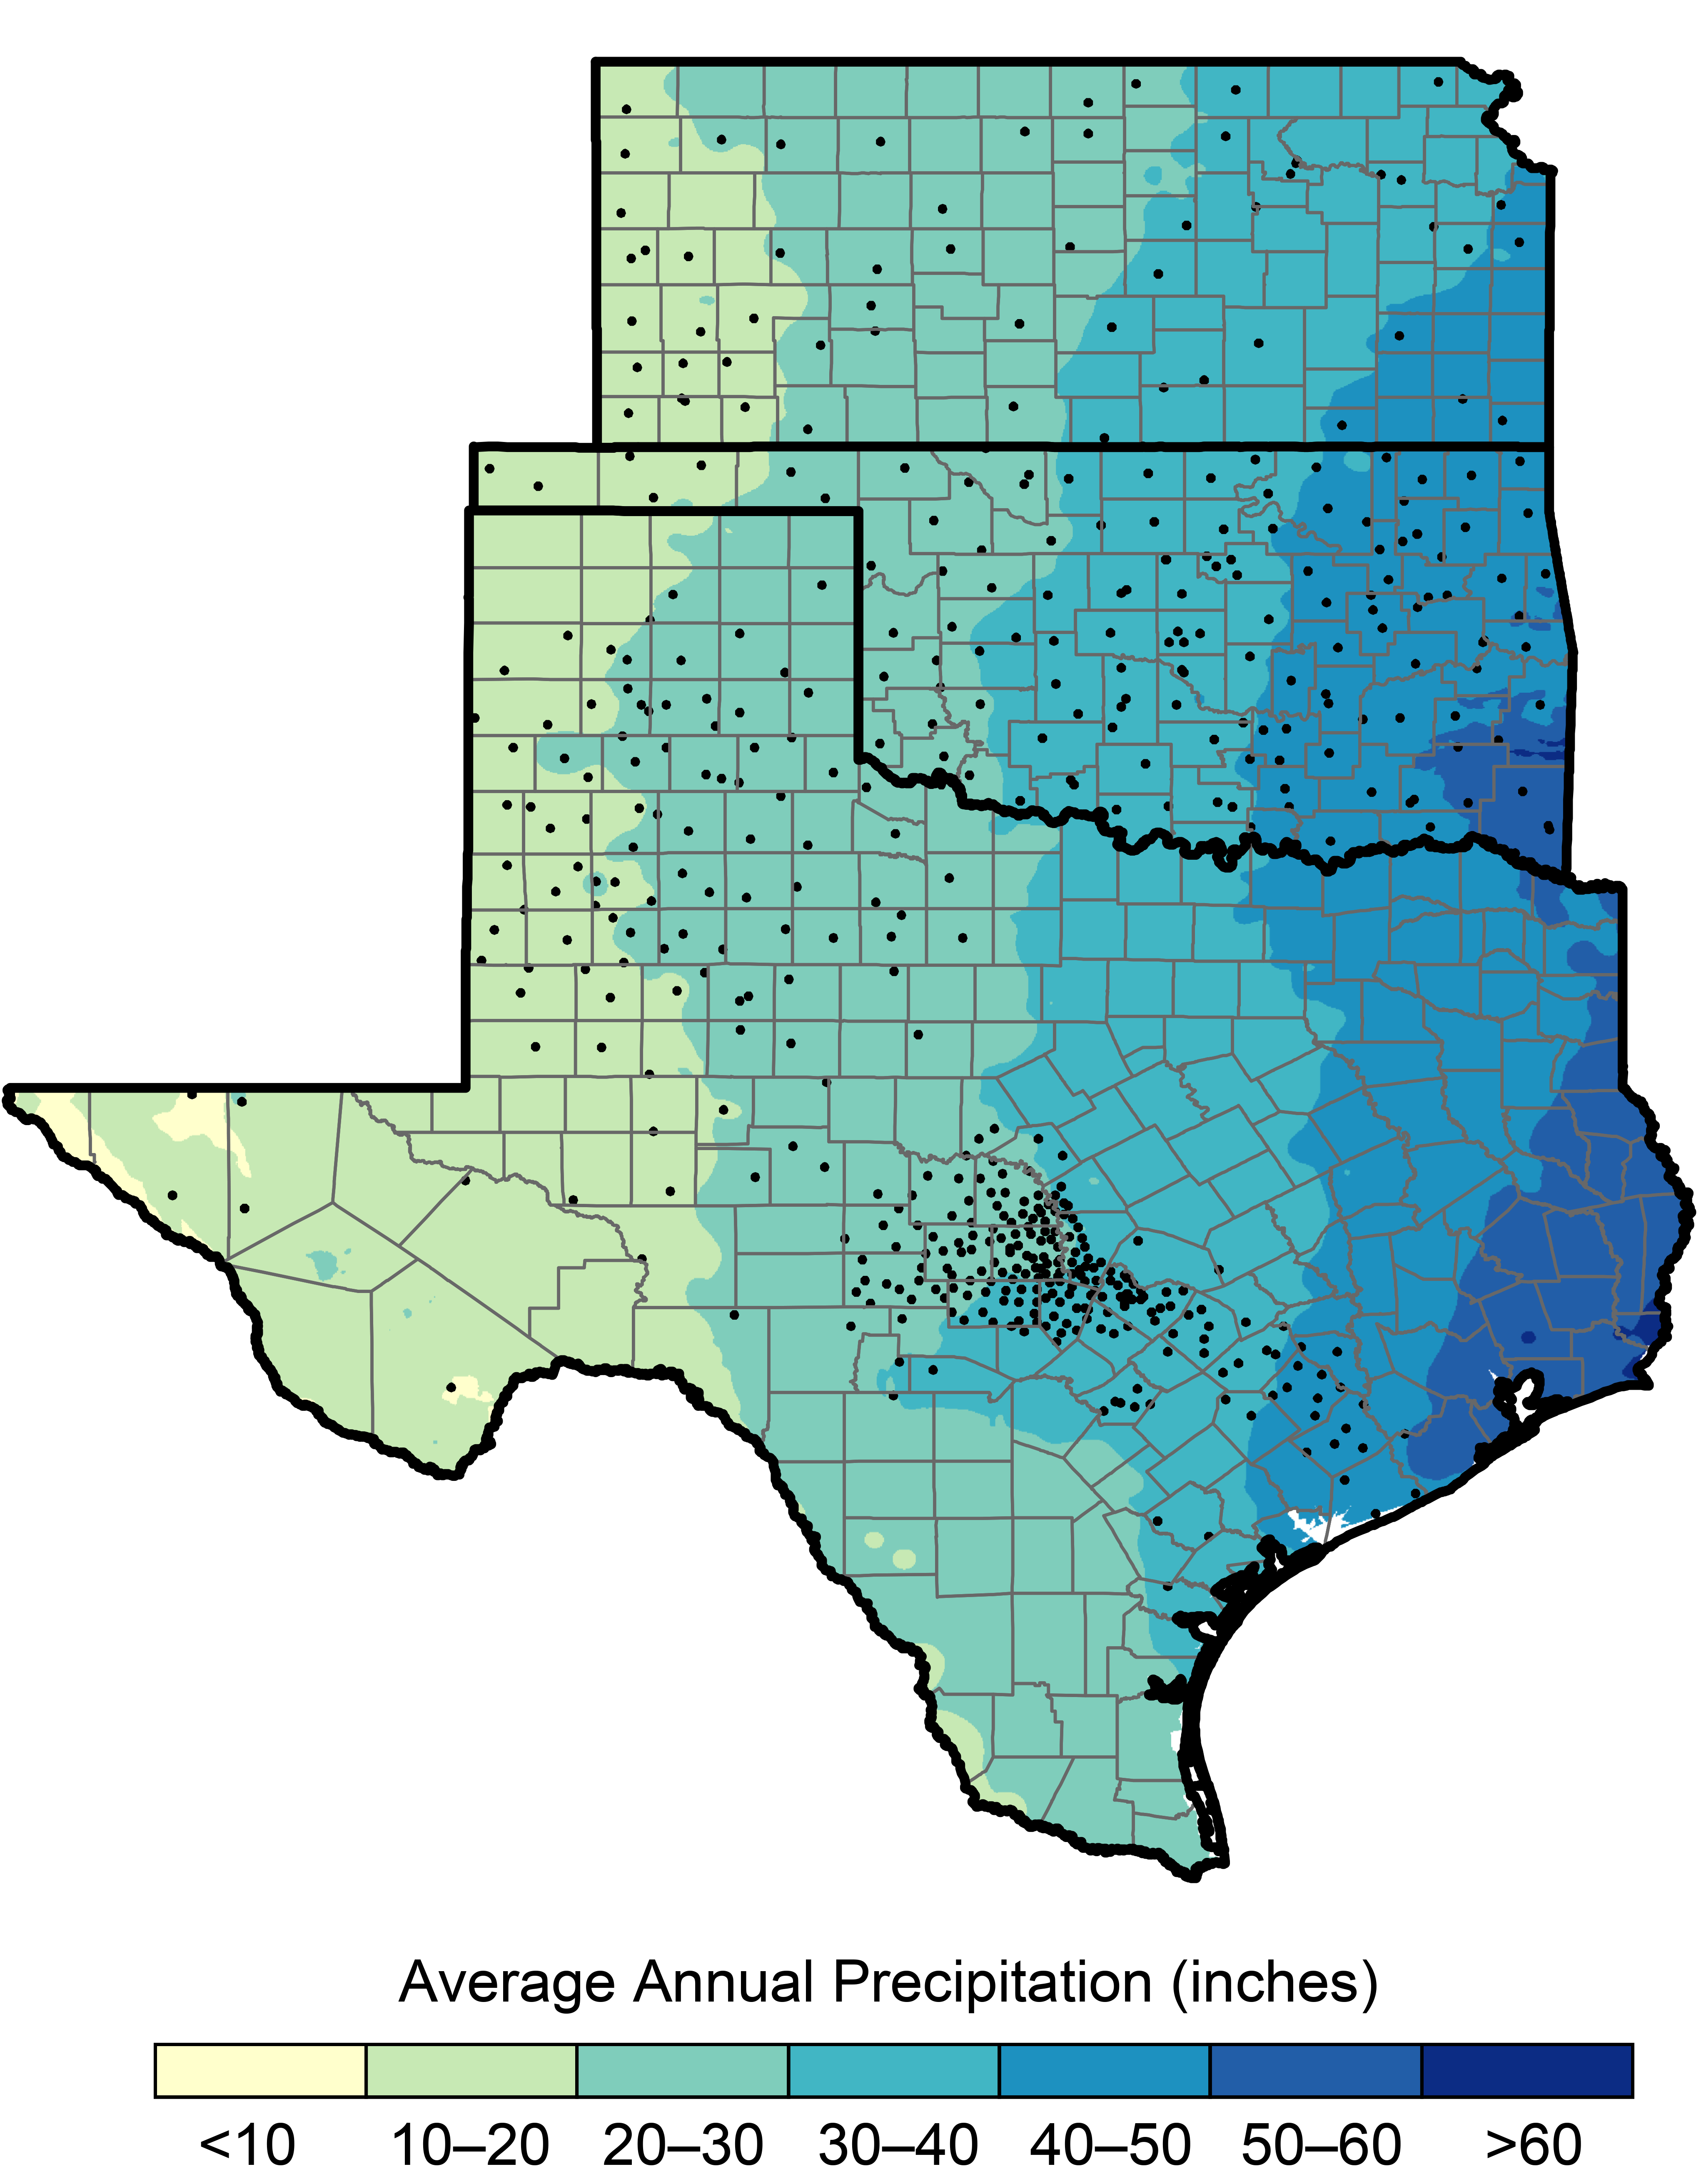
Climate conditions in the Southern Great Plains vary dramatically from the arid, high-elevation borders with the mountainous states of Colorado and New Mexico on the west, to the humid states of Missouri, Arkansas, and Louisiana in the Mississippi River valley on the east. Average annual precipitation ranges from less than 10 inches in the western reaches of the region to over 60 inches in the southeastern corner (Figure 23.1).
Figure 23.1: Monitoring Precipitation Across the Southern Great Plains
Figure 23.1: The Southern Great Plains is characterized by a pronounced east–west gradient of precipitation, with wetter conditions prevailing to the east and arid conditions to the west. Precipitation monitoring is critical in this region; state-level Mesonet station networks in Kansas, Oklahoma, and Texas are shown here to illustrate a key aspect of current monitoring capacity. Sources: NOAA NCEI, CICS-NC, and ERT Inc. Data from PRISM Climate group, Oregon State University, LINK, created July 10, 2010.
A large west-to-east contrast in surface water availability results, with large reservoirs in eastern parts of the region and few reservoirs in the west. Except for the Missouri River (a portion of the border for the Southern Great Plains), the Arkansas River, and the upper reaches of the rivers such as the Rio Grande, rivers in the region do not draw from mountain snowpack and are sensitive to seasonal rainfall amounts. The region is vulnerable to periods of drought, historically prevalent during the 1910s, 1930s, 1950s, and 2010–2015, and periods of abundant precipitation, particularly the 1980s and early 1990s. The region has experienced an increase in annual average temperature of 1°–2°F since the early 20th century, with the greatest warming during the winter months.
With the Gulf of Mexico to its southeast, the coastal Southern Great Plains is vulnerable to hurricanes and sea level rise. Relative sea level rise along the Texas Gulf Coast is twice as large as the global average, and an extreme storm surge in Galveston Bay would threaten much of the U.S. petroleum and natural gas refining capacity. Variations in freshwater flows and evaporation affect the salinity of bays and estuaries along the coast and have the potential to alter coastal ecosystems and affect the fishing industry. Tropical cyclones are also responsible for exceptional rainfall rates in the region. The U.S. record for greatest single-day rainfall is 43 inches, set in Alvin, Texas, in July of 1979, as Tropical Storm Claudette moved through the area. Houston, Texas, in particular, experienced several record-breaking floods in 2015, 2016, and 2017, with Hurricane Harvey rewriting the continental U.S. record for total rainfall from a tropical cyclone. Cedar Bayou, Texas (30 miles from Houston), recorded 51.88 inches of rain during the multi-day onslaught of Hurricane Harvey (see Box 23.1 for further discussion).
Over the past 50 years, significant flooding and rainfall events followed drought in approximately one-third of the drought-affected periods in the region when compared against the early part of the 20th century.10 Understanding this rapid swing from extreme drought to flood is an important and ongoing area of research in the region. As major metropolitan areas in the region continue their rapid population growth, overall exposure to extreme rainfall events will increase. Yet, even while record-breaking flooding events increased over the past 30 years, the Southern Great Plains experienced an overall decrease in flood frequency,11 possibly related to the decrease in total precipitation over the same period.
The Southern Great Plains is a critical thoroughfare for rail and road freight, supports numerous ocean and river ports within its borders, and is a major energy producer and exporter.12 Combined, the three-state region accounts for 25% of all U.S. energy production. The world’s largest oil-storage tank facility is located in Cushing, Oklahoma, with 13% of total U.S. storage and a convergence of several major pipelines. More than 550,000 miles of roads connect rural and urban communities and serve as vital infrastructure supporting state and local economies.13,14,15 The vast and dispersed nature of the region’s infrastructure makes investment in maintenance and rehabilitation of deficient and aging infrastructure difficult. Infrastructure is typically designed to withstand historical climate extremes and is exposed to the environment year-round. Therefore, as the intensity and frequency of climate-related extremes (such as heat, drought, flooding, and severe storms) increase, impacts to the region are usually adverse and costly. The Southern Great Plains ranks near the top of states with structurally deficient or functionally obsolete bridges, while other bridges are nearing the end of their design life.16,17,18 Road surface degradation in Texas urban centers is linked to an extra $5.7 billion in vehicle operating costs annually (dollar year not reported).15 The region has tens of thousands of dams and levees; however, many are not subject to regular inspection and maintenance and have an average age exceeding 40 years.16,17,18 Most state and local budgets are unable to meet the funding needs for infrastructure improvements, particularly in rural towns where funding is largely derived from municipal revenue. In urban centers, population growth is anticipated to require expansion of transportation infrastructure and services and revisions to flood control structures and policies16,17,18 and result in increased water resource needs and a growth in building demand.19,20
Understanding the potential for future changes in the frequency and severity of weather events and their impacts will ultimately determine the sustainability of economies, cultures, ecosystems, health, and life in the region. Over the past two decades, state and local governments have invested in the creation of weather monitoring networks (“Mesonets”) that are designed to measure important weather and climate parameters (Figure 23.1).21 Mesonet stations are critical infrastructure required to establish the long-term climate record for the region. Mesonet observations have been especially critical for predicting and preparing for extreme weather events like droughts, floods, ice storms, and severe convective storms, as well as for developing value-added products. These data are used daily by decision-makers, public safety officials, educational institutions, the agricultural sector, and researchers, generating societal and economic benefits that greatly exceed the investments made in these systems.22,23
Projections
Climate change is expected to lead to an increase in average temperatures as well as frequency, duration, and intensity of extreme heat events and a reduction in extreme cold events. Annual average temperatures in the Southern Great Plains are projected to increase by 3.6°–5.1°F by the mid-21st century and by 4.4°–8.4°F by the late 21st century, compared to the average for 1976–2005, and are dependent on future scenario, with higher levels of greenhouse gas emissions leading to greater and faster temperature increases. Extreme heat will become more common. Temperatures similar to the summer of 2011 will become increasingly likely to reoccur, particularly under higher scenarios. By late in the 21st century, if no reductions in emissions take place, the region is projected to experience an additional 30–60 days per year above 100°F than it does now (Figure 23.4)24.
Figure 23.4: Projected Increase in Number of Days Above 100ºF
Figure 23.4: Under both lower- and higher-scenario climate change projections, the number of days exceeding 100°F is projected to increase markedly across the Southern Great Plains by the end of the century (2070–2099 as compared to 1976–2005). Sources: NOAA NCEI and CICS-NC.
The role of climate change in altering the frequency of the types of severe weather most typically associated with the Southern Great Plains, such as severe local storms, hailstorms, and tornadoes, remains difficult to quantify.1,2 Indirect approaches suggest a possible increase in the circumstances conducive to such severe weather,3 including an increase in the instances of larger hail sizes in the region by 2040,4 but changes are unlikely to be uniform across the region, and additional research is needed.
Along the Texas coastline, sea levels have risen 5–17 inches over the last 100 years, depending on local topography and subsidence (sinking of land).25 Sea level rise along the western Gulf of Mexico during the remainder of the 21st century is likely to be greater than the projected global average of 1–4 feet or more.26 Such a change, along with the related retreat of the Gulf coastline,27 will exacerbate risks and impacts from storm surges.
Average annual precipitation projections suggest small changes in the region, with slightly wetter winters, particularly in the north of the region, and drier summers.1 However, the frequency and intensity of heavy precipitation are anticipated to continue to increase, particularly under higher scenarios and later in the century.1 The expected increase of precipitation intensity implies fewer soaking rains and more time to dry out between events, with an attendant increase in soil moisture stress. Studies that have attempted to simulate the consequences of future precipitation patterns consistently project less future soil moisture, with future conditions possibly drier than anything experienced by the region during at least the past 1,000 years.28
While past hydrologic extremes have been driven largely by climate variability, climate change is likely to exacerbate aridity in the Southern Great Plains, largely associated with drying soils due to increased evapotranspiration caused by higher temperatures.1,29
Food, Energy, and Water Resources
Quality of life in the region will be compromised as increasing population, the migration of individuals from rural to urban locations, and a changing climate redistribute demand at the intersection of food consumption, energy production, and water resources. A growing number of adaptation strategies, improved climate services, and early warning decision support systems will more effectively manage the complex regional, national, and transnational issues associated with food, energy, and water.
Food, energy, and water systems are inseparable. Any change in demand for one will impact demand on the other two. The quality of life of the 34 million people residing in the Southern Great Plains is dependent upon the resources and natural systems for the sustainable provision of food, energy, and water. At least 60% of the region’s population is clustered around urban centers, which are experiencing population growth that exceeds that of rural communities. The remaining population is spread across vast areas of rural land.14,30,31,32,33 As the population in the region grows, rapid urbanization and economic development opportunities will drive an increase in the demand for food, energy, and water. Water is used in every aspect of agricultural production and electricity generation. Energy is required to extract and deliver water of sufficient quality for diverse human and agricultural use, as well as healthy consumption and wastewater treatment. Both water and energy are required to irrigate and process agricultural products and livestock to feed the region’s increasing population. The complex interdependencies at the food–energy–water nexus create enormous challenges.
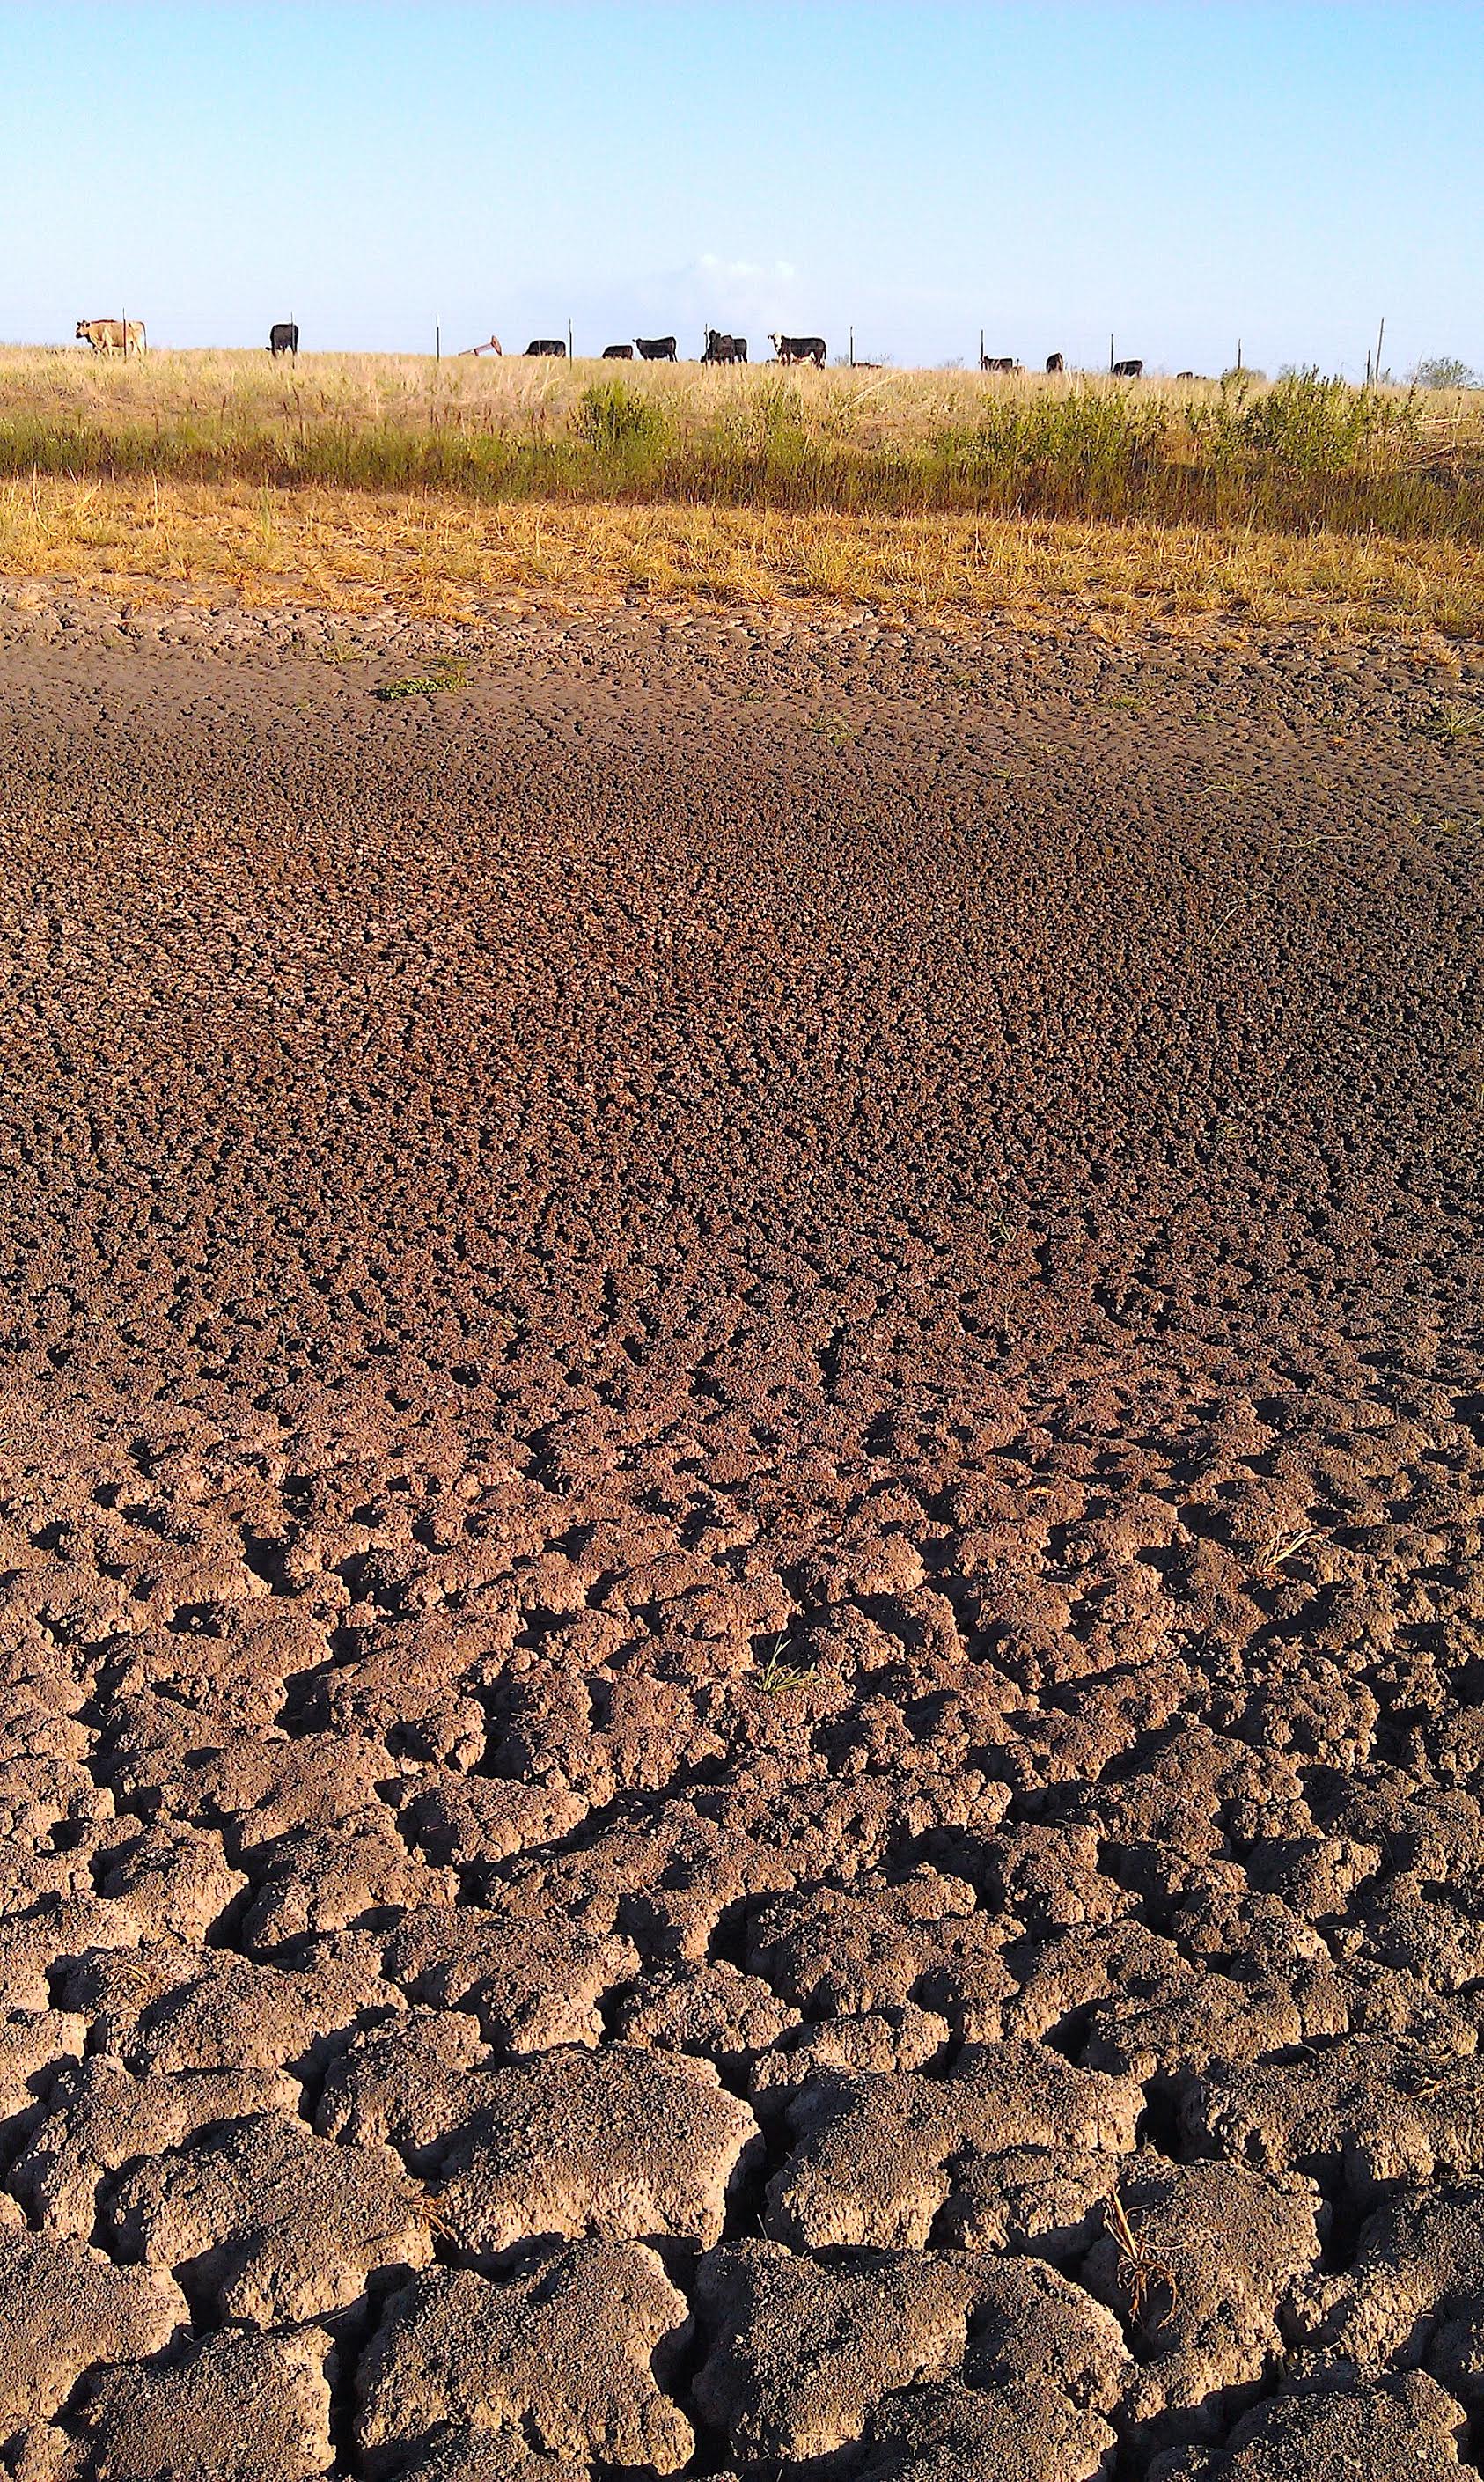
When severe drought affected the Southern Great Plains in 2011, limited water availability constrained the operation of some power plants and other energy production activities. Contention for water developed between consumers associated with the food–energy–water nexus. The recent boom in domestic unconventional oil and gas development brought on by hydraulic fracturing and horizontal drilling represents another stressor to this nexus. This development has added complexity to the regional dialog about the relationship between food, energy, and water resources.
Figure 23.5: The photo shows the drought impact on a stock pond near Kurten, Texas, in 2011. Photo credit: John …
Superimposed on the existing complexities at the intersection of food, energy, and water is the specter of climate change. During 2010–2015, the multiyear regional drought severely affected both agricultural and aquatic ecosystems. One prominent impact was a reduction of irrigation water released for the Texas Rice Belt farmers on the Texas coastal plains, as well as a reduction in the amount of water available to meet instream flow needs in the Colorado River and freshwater inflow needs to Matagorda Bay. The Lower Colorado River Authority (LCRA), through its Water Management Plan (WMP), balances the needs of competing water demands in the Lower Colorado River Basin of Texas. Depending upon the amount of water stored in lakes, the WMP requires that LCRA reduce or cut off interruptible stored water for most downstream agriculture so firm water supplies are available to meet the basic needs of cities, businesses, and industries during drought.
In one year, planted acres of rice in Matagorda County, Texas, dropped from 22,000 acres to 2,100 acres.34 The ripple effect on the local economy was severe, with a 70% decline in sales of farm implements and machinery. Some family-owned establishments that had survived for decades closed permanently.35 Irrigation strategies shifted from river-based to pumping water from the Gulf Coast Aquifer, and dozens of new wells were drilled. Drilling water wells then resulted in declining groundwater levels, adding stress to water levels that had historically been falling in the region.36 Some farmers attempted to adapt by making the difficult transition to other crops such as corn. However, when flooding rains inundated the region in 2016, 15% of the corn crop was swept away in flood waters.37 Thus the 2010–2015 drought simultaneously affected agriculture, energy, recreation, and economic activity, eventually leading to increased groundwater development and potential future overexploitation. Projected increases in drought duration and severity imply even more pervasive direct and indirect effects. These impacts might have been even more severe had it not been for adaptation actions taken by the City of Austin, including implementation of drought contingency plans and water-use cutbacks in coordination with the City Council and community.
Climate change has significant negative impacts on agriculture in the United States, causing substantial economic costs (Ch. 10: Ag & Rural).38,39 The effects of drought and other occurrences of extreme weather outside the Southern Great Plains also affect the food–energy–water nexus in the region. The neighboring Southwest region is especially vulnerable to climate change due to its rapidly increasing population, changing land use and land cover, limited water supplies, and long-term drought (Ch. 25: Southwest).40 States in the Southern Great Plains import over 20% of their food-related items from Arizona, and El Paso, Texas, receives 25% of its consumable foods (mostly vegetables) and 18% of its animal feed supplies from Arizona.41 In addition, relationships across the border of the Southern Great Plains with Mexico will be critical to a better understanding of the food–energy–water nexus (see Case Study “Rio Grande Valley and Transboundary Issues”) (see also Ch. 16: International, KM 4).
The 2017 Texas State Water Plan52 indicates that the growing Texas population will result in a 17% increase in water demand in the state over the next 50 years. This increase is projected to be primarily associated with municipal use, manufacturing, and power generation, owing to the projections of population increase in the region. Likewise, the Oklahoma Water Plan indicates that water use projections in Oklahoma are expected to increase by 21% for municipal use, 22% for agricultural use, and 63% for energy use.53 The Kansas Water Plan’s preliminary assessment of projected water demand in Kansas also shows an increase of 20%, but with the expected variability depending upon rural versus urban areas.54 Throughout much of western Kansas, western Oklahoma, and the Texas Panhandle, groundwater from the Ogallala Aquifer is the dominant water source,17,55 benefitting the agricultural sector in particular. This resource is known to be shrinking faster than it is replenishing, and some portions are likely to become an insufficient source or become completely depleted within the next 25 years, particularly at its southernmost extent.17 Drought more persistent than that experienced in the region’s recent history would trigger large social and economic consequences, including shifting agriculture, migration, rising commodity prices, and rising utility costs.20
The importance of groundwater as a resource will increase under a changing climate as the intensification of hydrologic extremes decreases the reliability of precipitation, soil moisture, and surface water, and as surface water supplies are becoming increasingly over-allocated.56,57,58
Research into the food–energy–water nexus is in its early stages and historically tends to examine only one or two components.59,60,61,62,63,64,65 It is clear that tradeoffs and cascading complexities exist between sectors, and changes in one sector are likely to propagate through the entire system (Ch. 17: Complex Systems). There are significant gaps in the scientific understanding regarding the role that climate change will play as a disruptive force and a threat to food, energy, and water security.60,63,66,67,68
Infrastructure
The built environment is vulnerable to increasing temperature, extreme precipitation, and continued sea level rise, particularly as infrastructure ages and populations shift to urban centers. Along the Texas Gulf Coast, relative sea level rise of twice the global average will put coastal infrastructure at risk. Regional adaptation efforts that harden or relocate critical infrastructure will reduce the risk of climate change impacts.
Climate change is anticipated to lead to higher average temperatures year-round and an increase in the frequency of very hot days (days with maximum temperatures above 100°F), with the number of such days possibly doubling by mid-21st century (Figure 23.4).80 An increase in temperatures is virtually certain for the Southern Great Plains. Longer, hotter summers will place strain on cooling systems and energy utilities, road surfaces, and water resources, particularly during drought, although warmer winters are likely to reduce heating demands and winter road maintenance costs. The rate of temperature rise will be especially large within urban centers due to possible intensification of the urban heat island (UHI) effect, although the degree of heating will likely vary by city, and it is difficult to obtain precise quantitative estimates. Warmer temperatures will likely lead to an increase in evaporation and therefore an increase in moisture in the air81,82 and an increase in heat stress, especially during the summertime.83 During excessive heat in July 2011, downtown Dallas experienced late-evening temperatures 6.1°F higher than rural Kaufman, Texas, 36 miles away.84 Population growth, increased urban density, and expansion will intensify the UHI effect for many Southern Great Plains cities, necessitating more energy use for cooling. This strains energy utilities and can further enhance the UHI effect.85 If prolonged power failure occurs during high heat conditions, the impact to human health and comfort is projected to be notably more detrimental in a warmer climate.86
Increased aridity (or dryness) is also projected for the Southern Great Plains with climate change, due to enhanced evapotranspiration and depleted soil moisture associated with increased temperatures.1,29 In the past, drought conditions have decreased surface water availability (such as from reservoirs), leading to an increase in the use of groundwater. In some cases, new pipelines were needed and water had to be imported.20 Compounding infrastructure challenges for the region include aging and over-capacity water pipelines.53 The Texas Water Development Board87 projected that by 2060, municipal water use will increase to 41% of available supply (versus 9% in 2010). Therefore, a record drought scenario occurring in 2060 would result in as much as half of the state’s population facing a water supply shortage. Additionally, water infrastructure can be damaged by drought. During summer 2011, water main breaks were common, with 200 breaks in Fort Worth, Texas, in one month and over 1,000 in one month in Houston, Texas,20 associated with shrinkage of clay soil, a common soil type throughout the Southern Great Plains. Soil shrinkage can damage both surface and subsurface infrastructure, including roads, water and sewer lines, and building foundations. Periods of abundant precipitation followed by drought and high temperatures are also linked to increased wildfire activity in the region.88 Texas experienced several major wildfire outbreaks during the drought of 2011, including the Bastrop Fire that destroyed more than 1,500 homes. More recently in 2016 and 2017, fires in Kansas and Oklahoma have exceeded 400,000 acres and were among the largest in the region’s history. These events killed thousands of cattle, contributed to several human fatalities, and damaged, displaced, or isolated rural communities.89 Model simulations indicate that wildfire risk will increase throughout the region as temperatures rise, particularly in the summer, and the duration of the fire season increases.90
Following the abrupt end to the persistent drought in 2015, the region suffered extensive damage associated with river and flash flooding.10,91,92 Precipitation totals for a 120-day period during the spring of 2015 in south-central Oklahoma were above 40 inches, approximately the average annual amount in many locations,93,94 largely associated with multiple episodes of very heavy rain. Numerous state and U.S highways experienced regional detours or closures.94 A rockslide on Interstate Highway 35 closed portions of the road for several weeks.94,95 Flooding in Oklahoma and Texas caused an estimated $2.6 billion in damage in 2015,95 with $1 million in emergency relief funds provided by the U.S. Department of Transportation’s Federal Highway Administration to assist in the repair of damaged roads.96 The increasing frequency of extreme precipitation that is projected by climate models is anticipated to contribute to further vulnerability of existing highway infrastructure, although the magnitude and timing of projected precipitation extremes remain uncertain.1
Changing precipitation frequency and increases in the magnitude and frequency of heavy precipitation will place more stress on existing water resource infrastructure. The region has a large number of older dams and levees, many of which have received poor grades from the American Society of Civil Engineers.16,17,18 Between 1982 and 2012, 82 dams failed in Texas, and during 2015 the high-hazard Lewisville Dam was of concern due to observed seepage.18,97 As climate conditions continue to change, rare events such as 100-year floods (those that currently have a 1% chance of occurring in any given year) are likely to become more common.1,29 Future extremes may exacerbate flooding and wear and tear on existing flood control infrastructure and will necessitate revisions to design standards for flood infrastructure and a reevaluation of floodplains. Floodplain management and mitigation of flooding are currently left largely to local governments and cities and are thus reliant on local funding and resources for successful implementation.16,17,18 While there are clear implications of more variable and extreme precipitation on infrastructure, the precise links between specific events and their resulting damage are uncertain as most infrastructure is exposed to both climatic and non-climatic stressors whose effects are difficult to separate without a high degree of monitoring.
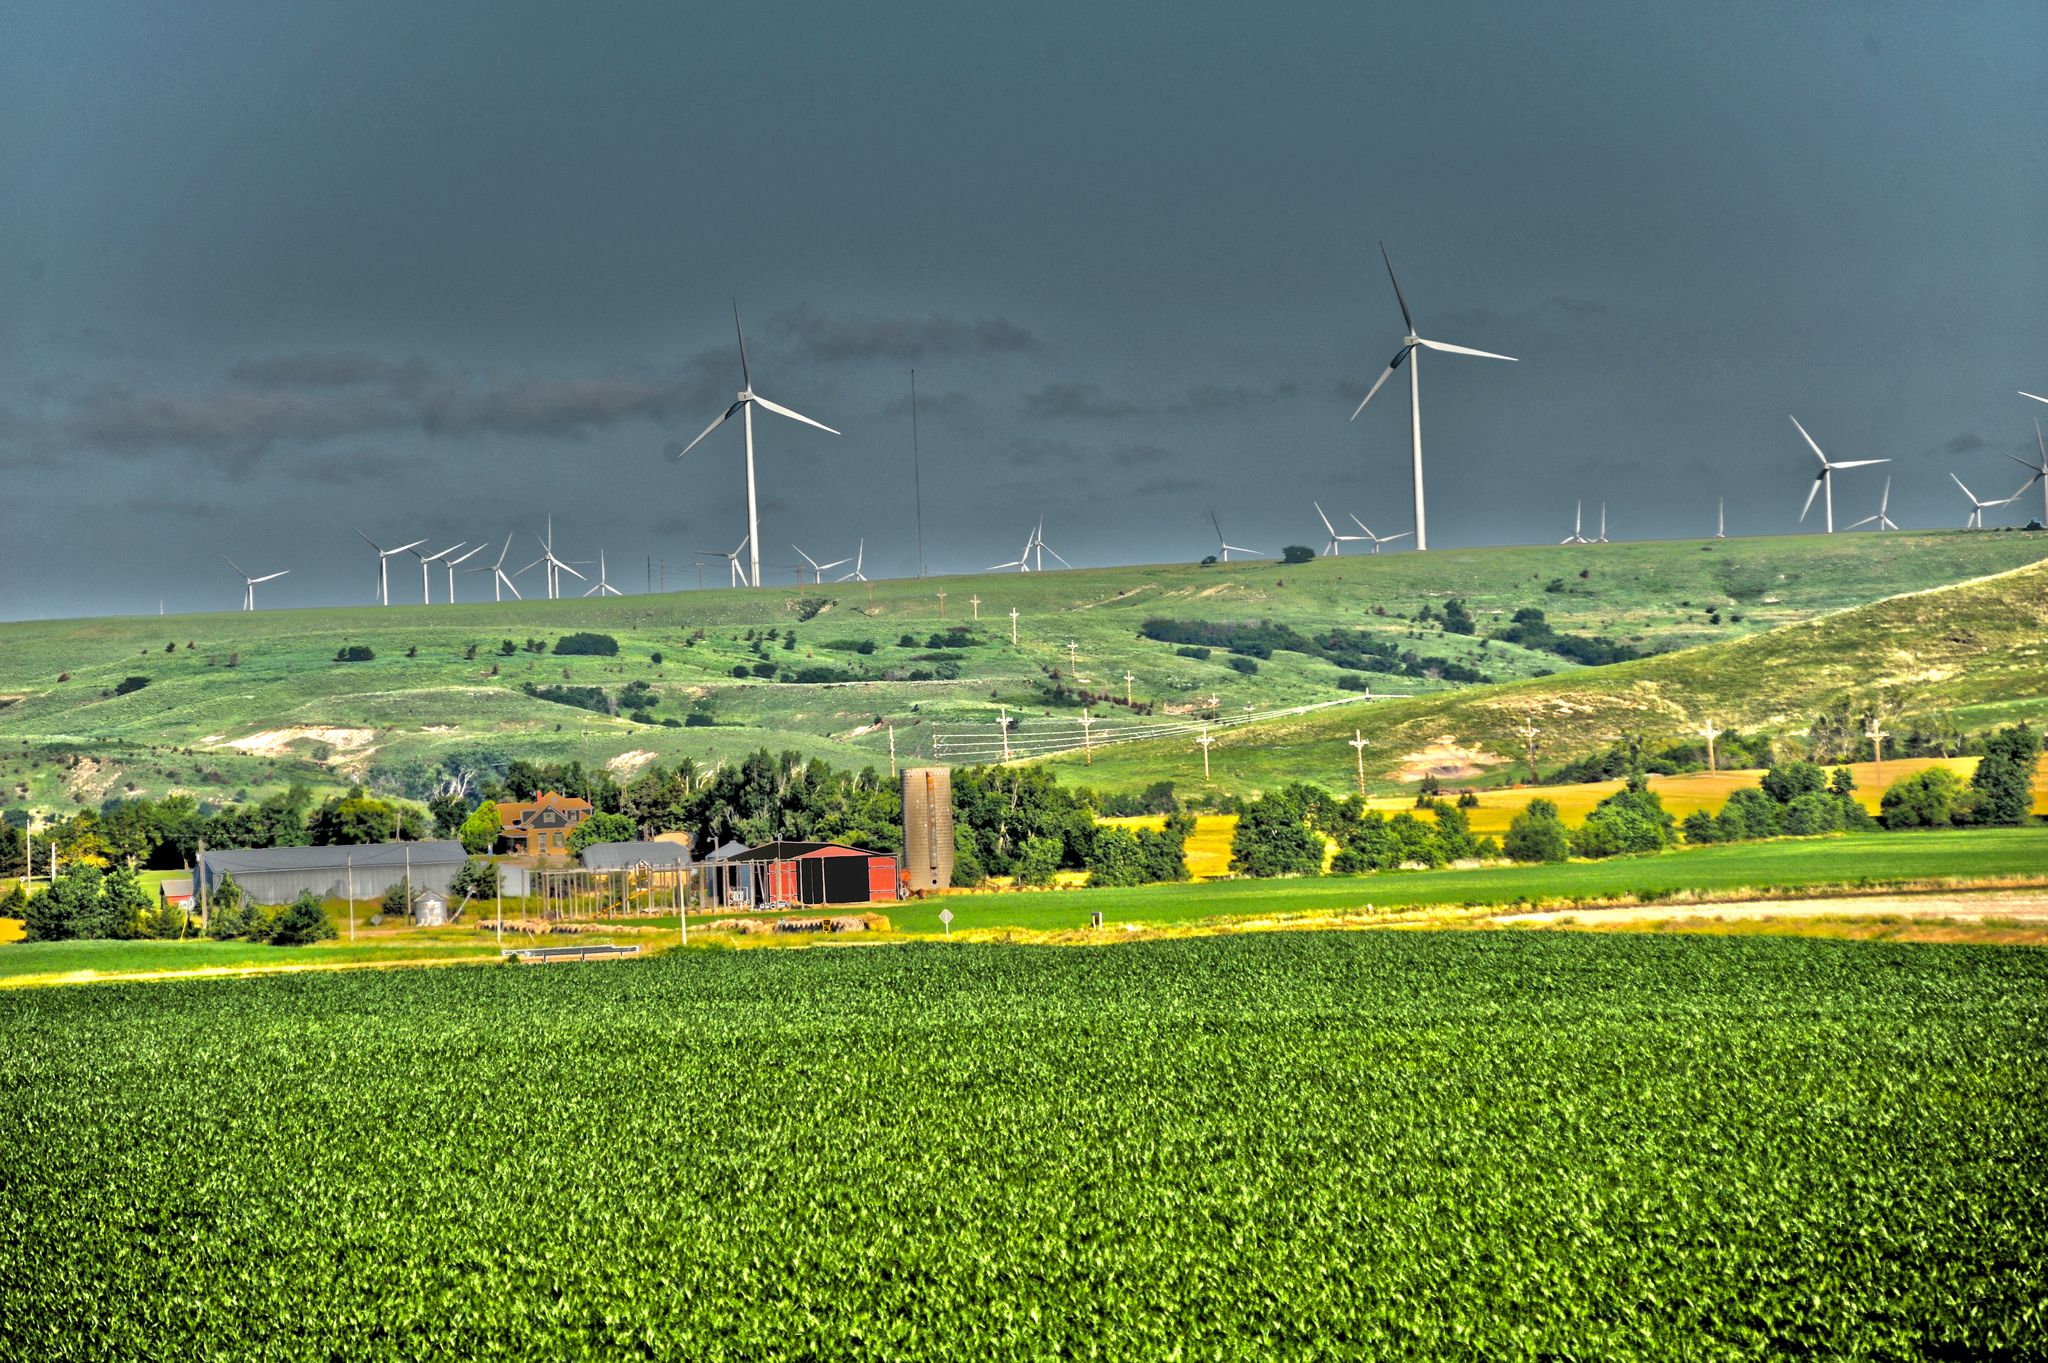
As the energy industry undergoes, to some extent, a reinvention, it is taking climate and extreme weather events into consideration in design, operations, and reliability. An Edison Electric Institute (2008) study estimated that by 2030, the U.S. electric utility industry will need to make a total infrastructure investment of between $1.5 trillion and $2.0 trillion, of which transmission and distribution investment is expected to account for about $900 billion.98 These investments increasingly include renewable energy and distributed generation, smart grid technologies, and storage. From 2008 to 2013, the amount of electricity generated from wind has more than tripled and the amount from solar has increased more than tenfold.99 These enhancements would need to be reliable (able to operate within limits so that instability, uncontrolled events, or cascading failures do not result if there is a disturbance), resilient (able to adapt to changing conditions and withstand and rapidly recover from disruptions), safe, flexible, and affordable.
Coastal regions are among the most vulnerable to climate change due to their direct exposure to rising sea levels and damaging storm surge. Global mean sea level is very likely to rise by 1–4 feet (0.3–1.3 m) by 2100 relative to 2000 levels. Under certain future conditions, a rise exceeding 8 feet (2.4 m) by 2100 is physically possible, although the probability of such an extreme outcome cannot currently be assessed (Ch. 2: Climate, KM 4). Since the early 20th century, areas of the Texas coast have experienced sea level rise (SLR) higher than the global average, associated with extraction of both fossil fuels and groundwater.25 Within Texas alone, 1,000 square miles of land is within 5 feet of the high tide line, including $9.6 billion in current assessed property value and homes to about 45,000 people. Sensitive assets include 1,600 miles of roadway, several hospitals and schools, 4 power plants, and 254 EPA-listed contamination sites (hazardous waste and sewage).100 Up to $20.9 billion in coastal property is projected to be flooded at high tide by 2030, and by 2050, property values below the high-water mark are projected to be in excess of $30 billion, assuming current trends of greenhouse gas emissions.101 The coastline in the vicinity of Galveston and Texas City is also a critical oil refining and transport hub. SLR will affect numerous coastal assets, including residential communities, roads, waterways, and energy generation facilities, and move the risk of damaging storm surge well inland of present areas of impact. With 2 feet of SLR, cities such as Galveston and Corpus Christi will be exposed to more frequent flooding.100,102,103,104
Disruption to coastal oil-refining facilities can cause cascading failures throughout the region, including fuel shortages and higher prices. Saltwater intrusion of aquifers has been observed in the Gulf Coast Aquifer, the second most utilized aquifer in Texas, which supports 8 million people. Although this was in part associated with heavy pumping,105 the Gulf Coast Aquifer remains vulnerable to further saltwater intrusion resulting from SLR and storm surge exacerbated by climate change.106
Due to the historical frequency of drought, water conservation activities are already recognized as important and encouraged in many municipalities. Common strategies include rainwater harvesting, encouraging improved residential water-use efficiency, water audits, and restricted water use in times of drought.20 Other proactive measures currently in place in some communities aim to mitigate longer-term risks and involve wastewater treatment and reuse, aquifer storage and recovery, and desalination (see Case Study “Meeting Current and Future Water Needs in El Paso, Texas”).20
The built environment is vulnerable to increasing temperature, extreme precipitation, and continued sea level rise, particularly as infrastructure ages and populations shift to urban centers. Along the Texas Gulf Coast, relative sea level rise of twice the global average will put coastal infrastructure at risk. Regional adaptation efforts that harden or relocate critical infrastructure will reduce the risk of climate change impacts.
Climate change is likely to require modification and updating of design standards in order to accommodate changes in risk that cannot be accounted for based on history. For example, in transportation design, these modifications might include changing the minimum and maximum temperature rating for binders used in asphalt roads to improve durability; structural modifications to bridges to meet the demands of higher summer temperatures; updating the data used for calculating flooding of dams and neighborhoods; restricting rail speeds during hot temperatures; and shifting timing of maintenance activities. Many technological solutions exist or are in development to build resilience to these climate-related challenges. However, the aforementioned stressors and budgetary challenges will continue to present notable challenges to adaptive capacity in the Southern Great Plains (Ch. 12: Transportation).
Many studies have documented economic impacts of climate change on different sectors in the United States).111,112,113,114,115 For example, predictive analyses estimate that climate change and coastal development will cause hurricane damage to increase faster than the U.S. economy is expected to grow. The number of people expected to face substantial damage will, on average, increase more than eightfold over the next 60 years.116 Although economic analyses for specific regions, sectors, and states in the Southern Great Plains are currently limited, active ongoing research is beginning to produce critical metrics regarding the socioeconomic impacts of climate change at regional scales.117
The role of economics is increasingly recognized as being critical for advancing the resilience of households, businesses, and local governments, and also for the broader economic adaptation of entire regions. Establishing economic resilience in a local business or a regional economy requires the ability to anticipate risk, evaluate how that risk can impact key economic assets, and build a responsive adaptive capacity. At the regional or community level, economic development practitioners can build capacity for economic resilience.
Ecosystems and Ecosystem Services
Terrestrial and aquatic ecosystems are being directly and indirectly altered by climate change. Some species can adapt to extreme droughts, unprecedented floods, and wildfires from a changing climate, while others cannot, resulting in significant impacts to both services and people living in these ecosystems. Landscape-scale ecological services will increase the resilience of the most vulnerable species.
The Southern Great Plains encompasses diverse ecoregions (areas where ecosystems are generally similar) stretching from the High Plains to the Edwards Plateau and from the Tamaulipan Brushlands to the Gulf Coast Prairie.118 The region is prone to periods of drought punctuated by heavy rainfall events, with evidence that these events are occurring more frequently.10 These precipitation patterns influence water availability and aquatic habitats such as lakes, rivers, springs, and streams. Freshwater inflows from rivers flowing to coastal estuaries provide important nutrients and sediments while moderating salinities to create and maintain productive estuarine ecosystems.
Species Distribution and Habitats
Climate plays a key role in the distribution of species (Ch. 7: Ecosystems). Species’ response to climate change is complex and variable.119 As temperatures increase, the geographic distribution of some species tends to shift to areas with temperature ranges where a given species can survive. A notable species of concern in the region is the lesser prairie‐chicken, which was listed as threatened under the U.S. Endangered Species Act in May 2014. Currently, the lesser prairie‐chicken habitats include Kansas, Texas, and Oklahoma (as well as Colorado and New Mexico) with 70% of the population in Kansas.120 At this time, it is not clear whether climate change will influence the lesser prairie-chicken in positive or negative ways.121,122 Rising temperatures are also causing changes to growing seasons and migration patterns of birds and butterflies.123 In Texas, white-wing doves, originally confined to the Lower Rio Grande valley, have been expanding northward124 and are now common across Oklahoma. Other factors such as habitat loss also influence species distributions, making it difficult to pinpoint a single cause for these distribution changes.
While it is unclear how climate change will affect species directly, the effects of increased aridity will likely have negative impacts. In addition, ecosystem services—the materials and processes that ecosystems produce that benefit people—will also be affected.123 In general, drought forces wildlife to travel farther to locate food, water, and shelter, which can deplete body condition going into winter or spring migration, when food sources are typically scarcer, making them more vulnerable to other stresses. The highly endangered Houston toad was negatively impacted during the 2011 drought and devastating wildfire in Bastrop County, Texas. Whooping crane numbers, which depend on sufficient freshwater inflows for a reliable food source (primarily blue crabs), were also reduced. In addition, a lack of freshwater can force whooping cranes to fly to uplands to drink, using more energy and exposing birds to more threats from predators and other mortality factors.
Aridification exacerbates stress in highly isolated habitats and fragmented lands, diminishing the ability for species to persist if they cannot move to better conditions. Migratory birds are better able to move to areas with better habitat conditions but could be in a weakened condition to do so. Migratory waterfowl can also be negatively impacted by reductions in wetland habitat areas due to aridification. Loss of irrigated rice fields in Texas contributed to significant declines in wintering waterfowl along the Gulf Coast. The most significant decline was documented for snow geese, with a 71% decline for 2011–2014 as compared to the long-term average.125 Playa lakes in the High Plains serve as important habitat for migrating waterfowl, but during the drought these wetlands were virtually nonexistent.
Plant community changes are also occurring, possibly due to climate change and other factors, and these changes in turn affect fish and wildlife. In the Southern Great Plains region, winters are warmer and spring is arriving earlier. Along the Texas coast, black mangroves, which are sensitive to cold, are expanding northward along the coast, and red mangroves, formerly not found in Texas, are now appearing there.126 Warmer winters with fewer freezes are also conducive to pests and diseases. Woody shrubs invading prairie grasslands are favored by increases in concentrations of carbon dioxide (CO2), changes in soil moisture cycles, fire suppression activities, and soil disturbances.125 The 2011 drought produced a direct and indirect tree mortality rate of over 6%—many times the normal rate.127
Aquatic Ecosystems
Climate change impacts to aquatic ecosystems include higher water temperatures in lakes, wetlands, rivers, and estuaries that can result in lower dissolved oxygen, leading to more fish kills. Impacts to reservoirs include fluctuating lake levels, loss of habitat, loss of recreational access, increase in harmful algal blooms, and disconnectedness from upstream and downstream riverine habitats.128 Localized declines in fish populations have been documented in rivers due to lack of water or water confined to increasingly narrow pools; in some cases, these declines prompted biologists to capture and relocate some endangered species to fish hatcheries.129 Aridification (a gradual change to a drier climate) can have a number of negative impacts on freshwater mussel populations, including increased predation pressures, hypoxia (low oxygen conditions), increasing water temperature, and, ultimately, anoxia (no dissolved oxygen in water) or emersion (stranding the organism out of water and exposing it to air).
Coastal Areas, Bays, and Estuaries
The Texas coast, with 6.5 million people contributing over $37 billion to the region's economy, relies on its natural features, bays, and estuaries that serve as storm barriers to protect coastal infrastructure, and on its climate amenities to spur ecosystem services, such as fishing, ecotourism, and the ocean economy. These coastal ecosystems provide protection not only for people but also for 25% of the Nation's refining capacity, four crucial ports, much of the strategic petroleum reserves, and strategic military deployment and distribution installations. This protection was clearly on display with the recent impacts of Hurricane Harvey, where it has been estimated that natural coastal habitats protected about $2.4 billion worth of property in Texas and thousands of lives, with the suggestion that these habitats are potentially our first lines of defense.130
A rising sea level impacts more than 74% of Gulf-facing beaches in the upper Texas coast. The average rate of beach erosion is almost 10 feet per year.131 Sea level rise means more frequent and longer-lasting flooding of marshes that eventually could be permanently flooded, becoming open water.126,132 Higher tides and storm surges cause inundation of freshwater areas and beach erosion, leading to a potential decrease or loss of barrier islands and coastal habitats, including nesting habitats and submerged habitat such as seagrass beds affected by changes in water quality and changing water depths. A significant percentage of fishery species in the Gulf of Mexico are dependent upon estuaries for some portion of their life cycle.133
The warming of bay waters on the Texas coast has been documented for at least 35 years. This mostly reflects warmer winters, not warmer summers. The increase in water temperature directly affects water quality, leading to the higher potential for low levels of dissolved oxygen, or hypoxia. Hypoxic events and harmful algal blooms have caused fish kills, leading to lower productivity and diversity of estuarine ecosystems.126
Freshwater inflows are critical to both aquatic ecosystems and wetlands in the Southern Great Plains. Both surface and groundwater depletion have led to dramatic changes of the aquatic and wetland communities in Kansas134 that not only impact inland species but have a dramatic effect on coastal species relying on the freshwater inflow to ensure the integrity of the coastal ecosystem. Whooping crane and many other migratory species flying through this region during both spring and fall are impacted.135 Climate change and human use have impacted these aquatic systems and wetlands and, ultimately, the vital flow of freshwater to the coastal marshes and estuaries.
Changes to freshwater inflows to estuaries lead to changes in salinity and inflows of nutrients and sediment, resulting in impacts to oysters and other sensitive estuarine species. In addition, harmful algal blooms have become more frequent, more intense, and more widespread.123 Reduced freshwater inflows during 2011 led to record high salinities in Texas estuaries that contributed to a coast-wide “red tide” harmful algal bloom event. Red tides, a type of harmful algal bloom, most commonly occur during drought years, as the organism that causes red tide does not tolerate low salinity. Red tide blooms cause fish kills and contaminate oysters. In addition, oysters and other shellfish can accumulate red tide toxins in their tissues. People who eat oysters or other shellfish containing red tide toxins become seriously ill with neurotoxic shellfish poisoning. Once a red tide appears to be over, toxins can remain in the oysters for weeks to months. The 2011 bloom started in September and lasted into 2012. Fish mortality was estimated at 4.4 million. The commercial oyster season was closed and disaster declarations issued. The total economic loss was estimated at $7.5 million (dollar year not reported).136
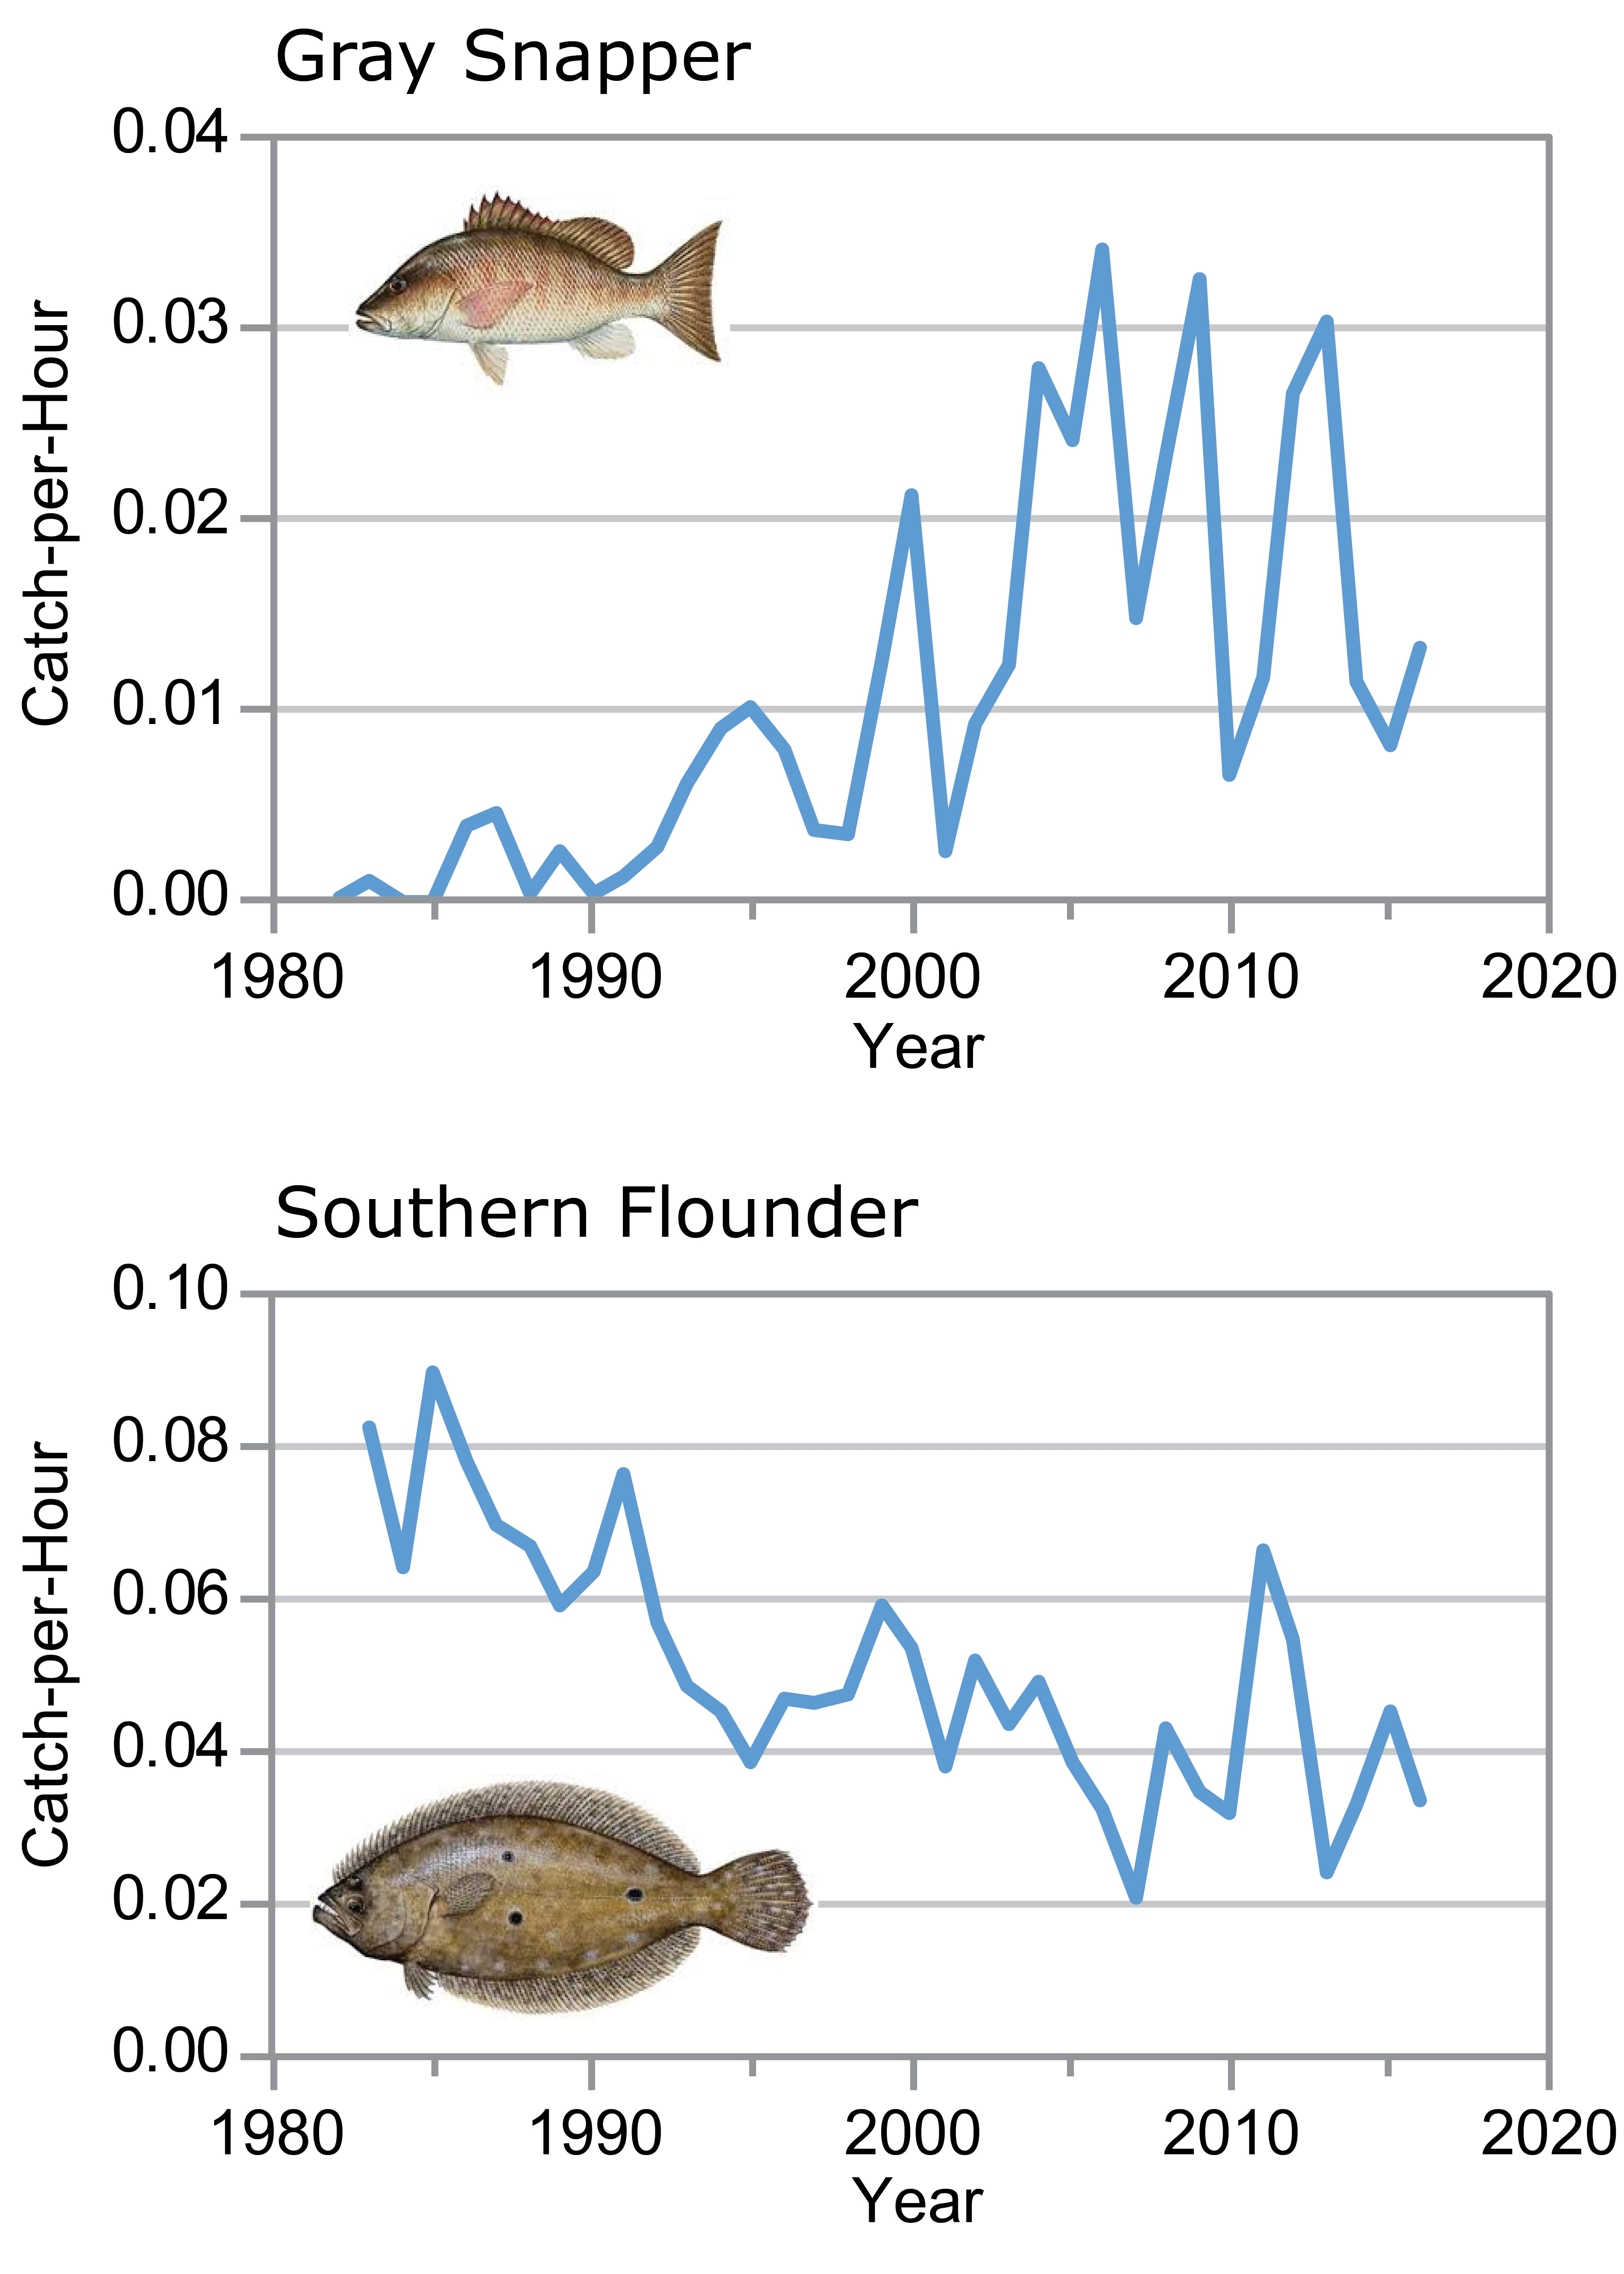
Figure 23.9: Climate Winners and Losers (Gray Snapper and Southern Flounder)
Figure 23.9: The graphs show trends in annual abundance of (top) gray snapper and (bottom) southern flounder as the number of fish caught per hour along the Gulf Coast of Texas between 1982 (snapper)/1983 (flounder) and 2016. As water temperatures increase along the Texas Gulf Coast, gray snapper are expanding northward along the Texas coast, while southern flounder, a popular sport fish, are becoming less abundant, impacting the recreational and commercial fishing industries. Source: Texas Parks and Wildlife Department.
Gray snapper have been ranging farther north since the 1990s; once found only in the lower Laguna Madre and off the extreme southern shore of Texas, they are now migrating northward along the upper Texas Coast. Conversely, flounder abundance has been declining due to the warmer winters,137,138 since sex ratios (the number of males versus females) are influenced by temperature during flounder development and increases in temperature produce increasingly male-dominated sex ratios in southern flounder from Texas (See Figure 23.9).
Existing Options for Managing Risk
The National Fish, Wildlife, and Plants Climate Adaptation Strategy123 was developed to provide natural resource managers and decision-makers the strategies and tools to address climate change impacts. The Strategy offers a guide for actions that can be taken in spite of remaining uncertainties over how climate change will impact living resources.
The Texas Edwards Aquifer Recovery Implementation Program Habitat Conservation Plan78 balances water pumping and use of the aquifer with protection of eight federally listed threatened and endangered species that depend on San Marcos Springs and Comal Springs, two of the largest springs in the southwestern United States. These springs are the headwaters of the San Marcos and Comal Rivers and provide important water flow, especially during drought, to the Guadalupe River and Estuary.
Environmental flows—instream flows and freshwater inflows to bays and estuaries—are critical for sustaining aquatic ecosystems. In 2007, the Texas Legislature passed Senate Bill 3, which established a comprehensive, statewide process to protect environmental flows.136 The process relies upon input from local stakeholder groups, composed of balanced interests ranging from agricultural water users to commercial anglers. The Texas Commission on Environmental Quality has adopted environmental flow standards intended to protect flow regimes that will help ensure healthy rivers, streams, and estuaries for Texas. The focus now is on adaptive management to refine standards, address research needs, and identify voluntary strategies to meet environmental flow standards.
The Texas Coastal Resiliency Master Plan139 promotes coastal resilience, defined as the ability of coastal resources and coastal infrastructure to withstand natural or human-induced disturbances and quickly rebound from coastal hazards. This definition encompasses the two dimensions of resilience: 1) taking actions to eliminate or reduce significant adverse impacts from natural and human-induced disturbances, and 2) responding effectively in instances when such adverse impacts cannot be avoided. To keep pace with the dynamic Texas coastline, the Plan will be updated regularly to allow the state to continually assess changing coastal conditions and needs and to determine the most suitable way to implement the appropriate coastal protection solutions.
Human Health
Health threats, including heat illness and diseases transmitted through food, water, and insects, will increase as temperature rises. Weather conditions supporting these health threats are projected to be of longer duration or occur at times of the year when these threats are not normally experienced. Extreme weather events with resultant physical injury and population displacement are also a threat. These threats are likely to increase in frequency and distribution and are likely to create significant economic burdens. Vulnerability and adaptation assessments, comprehensive response plans, seasonal health forecasts, and early warning systems can be useful adaptation strategies.
Extreme heat causes both direct and indirect impacts on human health and acts as a threat multiplier to the medically vulnerable. The increase in extreme heat due to climate change will exacerbate the medical issues associated with heat illness. More detail can be found in Chapter 14: Human Health. Notably, heat stress is strongly correlated with complications of lung disease, such as asthma and emphysema, as well as dehydration and injurious electrolyte abnormalities. It is estimated that each increase of approximately 1.8°F (1°C) in summer temperature increases the death rate for elders with chronic conditions by 2.8% to 4.0%.140 During heat waves, concrete, blacktop, and the low ventilation capacity of urban “canyons” created by tall buildings can add 7°–12°F to the urban heat load.141 The heat wave of 2011 exemplifies the human health and healthcare system impacts of extreme heat in the Southern Great Plains. The average temperature in Texas from June to August that year was 86.7°F (30.4°C), which broke all previous single-month records and was 5.2°F (2.9°C) higher than the long-term climatological average.11 Studies demonstrated a 3.6% increase in emergency room visits and a 0.6% increase in deaths, with the largest effect on the elderly.142,143 Within the Southern Great Plains, changes in extreme temperatures are projected to result in an additional 1,300 deaths per year under a higher scenario (RCP8.5) by the end of the century. Under a lower scenario (RCP4.5), more than half of these additional deaths could be avoided. Annual losses associated with extreme temperature-related mortality are estimated at $19 billion (2015 dollars) under RCP8.5 in 2090 and $9.4 billion (2015 dollars) under RCP4.5144(see the Scenario Products section of App. 3 for more on RCPs).
Rising temperatures and precipitation alter the habitats of vectors (mosquitoes, ticks, rodents, and fleas) that transmit a variety of human diseases. In the Southern Great Plains, hantavirus,145 Rocky Mountain spotted fever,146 leptospirosis,147 and West Nile virus148 are all currently endemic and could be impacted by climate change.149,150 A warmer world will create newly hospitable habitats for tropical and subtropical insect vectors and the diseases they carry. Historically disease-free areas have been protected from becoming hazardous by cold environmental temperatures. That is, with extreme low temperatures of winter, insect (in particular, mosquito) populations are decimated. However, as the global average temperature increases, mosquitoes will thrive longer and reproduce more successfully at higher latitudes and altitudes. Tropical diseases, such as dengue virus,151 chikungunya virus, and Zika virus are transmitted by Aedes mosquitoes, which are currently expanding their geographic range in the southern United States.149 In southern Texas, sporadic, locally acquired outbreaks of dengue have been reported.152 In 2005, there were 59 cases of dengue virus in southern Texas that met criteria for dengue hemorrhagic fever,153 indicating that inhabitants were exposed to multiple variations of the virus, a condition necessary for the development of severe manifestations of dengue. In 2014, locally transmitted cases of chikungunya began to be reported in Texas.154 Zika virus has also recently appeared in the region. In 2016, the Centers for Disease Control and Prevention (CDC) issued a travel warning for Cameron County, Texas, after the first case of local, person-to-person transmission of Zika was reported.155 The ecology of vector-borne diseases is complex, and the future risk for proliferation and expansion of the ranges of these diseases is possible under future climate scenarios.156,157 Along the southern Gulf Coast, stronger hurricanes will increase the likelihood of favorable ecologic niches for emerging infectious diseases that infect humans and animals.158
As water evaporates during periods of drought, the remaining water can have higher concentrations of chemicals and solid particles, lower dissolved oxygen levels, and a higher density of germs that cause infectious diseases.128 Drought conditions reduce the number of sources and overall quantity of water available to both human and animal users. Because these users are sharing a reduced supply, germ transmission and outbreaks of infectious disease become more likely. Waterborne diseases that have been linked to drought include amoebiasis, hepatitis A, salmonellosis, schistosomiasis, shigellosis, typhoid and paratyphoid fevers, infection with E. coli, cholera, and leptospirosis.159,160,161,162 Skin infections, such as scabies and impetigo, and eye infections, including conjunctivitis, are also correlated with drought due to a lack of water available for personal hygiene.163
Droughts, floods, and higher temperatures will change the balance of ecosystems, allowing invasive species such as animal pests, plant weeds, and algae blooms to proliferate and harm existing agriculture.164 Such conditions favor fungal species that can overwhelm crops and contaminate animal feedstocks. Additionally, increases in CO2 are changing the nutritional composition of food crops.165 Elevated CO2 levels have been shown to reduce the protein composition of grains, tubers, rice, wheat, and barley.166 Micronutrient contents are also affected by rising CO2 levels, with atmospheric CO2 concentrations of 550 parts per million being associated with reductions in zinc, iron, phosphorus, potassium, calcium, sulfur, magnesium, copper, and manganese across a wide range of crops.167 Additionally, extreme temperatures and aridity pose health risks to outdoor agricultural workers.168 Under a higher scenario (RCP8.5), the impact of temperature extremes at a national level are projected to result in the loss of two billion labor hours, equating to an estimated $160 billion (in 2015 dollars) in lost wages by the end of the century. The Southern Great Plains region is projected to experience higher-than-average impacts, with some communities projected to lose more than 6% in annual labor hours by the end of the century.144
State-level climate adaptation programs169 have been developed throughout the Nation. For health, these include vulnerability and adaptation assessments, comprehensive response plans,170,171 climate-proofing healthcare infrastructure, and implementing integrated surveillance of climate-sensitive infectious diseases. These efforts are outlined in more detail in Chapter 14: Human Health. Incorporating short-term to seasonal forecasts into public health activities can also provide assistance under a warming climate.172 Although there is momentum to adopt adaptation strategies in the wake of Hurricane Harvey,173 and adaptation strategies on a general scale (such as for drought) are in progress,174 large-scale adaptation efforts in the region are lacking175 and regional planners can learn from activities ongoing outside the region (Ch. 14: Human Health).
Indigenous Peoples
Tribal and Indigenous communities are particularly vulnerable to climate change due to water resource constraints, extreme weather events, higher temperature, and other likely public health issues. Efforts to build community resilience can be hindered by economic, political, and infrastructure limitations, but traditional knowledge and intertribal organizations provide opportunities to adapt to the potential challenges of climate change.
The 45 federally recognized tribes (48 if state-recognized tribal nations are included) located in the Southern Great Plains show considerable economic, social, cultural, and linguistic/language diversity.176,177,178 The 4 tribes of Kansas (59,130 people), 39 tribes of Oklahoma (482,760 people), including 1 state-recognized tribe, and 5 tribes of Texas (6,210 people), including 2 state-recognized tribes, experience the same climate change impacts as the rest of the Nation.14 However, these sovereign nations within the United States are faced with infrastructure (social and physical), economic, political, and cultural challenges, as well as unique opportunities, in their response to climate change impacts (Ch. 15: Tribes).
Climate Change Threats to Tribal Cultural Traditions and Community Resilience
No climate change impacts are as significant to the tribes and Indigenous peoples of the Southern Great Plains as those that threaten the ability to procure food, water, shelter, and preserve ancient cultural activities.179180181 Given the ancient symbiotic relationship between environment and culture that shapes tribal identities and life-way practices, climate-induced changes to the seasons, landscapes, and ecosystems pose an existential threat to tribal cultural traditions and community resilience.182,183,184 For example, climate change, including the impacts of excessive heat, drought, and the disappearance of native species, is already disrupting ceremonial cycles in Oklahoma.185 However, many climate change adaptation initiatives and strategies are being developed by tribes throughout the United States. Specific examples in the Southern Great Plains can be found in Figure 15.1 in Chapter 15: Tribes.
Physical and Organizational Infrastructure
The region’s tribes and Indigenous peoples vary greatly in size, from small nations with fewer than 1,000 enrolled members to larger nations with over 50,000 enrolled members; the largest of the tribes is the Cherokee Nation with more than 317,000 enrolled members.186 The smaller nations, given their population size and respective size of government, often struggle to exercise their sovereignty to respond to climate change due to a lack of organizational and physical infrastructure.187,188 The social organizational infrastructure needed to adapt to climate change impacts like extreme weather events, rising temperatures, shifting seasons, invasive species, air and water quality issues, and a host of health impacts is often lacking or underdeveloped in small tribal nations. Consequently, the smaller tribes depend largely on the services, grant programs, and technology transfer capabilities of the Bureau of Indian Affairs and other Federal Government departments, agencies, and bureaus to assist in their climate adaptation efforts. There are exceptions—larger and wealthier tribal nations, such as the Chickasaw Nation, Citizen Band Potawatomi, and Muscogee (Creek) Nation, can develop and shape, to a much larger extent, their own climate adaptation strategies.169
Lack of physical infrastructure, tied directly to limited economic resources and power, poses a substantial obstacle to climate change adaptation for the tribes of the region. While cities and other governmental jurisdictions make plans to build resilient physical infrastructure by using bonds, public–private partnerships, and taxes and tax instruments, only a handful of tribal nations have the ability to use these tools for climate adaptation. Most tribes and Indigenous peoples remain dependent on underfunded federal programs and grants for building and construction activities to improve the resilience of their infrastructure in the face of climate change threats. Many larger and wealthier tribes have modeled construction and design of homes and large commercial building best practices on “green” or resilient net-zero carbon footprint designs. Increasing activity in community gardens, food recovery, recycling, water conservation, land-use planning, and investment in climate-resilient community design all signal opportunities for tribal nations to leapfrog significant obstacles other city, county, and state governments face when dealing with the costs of existing physical infrastructure that often make climate change adaptation difficult and incremental.
TRACEABLE ACCOUNTS
Process Description
The initial Southern Great Plains author team was selected such that expertise from each of the states’ officially recognized climate offices in the region (Kansas, Oklahoma, and Texas) were included. The offices of the state climatologist in Kansas, Oklahoma, and Texas are each members of the American Association of State Climatologists, which is the recognized professional scientific organization for climate expertise at the state level.
One representative from each of several regional hubs of national and regional climate expertise was included on the author team. These regional hubs include the U.S. Department of Agriculture’s Southern Plains Climate Hub (El Reno, Oklahoma), the U.S. Department of the Interior’s South Central Climate Adaptation Science Center (Norman, Oklahoma), and the National Oceanic and Atmospheric Administration’s Regional Integrated Sciences and Assessments Southern Climate Impacts Planning Program (Norman, Oklahoma).
After assessing the areas of expertise of the six authors selected from the state and regional centers, a gap analysis was conducted to prioritize areas of expertise that were missing. Due to the importance of the sovereign tribal nations to the Southern Great Plains, an accomplished scholar with expertise in Indigenous knowledge on the environment and climate change was selected from the premier tribal university in the United States, Haskell Indian Nations University in Lawrence, Kansas. An individual from the Environmental Science Institute at the University of Texas at Austin was selected to bring expertise on the complex intersection of coupled atmosphere–land–ocean systems, climate, and humans (population and urbanization). Expertise in the electric utility industry was gained through the Oklahoma Association of Electric Cooperatives by an individual with a long history of working with rural and urban populations and with researchers and forecasters in weather and climate.
The author group decided to allow Southern Great Plains stakeholders to drive additional priorities. On March 2, 2017, the Fourth National Climate Assessment (NCA4) Southern Great Plains chapter team held a Regional Engagement Workshop at the National Weather Center in Norman, Oklahoma, with a satellite location in Austin, Texas, that allowed a number of stakeholders to participate virtually. The objective of the workshop was to gather input from a diverse array of stakeholders throughout the Southern Great Plains to help inform the writing and development of the report and to raise awareness of the process and timeline for NCA4. Stakeholders from meteorology, climatology, tribes, agriculture, electric utilities, water resources, Bureau of Land Management, ecosystems, landscape cooperatives, and transportation from Kansas, Oklahoma, and Texas were represented. The productive dialog at this workshop identified important gaps in environmental economics, ecosystems, and health. Scientists working at the cutting edge of research in these three areas were selected: an ecosystems expert from the Texas Parks and Wildlife Department, an environmental economist from the department of Geography and Environmental Sustainability at the University of Oklahoma, and health experts from the University of Colorado School of Medicine and the Aspen Global Change Institute.
This diverse collection of medical doctors, academics, researchers, scientists, and practitioners from both federal and state agencies gives the Southern Great Plains chapter a wealth of expertise across the many ways in which climate change will affect people in the region.
KEY MESSAGES
Key Message 1: Food, Energy, and Water Resources
Quality of life in the region will be compromised as increasing population, the migration of individuals from rural to urban locations, and a changing climate redistribute demand at the intersection of food consumption, energy production, and water resources (likely, high confidence). A growing number of adaptation strategies, improved climate services, and early warning decision support systems will more effectively manage the complex regional, national, and transnational issues associated with food, energy, and water (likely, high confidence).
Description of evidence base
The connection between food, water, and energy also creates great challenges in the management and distribution of resources. People need food, energy, and water, yet all sectors pull from each other and allocation is a challenge. There are many studies focused on the competitive nature revolving around these resources and the demand by people.41,59,60,61,62,63,64,65 The management and application of these issues are social in context and require significant communication and collaboration to resolve. As demands for these resources become more acute, development of collaborative processes to ensure integrated use and allocation may be required.
Major uncertainties
Research into the intersection of food, energy, and water is in its early stages and historically tends to examine only one or two components.59,60,61,62,63,64,65 It is clear that tradeoffs and cascading complexities exist between sectors, and changes in one sector are likely to propagate through the entire system. There are significant gaps in the scientific understanding regarding the role that climate change will play as a disruptive force and a threat to food, energy, and water security.60,63,66,67,68 It is likely, and with significant certainty, that the competition for and use of the resources by people will continue; however, the likelihood of developing a means to manage this situation is challenging. The added complexities of people and cultures, a rapidly growing population (see next section), and the diminishing availability of resources (water especially) in this region will be an important future research topic.
Description of confidence and likelihood
The Southern Great Plains will continue to grow rapidly and with high probability of significant competition. Water is the major concern, and political inability to develop a system to allocate water in an equitable manner will continue to build this competitive and contentious issue among all users—energy, food, and water. Quality of life in the region will be compromised as population increases. At least 60% of the region’s population is clustered around urban centers currently, but these population centers are experiencing growth that far exceeds that of rural communities. The remaining population is distributed across vast areas of rural land.14,30,31,32,33 Therefore, the migration of individuals from rural to urban locations, combined with climate change, redistributes demand at the intersection of food consumption, energy production, and water resources. (Likely, High confidence)
A growing number of adaptation strategies, improved climate services, and early warning decision support systems will more effectively manage the complex regional, national, and transnational issues associated with food, energy, and water. Since a changing climate has significant negative impacts on agriculture in the United States and causes substantial economic costs,38 the effects of drought and other occurrences of extreme weather outside the region will also affect the food–energy–water interconnections within the region. (Likely, High confidence)
Key Message 2: Infrastructure
The built environment is vulnerable to increasing temperature, extreme precipitation, and continued sea level rise, particularly as infrastructure ages and populations shift to urban centers (likely, high confidence). Along the Texas Gulf Coast, relative sea level rise of twice the global average will put coastal infrastructure at risk (likely, medium confidence). Regional adaptation efforts that harden or relocate critical infrastructure will reduce the risk of climate change impacts.
Description of evidence base
The existing infrastructure and projected models for growth are well established and documented. Demographic and population projections are available from state demographers and are typically included in Long-Term Transportation Plans available from state departments of transportation. Additionally, the present-day infrastructure challenges have been examined in depth by the American Society for Civil Engineers (ASCE), which publishes an Infrastructure Report Card for the Nation and for each state (www.infrastructurereportcard.org).189 For the Southern Great Plains states, one of the pressing concerns is meeting the funding challenges necessary to maintain critical infrastructure, as well as anticipating future revenue streams, which themselves depend on population and its distribution, and state and federal funding. The ASCE, as well as all state transportation plans in the Southern Great Plains, does not consider future climate projections, and the information contained generally does not explicitly mention climate-related stressors. However, the impacts of climate change have become an issue of concern for agencies such as the Department of Transportation (DOT) and Federal Highways Administration (FHWA), which have in recent years funded projects evaluating the potential impacts of climate change on infrastructure and transportation and possible adaptation strategies. Since 2010, the FHWA has sponsored a series of pilot studies in resilience for municipalities and states across the Nation.190 Two of these studies took place in Texas, in Dallas and Tarrant Counties and in the City of Austin. These reports provide some of the most comprehensive examples of integrating climate data into assessments of infrastructure vulnerability in the region to date. The potential impacts of temperature and precipitation extremes on transportation and infrastructure were based in part on known vulnerabilities as shown by these aforementioned reports and the larger repository of information and resources supplied by the FHWA.
Estimates of relative sea level rise (SLR) in Texas in the historical period are available from NCA4 Volume I: Climate Science Special Report,24 Runkle et al. (2017),25 Sweet et al. (2017).191 Relative SLR along the Texas coastline is some of the highest in the Nation; coupled with its population and critical energy infrastructure, this region has some noteworthy vulnerabilities to SLR. Projections of SLR remain uncertain and depend to some extent on whether the current rates of relative SLR are maintained, in addition to the magnitude and rate of greenhouse gas emissions. Sweet et al. (2017)191 probabilistically evaluate a number of SLR scenarios, typically noting that the Texas coast SLR is higher than the global mean. The values mentioned in the main text are global mean values obtained from USGCRP (2017)24 and from the range quoted by Runkle et al. (2017).25
Major uncertainties
In the Southern Great Plains there remains uncertainty over the direction of change of average precipitation, although models generally project increases in very heavy precipitation.1 The expectation of an increase in the frequency of events such as the 100-year storm is uncertain due to the spread of model projections of extreme precipitation and the need to use additional statistical modeling in order to obtain the return period estimates.
There are limited studies that attempt to directly link weather and climate extremes and their impacts to infrastructure. While it is appreciated that infrastructure exposed to adverse conditions will lead to deterioration, studies on specific cause–effect chain of events in these cases are limited (e.g., Winguth et al. 2015)192. The results are more evident in the case of catastrophic failures associated with floods, for example, but even in those cases, antecedent conditions related to the age, condition, and/or construction quality of infrastructure will affect its resilience (Ch. 12: Transportation;).
Description of confidence and likelihood
There is very high confidence that extreme heat will increase in frequency and intensity. There is medium confidence in an increased frequency of flooding and high confidence in the increased frequency of drought. There is high confidence of sea level rise of at least 4 feet by 2100 along the Texas coastline if greenhouse gas emissions are not reduced. On the implications for infrastructure, there is high confidence that weather-related damage will increase due to inland weather-related hazards. Along the coastline, there is very high confidence that infrastructure will be impacted by sea level rise and storm surge.
Key Message 3: Ecosystems and Ecosystem Services
Terrestrial and aquatic ecosystems are being directly and indirectly altered by climate change (likely, high confidence). Some species can adapt to extreme droughts, unprecedented floods, and wildfires from a changing climate, while others cannot, resulting in significant impacts to both services and people living in these ecosystems (likely, high confidence). Landscape-scale ecological services will increase the resilience of the most vulnerable species.
Description of evidence base
This Key Message was developed through technical discussions developed within science teams and collaborators of the Gulf Coast and Great Plains Landscape Conservation Cooperatives. Species’ response to climate change is complex and variable;119 this complexity necessitates a multifaceted review of the projected impacts of climate change. In addition, ecosystem services also require assessment, given the impact of climate change on their ability to deliver materials and processes that benefit people.123
The following relevant areas of evidence regarding climate change impacts on ecosystems in the Southern Great Plains were therefore considered: species, aquatic ecosystems, coastal bays and estuaries, and risk management. It is unclear how climate change will affect species directly, but the effects of increased aridity will likely have negative impacts (e.g., NFWPCAP 2012123). Species migration (e.g., Schmandt 2011126) and mortality (e.g., Moore et al 2016127) will increase in response to climate change. Climate change impacts to aquatic ecosystems include higher water temperatures in lakes, wetlands, rivers, and estuaries, while impacts to reservoirs include fluctuating lake levels, loss of habitat, loss of recreational access, increase in harmful algal blooms, and disconnectedness from upstream and downstream riverine habitat.129 Sea level rise will impact coastal bays and estuaries via more frequent and longer-lasting flooding of marshes,126,132 while higher tides and storm surges cause inundation of freshwater areas and beach erosion, leading to a potential decrease or loss of barrier islands and coastal habitats, including nesting habitats and submerged habitats such as seagrass beds affected by changes in water quality and changing water depths.133 Other ecosystem-centered impacts include surface and groundwater depletion (e.g., Perkin et al. 2017134) and changes in migratory species pathways.135
Major uncertainties
Ecosystems and the species that exist in these ecosystems have experienced a rapid decline in many “common species” as well as certain rare species.123,137,138 Increases in many nonnative species have led to both concern and opportunity. Continued habitat and population shifts and the impact of interactions between people, other resources, and available habitat stressors are vague. Indirect impacts to livestock and agricultural systems are also unknown. The likelihood of animal and plant diseases and parasites impacting commercial production and the interaction with wild species is anticipated but uncertain.
Description of confidence and likelihood
There is high confidence that rising temperatures and increases in flooding, runoff events, and aridity will likely lead to changes in the aquatic and terrestrial habitats supporting many regional species. Flooding has changed the complexity of many riparian habitats. Increases already seen in extreme drought occurrence have caused downturns in the fish- and wildlife-related industries, with losses in traditional fish (crab and oysters) and wildlife species (waterfowl) important for both recreational and commercial purposes.
In contrast, habitat created by invasive species due to climate change has improved populations of other species including fungi. The expanded stress due to a rapidly growing population in this region increases the likelihood (high confidence) of negative natural resource and ecosystems outcomes in the future.
Key Message 4: Human Health
Health threats, including heat illness and diseases transmitted through food, water, and insects, will increase as temperature rises (very likely, high confidence). Weather conditions supporting these health threats are projected to be of longer duration or occur at times of the year when these threats are not normally experienced (likely, medium confidence). Extreme weather events with resultant physical injury and population displacement are also a threat (likely, high confidence). These threats are likely to increase in frequency and distribution and are likely to create significant economic burdens (likely, high confidence). Vulnerability and adaptation assessments, comprehensive response plans, seasonal health forecasts, and early warning systems can be useful adaptation strategies.
Description of evidence base
This Key Message was developed in close coordination with the Human Health (Ch. 14) author team and incorporated applicable inputs from the U.S. Climate and Health Assessment.168 Multiple lines of evidence demonstrate statistically significant associations between temperature, precipitation, and other climatologic variables with adverse health outcomes, including heat-related illness, respiratory disease, malnutrition, and vector-borne disease.168 Regionally specific examples of these well-documented impacts were identified through literature reviews conducted to identify regionally specific studies of these impacts.
There is strong evidence that increasing average temperatures as well as increasing frequency, duration, and intensity of extreme heat events will occur in the Southern Great Plains by the middle and end of this century, with higher CO2 emissions leading to greater and faster temperature increases.80 Extreme temperatures are shown with high confidence to have substantial effects on morbidity and mortality 142,143,168 by causing heat-related illness and by increasing the risk of cardiovascular events, cerebrovascular events, respiratory disease, renal failure, and metabolic derangements.193,194 In addition to impacting health and well-being, extreme heat is likely to lead to a significant economic impact through an increase in healthcare costs, premature mortality, and lost labor.195 Within the Southern Great Plains, climate change is likely to exacerbate aridity due to drying of soils and increased evapotranspiration caused by higher temperatures.80 Such aridity is likely to negatively impact the agricultural sector, contributing to food insecurity and increased pesticide use.165 Extreme temperatures are projected to further impair food production in the region by significantly impacting the health and work capacity of outdoor workers.144 Additionally, shifting temperature and precipitation patterns are making habitats more suitable for disease-carrying vectors to move northward towards the Southern Great Plains region.149,150 In southern Texas, sporadic, locally acquired outbreaks of dengue, chikungunya, and Zika have been reported.152,154,155 These diseases are transmitted by the Aedes agypti mosquitoes, which are currently expanding their geographic range into the Southern Great Plains region.149,196
Climate change is expected (with medium to high confidence) to increase the frequency of extreme rainfall and hurricanes, although impacts in the Southern Great Plains remain difficult to quantify.2 The Gulf Coast of Texas in particular has experienced several record-breaking floods and tropical cyclones in recent years, including Hurricane Harvey. Hurricanes and resultant flooding result in significant health impacts, including deaths from drowning and trauma, critical shortages of essential medications, critical healthcare system power shortages, and forced patient evacuations.9 Such events strain healthcare resources not only within regions of direct hurricane impact but also within the entire region due to displacement of patient populations.8
Major uncertainties
The ability to quantitatively predict specific health outcomes associated with projected changes in climate is limited by long-term public health data as well as meteorological data. While assessments consistently indicate that climate change will have direct and indirect impacts on human health (high confidence), quantifying specific health metrics, such as incidence and community level prevalence, remains difficult. The uncertainty develops when there are many connected actions that influence health outcomes. For example, the future impact of climate change on human health is likely to be reduced by adaptation measures that take place on local and national scales. Additionally, the role of non-climate factors, including land use, socioeconomics, and population characteristics (such as immigration), as well as health sector policies and practices, will affect local and regional health impacts. The magnitude of impact of these variables on health at local and regional scales is difficult to predict. The estimation of future economic impacts is limited by difficulties in estimating the true cost of healthcare delivery and additionally only partially captures the actual impacts on health and livelihood of individuals and communities. Thus, existing projections likely underestimate the entirety of the economic impact.
Description of confidence and likelihood
There is very high confidence that rising temperatures and changes in precipitation leading to flooding, runoff events, and aridity will likely lead to negative impacts on human health in the Southern Great Plains. There is high confidence that certain populations, such as very young and old and socioeconomically disadvantaged individuals, will likely be disproportionately affected.
Key Message 5: Indigenous Peoples
Tribal and Indigenous communities are particularly vulnerable to climate change due to water resource constraints, extreme weather events, higher temperature, and other likely public health issues (likely, high confidence). Efforts to build community resilience can be hindered by economic, political, and infrastructure limitations (likely, high confidence), but traditional knowledge and intertribal organizations provide opportunities to adapt to the potential challenges of climate change.
Description of evidence base
This Key Message was developed through dialog and discussions among Indigenous communities and within the social sciences discipline. While Indigenous communities vary in size from smaller nations to large well-formed governments, all are in need of communication about the realities of climate change.14 Climate change threatens the ability of tribes and Indigenous peoples to procure food, water, and shelter and to preserve ancient cultural activities.179,180,181 The impacts of excessive heat, drought, and the disappearance of native species are already disrupting ceremonial cycles in Oklahoma.185 There is strong evidence that because of the unique nature of the Indigenous communities, including previous and ongoing experiences of the communities, the collective economic and political power for enacting efficient and effective climate adaptation responses could be limited at best.182,183,184 There is a consensus among the nations that impacts of climate change will be a direct threat to the symbiotic connection between environment and the tribal traditions connecting the people with the land.
Major uncertainties
There is a great deal of uncertainty regarding how tribal communities will integrate climate change into their cultures, given the variable size of these communities and the challenges of connecting and communicating with clarity among them. It is likely that adaptation strategies will vary greatly as knowledge and communication might not be widely supported within all nations.169,187,188 Due to disproportionate rates of poverty and access to information and collaborative support, some communities could suffer more than others; however, the degree and the impacts of such are unclear.
Description of confidence and likelihood
There is high confidence that extreme events and long-term climate shifts will lead to changes in tribal and Indigenous communities in the Southern Great Plains. Environmental connections will be direct, but the degree of those connections is uncertain and shifts in climate system will impact each nation differently. How changes will be perceived and managed and what steps are taken to adapt are uncertain; thus, there is low confidence that adaptation will be a successful mechanism among all tribal and Indigenous peoples.
REFERENCES
2014: During Drought, Once-Mighty Texas Rice Belt Fades Away. URL. ↩
Adams, R. M., B. A. McCarl, K. Segerson, C. Rosenzweig, K. J. Bryant, B. L. Dixon, R. Conner, R. E. Evenson, and D. Ojima, 1999: Ch. 2: The economic effects of climate change on U.S. agriculture. The Impact of Climate Change on the United States Economy. Mendelsohn, R., and J. Neumann, Eds., Cambridge University Press, Cambridge, UK, 18–54. doi:10.1017/cbo9780511573149.002. ↩
Adger, W. N., J. Barnett, K. Brown, N. Marshall, and K. O'Brien, 2012: Cultural dimensions of climate change impacts and adaptation. Nature Climate Change, 3, 112–117. doi:10.1038/nclimate1666. ↩
Aldunce, P., R. Beilin, J. Handmer, and M. Howden, 2016: Stakeholder participation in building resilience to disasters in a changing climate. Environmental Hazards, 15 (1), 58–73. doi:10.1080/17477891.2015.1134427. ↩
An, H., J. Gan, and S. Cho, 2015: Assessing climate change impacts on wildfire risk in the United States. Forests, 6 (9), 3197–3211. doi:10.3390/f6093197. ↩
Anderson, F., and N. Al-Thani, 2016: Effect of sea level rise and groundwater withdrawal on seawater intrusion in the Gulf Coast aquifer: Implications for agriculture. Journal of Geoscience and Environment Protection, 4, 116–124. doi:10.4236/gep.2016.44015. ↩
Anderson, H., C. Brown, L. L. Cameron, M. Christenson, K. C. Conlon, S. Dorevitch, J. Dumas, M. Eidson, A. Ferguson, E. Grossman, A. Hanson, J. J. Hess, B. Hoppe, J. Horton, M. Jagger, S. Krueger, T. W. Largo, G. M. Losurdo, S. R. Mack, C. Moran, C. Mutnansky, K. Raab, S. Saha, P. J. Schramm, A. Shipp-Hilts, S. J. Smith, M. Thelen, L. Thie, and R. Walker, 2017: Climate and Health Intervention Assessment: Evidence on Public Health Interventions to Prevent the Negative Health Effects of Climate Change. Climate and Health Technical Report Series. Centers for Disease Control and Prevention, Climate and Health Program, Atlanta, GA, 92 pp. URL. ↩
ASCE, 2013: 2013 Report Card for Kansas' Infrastructure. American Society of Civil Engineers (ASCE), Washington, DC. URL. ↩
ASCE, 2013: 2013 Report for Oklahoma's Infrastructure. American Society of Civil Engineers (ASCE), Washington, DC. URL. ↩
ASCE, 2017: 2017 Infrastructure Report Card. American Society of Civil Engineers (ASCE), Reston, VA. URL. ↩
ASCE, 2017: Report Card for Texas' Infrastructure 2017 . American Society of Civil Engineers (ASCE), Washington, DC. URL. ↩
Astor, M., 2017: “'Flesh eating bacteria' from Harvey's floodwaters kill a woman.” New York Times, Sept. 28, 2017 URL. ↩
Banner, J. L., C. S. Jackson, Z.-L. Yang, K. Hayhoe, C. Woodhouse, L. Gulden, K. Jacobs, G. North, R. Leung, W. Washington, X. Jiang, and R. Castell, 2010: Climate change impacts on Texas water: A white paper assessment of the past, present and future and recommendations for action. Texas Water Journal, 1 (1), 1–19. URL. ↩
Barker, S., 2012: 2012 Demographic State of the State Report: Oklahoma State and County Population Projections Through 2075. Oklahoma Department of Commerce, Oklahoma City, 184 pp. URL. ↩
Basu, R., D. Pearson, B. Malig, R. Broadwin, and R. Green, 2012: The effect of high ambient temperature on emergency room visits. Epidemiology, 23 (6), 813–820. doi:10.1097/EDE.0b013e31826b7f97. ↩
Bazilian, M., H. Rogner, M. Howells, S. Hermann, D. Arent, D. Gielen, P. Steduto, A. Mueller, P. Komor, R. S. J. Tol, and K. K. Yumkella, 2011: Considering the energy, water and food nexus: Towards an integrated modelling approach. Energy Policy, 39 (12), 7896–7906. doi:10.1016/j.enpol.2011.09.039. ↩
Beard, C. B., R. J. Eisen, C. M. Barker, J. F. Garofalo, M. Hahn, M. Hayden, A. J. Monaghan, N. H. Ogden, and P. J. Schramm, 2016: Ch. 5: Vector-borne diseases . The Impacts of Climate Change on Human Health in the United States: A Scientific Assessment., U.S. Global Change Research Program, Washington, DC, 129–156. doi:10.7930/J0765C7V. ↩
Beck, M. B., and R. Villarroel Walker, 2013: On water security, sustainability, and the water-food-energy-climate nexus. Frontiers of Environmental Science & Engineering, 7 (5), 626–639. doi:10.1007/s11783-013-0548-6. ↩
Berardy, A., and M. V. Chester, 2017: Climate change vulnerability in the food, energy, and water nexus: Concerns for agricultural production in Arizona and its urban export supply. Environmental Research Letters, 12 (3), 035004. doi:10.1088/1748-9326/aa5e6d. ↩
Bierbaum, R., J. B. Smith, A. Lee, M. Blair, L. Carter, F. S. Chapin, P. Fleming, S. Ruffo, M. Stults, S. McNeeley, E. Wasley, and L. Verduzco, 2013: A comprehensive review of climate adaptation in the United States: More than before, but less than needed. Mitigation and Adaptation Strategies for Global Change, 18 (3), 361–406. doi:10.1007/s11027-012-9423-1. ↩
Bradbury, J., M. Allen, and R. Dell, 2015: Climate Change and Energy Infrastructure Exposure to Storm Surge and Sea-Level Rise. U.S. Department of Energy, Washington, DC, 18 pp. URL. ↩
Bradley, M., R. Shakespeare, A. Ruwende, M. E. J. Woolhouse, E. Mason, and A. Munatsi, 1996: Epidemiological features of epidemic cholera (El Tor) in Zimbabwe. Transactions of The Royal Society of Tropical Medicine and Hygiene, 90 (4), 378–382. doi:10.1016/S0035-9203(96)90512-X. ↩
Brimelow, J. C., W. R. Burrows, and J. M. Hanesiak, 2017: The changing hail threat over North America in response to anthropogenic climate change. Nature Climate Change, 7, 516–522. doi:10.1038/nclimate3321. ↩
Brooks, H. E., 2013: Severe thunderstorms and climate change. Atmospheric Research, 123, 129–138. doi:10.1016/j.atmosres.2012.04.002. ↩
Brown, P. J., and A. T. DeGaetano, 2013: Trends in U.S. surface humidity, 1930–2010. Journal of Applied Meteorology and Climatology, 52 (1), 147–163. doi:10.1175/jamc-d-12-035.1. ↩
Butcher, J. A., B. A. Collier, N. J. Silvy, J. A. Roberson, C. D. Mason, and M. J. Peterson, 2014: Spatial and temporal patterns of range expansion of white-winged doves in the USA from 1979 to 2007. Journal of Biogeography, 41 (10), 1947–1956. doi:10.1111/jbi.12344. ↩
Butterworth, M. K., C. W. Morin, and A. C. Comrie, 2017: An analysis of the potential impact of climate change on dengue transmission in the southeastern United States. Environmental Health Perspectives, 125, 579–585. doi:10.1289/EHP218. ↩
Carlson, C., G. Goldman, and K. Dahl, 2016: Stormy seas, rising risks: Assessing undisclosed risk from sea level rise and storm surge at coastal US oil refineries. Communicating Climate-Change and Natural Hazard Risk and Cultivating Resilience: Case Studies for a Multi-disciplinary Approach. Drake, J. L., Y. Y. Kontar, J. C. Eichelberger, T. S. Rupp, and K. M. Taylor, Eds., Springer International Publishing, Cham, 295–308. doi:10.1007/978-3-319-20161-0_19. ↩
Castle, S. L., B. F. Thomas, J. T. Reager, M. Rodell, S. C. Swenson, and J. S. Famiglietti, 2014: Groundwater depletion during drought threatens future water security of the Colorado River Basin. Geophysical Research Letters, 41 (16), 5904–5911. doi:10.1002/2014GL061055. ↩
CCSP, 2008: The Effects of Climate Change on Agriculture, Land Resources, Water Resources, and Biodiversity. A Report by the U.S. Climate Change Science Program and the Subcommittee on Global Change Research. Backlund, P., A. Janetos, D. Schimel, J. Hatfield, K. Boote, P. Fay, L. Hahn, C. Izaurralde, B. A. Kimball, T. Mader, J. Morgan, D. Ort, W. Polley, A. Thomson, D. Wolfe, M. Ryan, S. Archer, R. Birdsey, C. Dahm, L. Heath, J. Hicke, D. Hollinger, T. Huxman, G. Okin, R. Oren, J. Randerson, W. Schlesinger, D. Lettenmaier, D. Major, L. Poff, S. Running, L. Hansen, D. Inouye, B. P. Kelly, L. Meyerson, b. Peterson, and R. Shaw, Eds. U.S. Environmental Protection Agency, Washington, D.C., 362 pp. URL. ↩
CDC, 2017: Advice for People Living in or Traveling to Brownsville, Texas. U.S. Centers for Disease Control and Prevention, Atlanta, GA. URL. ↩
CDC, 2017: Chikungunya Virus in the United States. U.S. Centers for Disease Control and Prevention, Atlanta, GA. URL. ↩
CDC, 2017: Hantavirus Disease, by State of Reporting. U.S. Centers for Disease Control and Prevention (CDC), Atlanta, GA. URL. ↩
CDC, 2017: Leptospirosis: Risk of Exposure. U.S. Centers for Disease Control and Prevention, Atlanta, GA. URL. ↩
CDC, 2017: Rocky Mountain Spotted Fever: Statistics and Epidemiology. U.S. Centers for Disease Control and Prevention, Atlanta, GA. URL. ↩
CDC, 2017: West Nile Virus: Final Cumulative Maps & Data for 1999-2016. U.S. Centers for Disease Control and Prevention, Atlanta, GA. URL. ↩
Cherokee Nation, 2018: About the Nation [web site]. W.W. Keeler Complex near Tahlequah, OK. URL. ↩
Chief Gordon Yellowman, 2017: Email exchange between Gordon Yellowman, Cheyenne and Arapaho Tribes in Oklahoma, and Daniel Wildcat, Haskell Indian Nations University. ↩
Chief, K., J. J. Daigle, K. Lynn, and K. P. Whyte, 2014: Indigenous experiences in the U.S. with climate change and environmental stewardship in the Anthropocene. In Forest Conservation and Management in the Anthropocene : Conference Proceedings, 161–176. URL. ↩
Chien, L.-C., Y. Guo, and K. Zhang, 2016: Spatiotemporal analysis of heat and heat wave effects on elderly mortality in Texas, 2006–2011. Science of The Total Environment, 562, 845–851. doi:10.1016/j.scitotenv.2016.04.042. ↩
Christian, J., K. Christian, and J. B. Basara, 2015: Drought and pluvial dipole events within the Great Plains of the United States. Journal of Applied Meteorology and Climatology, 54 (9), 1886–1898. doi:10.1175/jamc-d-15-0002.1. ↩
Chupka, M. W., R. Earle, P. Fox-Penner, and R. Hledik, 2008: Transforming America's Power Industry: The Investment Challenge 2010-2030. The Edison Foundation, Washington, DC, 48 pp. URL. ↩
Combs, S., 2012: The Impact of the 2011 Drought and Beyond. Publications# 96-1704. Texas Comptroller of Public Accounts, Austin, TX, 13 pp. URL. ↩
Cook, B. I., T. R. Ault, and J. E. Smerdon, 2015: Unprecedented 21st century drought risk in the American Southwest and Central Plains. Science Advances, 1 (1), e1400082. doi:10.1126/sciadv.1400082. ↩
Deloria, V., Jr, and D. Wildcat, 2001: Power and Place: Indian Education in America. Fulcrum Publishing, Golden, CO, 176 pp. ↩
Deschênes, O., and M. Greenstone, 2007: The economic impacts of climate change: Evidence from agricultural output and random fluctuations in weather. American Economic Review, 97 (1), 354–385. doi:10.1257/aer.97.1.354. ↩
Dinan, T., 2017: Projected increases in hurricane damage in the United States: The role of climate change and coastal development. Ecological Economics, 138, 186–198. doi:10.1016/j.ecolecon.2017.03.034. ↩
Easterling, D. R., J. R. Arnold, T. Knutson, K. E. Kunkel, A. N. LeGrande, L. R. Leung, R. S. Vose, D. E. Waliser, and M. F. Wehner, 2017: Precipitation Change in the United States. Climate Science Special Report: Fourth National Climate Assessment, Volume I. Wuebbles, D. J., D. W. Fahey, K. A. Hibbard, D. J. Dokken, B. C. Stewart, and T. K. Maycock, Eds., U.S. Global Change Research Program, Washington, DC, USA, 207–230. doi:10.7930/J0H993CC. ↩
Ebi, K. L., and J. Nealon, 2016: Dengue in a changing climate. Environmental Research, 151, 115–123. doi:10.1016/j.envres.2016.07.026. ↩
Edwards Aquifer Authority, The Edwards Aquifer Region. 8 pp. URL. ↩
Effler, E., M. Isaäcson, L. Arntzen, R. Heenan, P. Canter, T. Barrett, L. Lee, C. Mambo, W. Levine, A. Zaidi, and P. M. Griffin, 2001: Factors contributing to the emergence of Escherichia coli O157 in Africa. Emerging Infectious Diseases, 7 (5), 812–819. doi:10.3201/eid0705.017507. ↩
EIA, 2017: Electric Power Monthly: Table 1.1. Net Generation by Energy Source: Total (All Sectors), 2008-April 2018. U.S. Energy Information Administration (EIA), Washington, DC. URL. ↩
EPA, 2015: Climate Change in the United States: Benefits of Global Action. Health. EPA 430-R-15-001, section 3. U.S. Environmental Protection Agency (EPA), Office of Atmospheric Programs, Washington, DC, 10 pp. URL. ↩
EPA, 2017: Multi-model Framework for Quantitative Sectoral Impacts Analysis: A Technical Report for the Fourth National Climate Assessment. EPA 430‐R‐17‐001. U.S. Environmental Protection Agency (EPA), Washington, DC, 271 pp. URL. ↩
Erdman, J., 2016: “18 Major Flood Events Have Hit Texas, Louisiana, Oklahoma, Arkansas Since March 2015.” The Weather Channel, August 16 URL. ↩
Erickson, R. A., K. Hayhoe, S. M. Presley, L. J. S. Allen, K. R. Long, and S. B. Cox, 2012: Potential impacts of climate change on the ecology of dengue and its mosquito vector the Asian tiger mosquito (Aedes albopictus). Environmental Research Letters, 7 (3) doi:10.1088/1748-9326/7/3/034003. ↩
Estrada, F., W. J. W. Botzen, and R. S. J. Tol, 2017: A global economic assessment of city policies to reduce climate change impacts. Nature Climate Change, 7 (6), 403–406. doi:10.1038/nclimate3301. ↩
FHA, 2016: [Highway Statistics] Functional System Length—2016: Miles by Ownership—Rural. Federal Highway Administration, Office of Highway Policy Information, Washington, DC, 5 pp. URL. ↩
FHWA, 2018: FHWA Sustainability: Resilience [web site]. Federal Highway Administration (FHWA), Washington, DC, accessed April 13. URL. ↩
Fink, S., and A. Blinder, 2017: “Houston's hospitals treat storm victims and become victims themselves.” New York Times, Aug. 28, 2017 URL. ↩
Gaffen, D. J., and R. J. Ross, 1998: Increased summertime heat stress in the US. Nature, 396, 529–530. doi:10.1038/25030. ↩
Garfin, G., A. Jardine, R. Merideth, M. Black, and S. LeRoy, Eds., 2013: Assessment of Climate Change in the Southwest United States: A Report Prepared for the National Climate Assessment. Island press, Washington, D.C., 528 pp. URL. ↩
Garfin, G., S. LeRoy, M. Shafer, M. Muth, V. Murphy, I. Palomo, M. Ibarra, I. Ledesma, A. Chable, R. Pascual, M. Lopez, J. Martinez, D. R. Rangel, and J. S. Colin, 2018: Rio Grande/Bravo Impactos Climáticos y Perspectivas. CLIMAS, Tucson, AZ, 6 pp. URL. ↩
Garfin, G., S. LeRoy, M. Shafer, M. Muth, V. Murphy, I. Palomo, M. Ibarra, I. Ledesma, A. Chable, R. Pascual, M. Lopez, J. Martinez, D. R. Rangel, and J. S. Colin, 2018: Rio Grande/Bravo: Climate Impacts and Outlook. CLIMAS, Tucson, AZ, 6 pp. URL. ↩
Garrick, D. E., E. Schlager, and S. Villamayor-Tomas, 2016: Governing an international transboundary river: Opportunism, safeguards, and drought adaptation in the Rio Grande. Publius: The Journal of Federalism, 46 (2), 170–198. doi:10.1093/publius/pjw002. ↩
Gelca, R., K. Hayhoe, I. Scott‐Fleming, C. Crow, D. Dawson, and R. Patiño, 2016: Climate–water quality relationships in Texas reservoirs. Hydrological Processes, 30 (1), 12–29. doi:10.1002/hyp.10545. ↩
Getschow, G., and N. Husinger, 2015: “The dam called Trouble.” The Dallas Morning NewsURL. ↩
Giupponi, C., and A. K. Gain, 2017: Integrated spatial assessment of the water, energy and food dimensions of the Sustainable Development Goals. Regional Environmental Change, 17 (7), 1881–1893. doi:10.1007/s10113-016-0998-z. ↩
Godfray, H. C. J., J. R. Beddington, I. R. Crute, L. Haddad, D. Lawrence, J. F. Muir, J. Pretty, S. Robinson, S. M. Thomas, and C. Toulmin, 2010: Food security: The challenge of feeding 9 billion people. Science, 327 (5967), 812–818. doi:10.1126/science.1185383. ↩
Green, T. R., M. Taniguchi, H. Kooi, J. J. Gurdak, D. M. Allen, K. M. Hiscock, H. Treidel, and A. Aureli, 2011: Beneath the surface of global change: Impacts of climate change on groundwater. Journal of Hydrology, 405 (3), 532–560. doi:10.1016/j.jhydrol.2011.05.002. ↩
Grisham, B. A., C. W. Boal, D. A. Haukos, D. M. Davis, K. K. Boydston, C. Dixon, and W. R. Heck, 2013: The predicted influence of climate change on lesser prairie-chicken reproductive parameters. PLOS ONE, 8 (7), e68225. doi:10.1371/journal.pone.0068225. ↩
Gubler, D. J., J. Ramirez, and R. Burton, 2007: Dengue hemorrhagic fever—U.S.-Mexico border, 2005. MMWR: Morbidity and Mortality Weekly Report, 56 (31), 785–789. URL. ↩
Gubler, D. J., P. Reiter, K. L. Ebi, W. Yap, R. Nasci, and J. A. Patz, 2001: Climate variability and change in the United States: Potential impacts on vector- and rodent-borne diseases. Environmental Health Perspectives, 109 (Supplement 2), 223–233. doi:10.2307/3435012. ↩
Harlan, S. L., A. J. Brazel, L. Prashad, W. L. Stefanov, and L. Larsen, 2006: Neighborhood microclimates and vulnerability to heat stress. Social Science & Medicine, 63 (11), 2847–2863. doi:10.1016/j.socscimed.2006.07.030. ↩
Hawkes, L., 2016: Texas Rice Belt flooded by heavy rains. Southwest FarmPress. FarmProgress/Informa. URL. ↩
Hayden, M., 2011: The Changing Face of Kansas [Wheat State Whirlwind Tour presentation]. Kansas Department of Wildlife, Parks and Tourism, Topeka, KS, 31 pp. URL. ↩
Hellegers, P., D. Zilberman, P. Steduto, and P. McCornick, 2008: Interactions between water, energy, food and environment: Evolving perspectives and policy issues. Water Policy, 10 (S1), 1–10. doi:10.2166/wp.2008.048. ↩
Hibbard, K. A., F. M. Hoffman, D. Huntzinger, and T. O. West, 2017: Changes in Land Cover and Terrestrial Biogeochemistry. Climate Science Special Report: Fourth National Climate Assessment, Volume I. Wuebbles, D. J., D. W. Fahey, K. A. Hibbard, D. J. Dokken, B. C. Stewart, and T. K. Maycock, Eds., U.S. Global Change Research Program, Washington, DC, USA, 277–302. doi:10.7930/J0416V6X. ↩
Hoerling, M., M. Chen, R. Dole, J. Eischeid, A. Kumar, J. W. Nielsen-Gammon, P. Pegion, J. Perlwitz, X.-W. Quan, and T. Zhang, 2013: Anatomy of an extreme event. Journal of Climate, 26 (9), 2811–2832. doi:10.1175/JCLI-D-12-00270.1. ↩
Hoxie, F. E., and P. Iverson, Eds., 2014: Indians in American History: An Introduction. Wiley, Hoboken, NJ, 320 pp. ↩
Hsiang, S., R. Kopp, A. Jina, J. Rising, M. Delgado, S. Mohan, D. J. Rasmussen, R. Muir-Wood, P. Wilson, M. Oppenheimer, K. Larsen, and T. Houser, 2017: Estimating economic damage from climate change in the United States. Science, 356 (6345), 1362–1369. doi:10.1126/science.aal4369. ↩
Hurd, G. M., Ed., 2016: Kansas Statistical Abstract 2015. Lawrence, KS, 590 pp. URL. ↩
Hussey, K., and J. Pittock, 2012: The energy–water nexus: Managing the links between energy and water for a sustainable future. Ecology and Society, 17 (1), 31. doi:10.5751/ES-04641-170131. ↩
Johnson, C., 2014: “Drought costs residents thousands.” The Colorado County [TX] Citizen, October 29 URL. ↩
Kaplan, S., and J. Healy, 2017: “Houston's Floodwaters are tainted, testing shows.” New York Times, Sept. 11, 2017 URL. ↩
Kinniburgh, F., M. G. Simonton, and C. Allouch, 2015: Come heat and high water: Climate risk in the Southeastern U.S. and Texas. Risky Business Project, New York, 109 pp. URL. ↩
Klempa, B., 2009: Hantaviruses and climate change. Clinical Microbiology and Infection, 15 (6), 518–523. doi:10.1111/j.1469-0691.2009.02848.x. ↩
Kløve, B., P. Ala-Aho, G. Bertrand, J. J. Gurdak, H. Kupfersberger, J. Kværner, T. Muotka, H. Mykrä, E. Preda, P. Rossi, C. B. Uvo, E. Velasco, and M. Pulido-Velazquez, 2014: Climate change impacts on groundwater and dependent ecosystems. Journal of Hydrology, 518 (Part B), 250–266. doi:10.1016/j.jhydrol.2013.06.037. ↩
Knowlton, K., M. Rotkin-Ellman, G. King, H. G. Margolis, D. Smith, G. Solomon, R. Trent, and P. English, 2009: The 2006 California heat wave: Impacts on hospitalizations and emergency department visits. Environmental Health Perspectives, 117 (1), 61–67. doi:10.1289/ehp.11594. ↩
Kossin, J. P., T. Hall, T. Knutson, K. E. Kunkel, R. J. Trapp, D. E. Waliser, and M. F. Wehner, 2017: Extreme Storms. Climate Science Special Report: Fourth National Climate Assessment, Volume I. Wuebbles, D. J., D. W. Fahey, K. A. Hibbard, D. J. Dokken, B. C. Stewart, and T. K. Maycock, Eds., U.S. Global Change Research Program, Washington, DC, USA, 257–276. doi:10.7930/J07S7KXX. ↩
Kronk Warner, E. A., 2014: Examining tribal environmental law. Columbia Journal of Environmental Law, 36 (1), 42–104. URL. ↩
Kunkel, K. E., L. E. Stevens, S. E. Stevens, L. Sun, E. Janssen, D. Wuebbles, M. C. Kruk, D. P. Thomas, M. D. Shulski, N. Umphlett, K. G. Hubbard, K. Robbins, L. Romolo, A. Akyuz, T. Pathak, T. R. Bergantino, and J. G. Dobson, 2013: Regional Climate Trends and Scenarios for the U.S. National Climate Assessment: Part 4. Climate of the U.S. Great Plains. NOAA Technical Report NESDIS 142-4. National Oceanic and Atmospheric Administration, National Environmental Satellite, Data, and Information Service, Washington, D.C., 91 pp. URL. ↩
Kuntz, J., and R. Murray, 2009: Predictability of swimming prohibitions by observational parameters: A proactive public health policy, Stamford, Connecticut, 1989-2004. Journal of Environmental Health, 72 (1), 17–23. URL. ↩
KWO, 2015: 2014 Kansas Water Plan. Kansas Water Office (KWO), Topeka, KS, various pp. URL. ↩
Loeffler, C., 2015: A brief history of environmental flows in Texas. In World Environmental and Water Resources Congress 2015: Floods, Droughts, and Ecosystems, May 17–21, 2015, Austin, TX., 2350–2359. doi:10.1061/9780784479162.231. ↩
Loladze, I., 2014: Hidden shift of the ionome of plants exposed to elevated CO2 depletes minerals at the base of human nutrition. eLife, 3, e02245. doi:10.7554/eLife.02245. ↩
Mace, R. E., S. C. Davidson, E. S. Angle, and W. F. Mullican III, Eds., 2006: Aquifers of the Gulf Coast of Texas. Texas Water Development Board Report 365. Austin, TX, 304 pp. URL. ↩
Mahler, B. J., A. J. Long, J. F. Stamm, M. Poteet, and A. Symstad, 2013: Linking climate change and karst hydrology to evaluate species vulnerability: The Edwards and Madison aquifers. In American Geophysical Union, Fall Meeting 2013, San Francisco, CA., #H11I-1257. URL. ↩
Mahler, B. J., and R. Bourgeais, 2013: Dissolved oxygen fluctuations in karst spring flow and implications for endemic species: Barton Springs, Edwards aquifer, Texas, USA. Journal of Hydrology, 505, 291–298. doi:10.1016/j.jhydrol.2013.10.004. ↩
Maldonado, J. K., R. E. Pandya, and B. J. Colombi, Eds., 2014: Climate Change and Indigenous Peoples in the United States: Impacts, Experiences and Actions. Springer, Cham, Switzerland, 174 pp. doi:10.1007/978-3-319-05265-6. ↩
McDonald, L., K. Adachi, T. Rintz, G. Gardner, and F. Hornsby, 2014: Range‐wide population size of the lesser prairie‐chicken: 2012, 2013, and 2014. WEST Inc., Laramie, WY, 21 pp. URL. ↩
McManus, G., 2015: Historic May rains eliminate drought. The OCS Mesonet Ticker. Oklahoma Climatological Survey. URL. ↩
McNeeley, S. M., 2017: Sustainable climate change adaptation in Indian Country. Weather, Climate, and Society, 9 (3), 393–404. doi:10.1175/wcas-d-16-0121.1. ↩
Mendelsohn, R., and J. Neumann, Eds., 2004: The Impact of Climate Change on the United States Economy. Cambridge University Press, New York, NY,. ↩
Montalvo, A. J., C. K. Faulk, and G. J. Holt, 2012: Sex determination in southern flounder, Paralichthys lethostigma, from the Texas Gulf Coast. Journal of Experimental Marine Biology and Ecology, 432–433 (Supplement C), 186–190. doi:10.1016/j.jembe.2012.07.017. ↩
Mooney, R. F., and J. W. McClelland, 2012: Watershed export events and ecosystem responses in the Mission–Aransas National Estuarine Research Reserve, South Texas. Estuaries and Coasts, 35 (6), 1468–1485. doi:10.1007/s12237-012-9537-4. ↩
Moore, G. W., C. B. Edgar, J. G. Vogel, R. A. Washington-Allen, R. G. March, and R. Zehnder, 2016: Tree mortality from an exceptional drought spanning mesic to semiarid ecoregions. Ecological Applications, 26 (2), 602–611. doi:10.1890/15-0330. ↩
Murdock, M., and J. Brenner, 2016: Texas Coastal Bend Regional Climate Change Vulnerability Assessment. The Nature Conservancy, Arlington, VA, 38 pp. URL. ↩
Muth, M., K. Anderson, D. Brown, T. Brown, E. Delgado, G. Garfin, T. Hadwen, V. Murphy, R. P. Ramírez, B. Pugh, J. H. R. Gutiérrez, R. Heim, B. Rippey, and M. Svoboda, 2017: Advancing preparedness and response to drought and wildfires through North American Transboundary Collaboration. Bulletin of the American Meteorological Society, 98 (3), ES57-ES60. doi:10.1175/bams-d-16-0296.1. ↩
Myers, S. S., A. Zanobetti, I. Kloog, P. Huybers, A. D. B. Leakey, A. J. Bloom, E. Carlisle, L. H. Dietterich, G. Fitzgerald, T. Hasegawa, N. M. Holbrook, R. L. Nelson, M. J. Ottman, V. Raboy, H. Sakai, K. A. Sartor, J. Schwartz, S. Seneweera, M. Tausz, and Y. Usui, 2014: Increasing CO2 threatens human nutrition. Nature, 510 (7503), 139–142. doi:10.1038/nature13179. ↩
Myers, S. S., M. R. Smith, S. Guth, C. D. Golden, B. Vaitla, N. D. Mueller, A. D. Dangour, and P. Huybers, 2017: Climate change and global food systems: Potential impacts on food security and undernutrition. Annual Review of Public Health, 38 (1), 259–277. doi:10.1146/annurev-publhealth-031816-044356. ↩
Narayan, S., M. W. Beck, P. Wilson, C. J. Thomas, A. Guerrero, C. C. Shepard, B. G. Reguero, G. Franco, J. C. Ingram, and D. Trespalacios, 2017: The value of coastal wetlands for flood damage reduction in the northeastern USA. Scientific Reports, 7 (1), 9463. doi:10.1038/s41598-017-09269-z. ↩
National Academies of Sciences Engineering and Medicine, 2017: Review of the Edwards Aquifer Habitat Conservation Plan: Report 2. The National Academies Press, Washington, DC, doi:10.17226/23685. ↩
National Fish Wildlife and Plants Climate Adaptation Partnership, 2012: National Fish, Wildlife and Plants Climate Adaptation Strategy. Association of Fish and Wildlife Agencies, Council on Environmental Quality, Great Lakes Indian Fish and Wildlife Commission, National Oceanic and Atmospheric Administration, and U.S. Fish and Wildlife Service., Washington, D.C., 120 pp. URL. ↩
National Research Council, 2009: Observing Weather and Climate from the Ground Up: A Nationwide Network of Networks. The National Academies Press, Washington, DC, doi:10.17226/12540. ↩
Nava, L., C. Brown, K. Demeter, F. Lasserre, M. Milanés-Murcia, S. Mumme, and S. Sandoval-Solis, 2016: Existing opportunities to adapt the Rio Grande/Bravo Basin water resources allocation framework. Water, 8 (7), 291. doi:10.3390/w8070291. ↩
NCAI, 2018: Policy Issues: Land & Natural Resources. Climate Change [web page]. National Congress of American Indians, Washington, DC. URL. ↩
Newkirk II, V. R., 2017: "Hurricane Harvey's public-health nightmare". The Atlantic. URL. ↩
NOAA NCEI, 2018: Billion-Dollar Weather and Climate Disasters [web page]. NOAA National Centers for Environmental Information, Asheville, NC. URL. ↩
Oklahoma Department of Transportation, 2015: Record flooding wreaks road havoc . ODOT: Flooding 2015. URL. ↩
Oklahoma NSF EPSCoR, Native American Water and Food Security Research. In 2016 Tribal College Conference Series on Climate Change, April 8 URL. ↩
Omernik, J. M., 1987: Ecoregions of the conterminous United States. Annals of the Association of American Geographers, 77 (1), 118–125. doi:10.1111/j.1467-8306.1987.tb00149.x. ↩
OWRB, 2012: The Oklahoma Comprehensive Water Plan. University of Oklahoma Printing Services, Oklahoma Water Resources Board, Oklahoma City, URL. ↩
Paine, J. G., T. L. Caudle, and J. R. Andrews, 2014: Shoreline Movement along the Texas Gulf Coast, 1930's to 2012. Bureau of Economic Geology, University of Texas, Austin, TX, 52 pp. URL. ↩
Paine, J. G., T. L. Caudle, and J. R. Andrews, 2017: Shoreline and sand storage dynamics from annual airborne LIDAR surveys, Texas Gulf Coast. Journal of Coastal Research, 487–506. doi:10.2112/jcoastres-d-15-00241.1. ↩
Perkin, J. S., K. B. Gido, J. A. Falke, K. D. Fausch, H. Crockett, E. R. Johnson, and J. Sanderson, 2017: Groundwater declines are linked to changes in Great Plains stream fish assemblages. Proceedings of the National Academy of Sciences of the United States of America, 114 (28), 7373–7378. doi:10.1073/pnas.1618936114. ↩
Petkova, E., K. Ebi, D. Culp, and I. Redlener, 2015: Climate change and health on the U.S. Gulf Coast: Public health adaptation is needed to address future risks. International Journal of Environmental Research and Public Health, 12 (8), 9342–9356. doi:10.3390/ijerph120809342. ↩
Pimentel, D., 1993: Climate changes and food supply. Forum for Applied Research and Public Policy, 8 (4), 54–60. URL. ↩
Post Staff, 2017: “Report: More than 650K acres burned across Kansas.” Hutch Post [KS], March 8 URL. ↩
Potter, L. B., and N. Hoque, 2014: Texas Population Projections, 2010 to 2050. Texas Office of the State Demographer, Austin, TX, 5 pp. URL. ↩
Powell, G. L., J. Matsumoto, and D. A. Brock, 2002: Methods for determining minimum freshwater inflow needs of Texas bays and estuaries. Estuaries, 25 (6), 1262–1274. doi:10.1007/bf02692223. ↩
RECON Environmental Inc., Hicks & Company, ZARA Environmental LLC, and BIO-WEST, 2012: Habitat Conservation Plan. Edwards Aquifer Recovery Implementation Program, San Antonio, TX, various pp. URL. ↩
Ringler, C., A. Bhaduri, and R. Lawford, 2013: The nexus across water, energy, land and food (WELF): Potential for improved resource use efficiency? Current Opinion in Environmental Sustainability, 5 (6), 617–624. doi:10.1016/j.cosust.2013.11.002. ↩
Ross, B. E., D. Haukos, C. Hagen, and J. Pitman, 2016: The relative contribution of climate to changes in lesser prairie‐chicken abundance. Ecosphere, 7 (6), e01323. doi:10.1002/ecs2.1323. ↩
Rudolph, L., S. Gould, and J. Berko, 2015: Climate change, health, and equity: Opportunities for action. Public Health Institute, Oakland, CA, 56 pp. URL. ↩
Runkle, J., K. E. Kunkel, J. Nielson-Gammon, R. Frankson, S. Champion, B. C. Stewart, L. Romolo, and W. Sweet, 2017: State Climate Summaries: Texas. NOAA Technical Report NESDIS 149-TX. NOAA National Centers for Environmental Information, Asheville, NC, 5 pp. URL. ↩
Sailor, D. J., 2014: Risks of summertime extreme thermal conditions in buildings as a result of climate change and exacerbation of urban heat islands. Building and Environment, 78, 81–88. doi:10.1016/j.buildenv.2014.04.012. ↩
Scasta, J. D., J. R. Weir, and M. C. Stambaugh, 2016: Droughts and wildfires in western U.S. rangelands. Rangelands, 38 (4), 197–203. doi:10.1016/j.rala.2016.06.003. ↩
Schmandt, J., G. R. North, and J. Clarkson, Eds., 2011: The Impact of Global Warming on Texas. University of Texas Press, Austin, TX, 328 pp. ↩
SCIPP, 2012: Southern Climate Impacts and Planning Program Regional Integrated Sciences and Assessments Program 4th Annual Report: May 1, 2011 - April 30, 2012: Norman, OK and Baton Rouge, LA. Southern Climate Impacts and Planning Program (SCIPP), Oklahoma Climatological Survey, University of Oklahoma and Louisiana State University, and the National Oceanic and Atmospheric Administration, 20 pp. URL. ↩
Shafer, M., and G. Garfin, 2014: Rio Grande-Bravo Climate Outlook: A Summary of Survey Responses. Southern Climate Impacts Planning Program, Norman, OK, 10 pp. URL. ↩
Shafer, M., D. Brown, and C. McNutt, 2016: Managing the 2011 drought: A climate services partnership. Climate in Context., John Wiley & Sons, Ltd, 191–212. doi:10.1002/9781118474785.ch9. ↩
Sharp Jr., J. M., and J. L. Banner, 1997: The Edwards aquifer: A resource in conflict. GSA Today, 7 (8), 1–9. URL. ↩
Shubert, R. A., 2015: Overview of the El Paso Kay Bailey Hutchison Desalination Plant. El Paso Water Utilities, Public Service Board, El Paso, TX, 18 pp. URL. ↩
St. Juliana, A., and J. Vogel, 2016: Kay Bailey Hutchison Inland desalination facility. Climate Adaptation: The State of Practice in U.S. Communities. Vogel, J., K. M. Carney, J. B. Smith, C. Herrick, M. Stults, M. O'Grady, A. St. Juliana, H. Hosterman, and L. Giangola, Eds., Kresge Foundation and Abt Associates, Detroit, MI, 109–120. URL. ↩
Stamm, J. F., M. F. Poteet, A. J. Symstad, M. Musgrove, A. J. Long, B. J. Mahler, and P. A. Norton, 2014: Historical and projected climate (1901–2050) and hydrologic response of karst aquifers, and species vulnerability in south-central Texas and western South Dakota. USGS Scientific Investigations Report 2014-5089. U.S. Geological Survey, Reston, VA, 61 pp. doi:10.3133/sir20145089. ↩
Stanke, C., M. Kerac, C. Prudhomme, J. Medlock, and V. Murray, 2013: Health effects of drought: A systematic review of the evidence. PLoS Currents: Disasters, doi:10.1371/currents.dis.7a2cee9e980f91ad7697b570bcc4b004. ↩
Staudinger, M. D., S. L. Carter, M. S. Cross, N. S. Dubois, J. E. Duffy, C. Enquist, R. Griffis, J. J. Hellmann, J. J. Lawler, J. O'Leary, S. A. Morrison, L. Sneddon, B. A. Stein, L. M. Thompson, and W. Turner, 2013: Biodiversity in a changing climate: A synthesis of current and projected trends in the US. Frontiers in Ecology and the Environment, 11 (9), 465–473. doi:10.1890/120272. ↩
Steiner, J. L., D. D. Briske, D. P. Brown, and C. M. Rottler, 2017: Vulnerability of Southern Plains agriculture to climate change. Climatic Change, Open access, 1–18. doi:10.1007/s10584-017-1965-5. ↩
Steiner, J. L., J. M. Schneider, C. Pope, S. Pope, P. Ford, and R. F. Steele, 2015: Southern Plains Assessment of Vulnerability and Preliminary Adaptation and Mitigation Strategies for Farmers, Ranchers, and Forest Land Owners. United States Department of Agriculture, El Reno, OK, 61 pp. URL. ↩
Steiner, J. L., J. M. Schneider, C. Pope, S. Pope, P. Ford, and Rachel F. Steele, 2015: Evaluación de vulnerabilidad de las llanuras meridionales y estrategias preliminares de adaptación y mitigación para agricultores, ganaderos y propietarios de tierras forestales. Departamento de Agricultura de Estados Unidos, 74 pp. URL. ↩
Stern, N., 2007: The Economics of Climate Change. The Stern Review. Cambridge University Press, Cambridge, New York, 712 pp. ↩
Strauss, B., C. Tebaldi, S. Kulp, S. Cutter, C. Emrich, D. Rizza, and D. Yawitz, 2014: Texas and the Surging Sea: A Vulnerability Assessment with Projections for Sea Level Rise and Coastal Flood Risk. Climate Central Research Report. Climate Central, Princeton, NJ, 29 pp. URL. ↩
Subedee, M., M. Dotson, and James Gibeaut, 2016: Investigating the environmental and socioeconomic impacts of sea level rise in the Galveston Bay, Texas region [poster]. Harte Research Institute, Texas A&M University, Corpus Christi, TX, 1 pp. URL. ↩
Sweet, W. V., R. E. Kopp, C. P. Weaver, J. Obeysekera, R. M. Horton, E. R. Thieler, and C. Zervas, 2017: Global and Regional Sea Level Rise Scenarios for the United States. NOAA Tech. Rep. NOS CO-OPS 083. National Oceanic and Atmospheric Administration, National Ocean Service, Silver Spring, MD, 75 pp. URL. ↩
Sweet, W. V., R. Horton, R. E. Kopp, A. N. LeGrande, and A. Romanou, 2017: Sea Level Rise. Climate Science Special Report: Fourth National Climate Assessment, Volume I. Wuebbles, D. J., D. W. Fahey, K. A. Hibbard, D. J. Dokken, B. C. Stewart, and T. K. Maycock, Eds., U.S. Global Change Research Program, Washington, DC, USA, 333–363. doi:10.7930/J0VM49F2. ↩
Tauxe, R. V., S. D. Holmberg, A. Dodin, J. V. Wells, and P. A. Blake, 2009: Epidemic cholera in Mali: High mortality and multiple routes of transmission in a famine area. Epidemiology and Infection, 100 (2), 279–289. doi:10.1017/S0950268800067418. ↩
Taylor, R. G., B. Scanlon, P. Döll, M. Rodell, R. van Beek, Y. Wada, L. Longuevergne, M. Leblanc, J. S. Famiglietti, M. Edmunds, L. Konikow, T. R. Green, J. Chen, M. Taniguchi, M. F. P. Bierkens, A. MacDonald, Y. Fan, R. M. Maxwell, Y. Yechieli, J. J. Gurdak, D. M. Allen, M. Shamsudduha, K. Hiscock, P. J.-F. Yeh, I. Holman, and H. Treidel, 2013: Ground water and climate change. Nature Climate Change, 3 (4), 322–329. doi:10.1038/nclimate1744. ↩
Texas Department of State Health Services, 2018: Diabetes Data: Surveillance and Evaluation. Texas Department of State Health Services, Austin. ↩
Texas Field Office, 2018: Texas Rice County Estimates. USDA National Agricultural Statistics Service, . URL. ↩
Texas General Land Office, 2017: Texas Coastal Resiliency Master Plan. Austin, 185 pp. URL. ↩
Texas Parks & Wildlife, 2012: News Release: Texas Fish Hatcheries Serve as Refuges for Imperiled Species. Athens, TX. June 12. URL. ↩
Texas Water Development Board, 2012: Texas State Water Plan. State of Texas, Austin, TX. URL. ↩
Texas Water Development Board, 2016: Desalination: Brackish Groundwater [online fact sheet]. Austin, 2 pp. URL. ↩
Texas Water Development Board, 2017: 2017 State Water Plan: Water for Texas. Austin, TX, 133 pp. URL. ↩
Texas Water Development Board, 2017: Public Water Supply Desalination Plant Capacities [infographic]. Austin, TX, accessed 03 March 2018. URL. ↩
THA, 2018: Texas Hospital Association Hurricane Harvey Analysis: Texas Hospitals' Preparation Strategies and Priorities for Future Disaster Response. Texas Hospital Association (THA), 8 pp. URL. ↩
Thomas, D., G. A. Santiago, R. Abeyta, S. Hinojosa, B. Torres-Velasquez, J. K. Adam, N. Evert, E. Caraballo, E. Hunsperger, J. L. Muñoz-Jordán, B. Smith, A. Banicki, K. M. Tomashek, L. Gaul, and T. M. Sharp, 2016: Reemergence of Dengue in Southern Texas, 2013. Emerging Infectious Disease Journal, 22 (6), 1002–1007. doi:10.3201/eid2206.152000. ↩
Tol, R. S. J., 2002: Estimates of the damage costs of climate change, Part II. Dynamic estimates. Environmental and Resource Economics, 21 (2), 135–160. doi:10.1023/a:1014539414591. ↩
Tolan, J. M., and M. Fisher, 2009: Biological response to changes in climate patterns: Population increases of gray snapper (Lutjanus griseus) in Texas bays and estuaries. Fishery Bulletin, 107 (1), 36–44. URL. ↩
Tribble, J. T., 2014: Language ideology and policy in an American “Hot Spot”: Perspectives on Native American language education. Indigenous Concepts of Education: Toward Elevating Humanity for All Learners. van Wyk, B., and D. Adeniji-Neill, Eds., Palgrave Macmillan US, 209–222. ↩
U. S. Energy Information Administration, 2018: Electricity Data Browser [web tool]. EIA, Independent Statistics & Analysis, . URL. ↩
U.S. Census Bureau, 2015: Ten U.S. Cities Now Have 1 Million People or More; California and Texas Each Have Three of These Places [Release Number: CD15-89]. Washington, DC. May 21. URL. ↩
U.S. Census Bureau, 2016: QuickFacts [web tool]. U.S. Census Bureau, Washington, DC. URL. ↩
USDOT, 2016: Texas: Transportation by the Numbers. U.S. Department of Transportation, 4 pp. URL. ↩
USGCRP, 2016: The Impacts of Climate Change on Human Health in the United States: A Scientific Assessment. U.S. Global Change Research Program, Washington, DC, 312 pp. doi:10.7930/J0R49NQX. ↩
USGCRP, 2017: Climate Science Special Report: Fourth National Climate Assessment, Volume I. Wuebbles, D. J., D. W. Fahey, K. A. Hibbard, D. J. Dokken, B. C. Stewart, and T. K. Maycock, Eds. U.S. Global Change Research Program, Washington, DC, USA, 470 pp. doi:10.7930/J0J964J6. ↩
Van der Veer Martens, B., B. G. Illston, and C. A. Fiebrich, 2017: The Oklahoma Mesonet: A pilot study of environmental sensor data citations. Data Science Journal, 16, 47. doi:10.5334/dsj-2017-047. ↩
Villarroel Walker, R., M. B. Beck, J. W. Hall, R. J. Dawson, and O. Heidrich, 2014: The energy-water-food nexus: Strategic analysis of technologies for transforming the urban metabolism. Journal of Environmental Management, 141, 104–115. doi:10.1016/j.jenvman.2014.01.054. ↩
Vision North Texas, 2010: Vision North Texas: Understanding Our Options for Growth. Vision North Texas, Dallas, TX, 65 pp. URL. ↩
Vose, R. S., D. R. Easterling, K. E. Kunkel, A. N. LeGrande, and M. F. Wehner, 2017: Temperature Changes in the United States. Climate Science Special Report: Fourth National Climate Assessment, Volume I. Wuebbles, D. J., D. W. Fahey, K. A. Hibbard, D. J. Dokken, B. C. Stewart, and T. K. Maycock, Eds., U.S. Global Change Research Program, Washington, DC, USA, 185–206. doi:10.7930/J0N29V45. ↩
Wehner, M. F., J. R. Arnold, T. Knutson, K. E. Kunkel, and A. N. LeGrande, 2017: Droughts, Floods, and Wildfires. Climate Science Special Report: Fourth National Climate Assessment, Volume I. Wuebbles, D. J., D. W. Fahey, K. A. Hibbard, D. J. Dokken, B. C. Stewart, and T. K. Maycock, Eds., U.S. Global Change Research Program, Washington, DC, USA, 231–256. doi:10.7930/J0CJ8BNN. ↩
Wildcat, D. R., 2009: Red Alert!: Saving the Planet with Indigenous Knowledge. Fulcrum Publishing , Golden, CO, 148 pp. ↩
Wilkins, D. E., and H. K. Stark, 2017: American Indian Politics and the American Political System. Rowman & Littlefield Publishers, Lanham, MD,. ↩
Willett, K. M., N. P. Gillett, P. D. Jones, and P. W. Thorne, 2007: Attribution of observed surface humidity changes to human influence. Nature, 449 (7163), 710–712. doi:10.1038/nature06207. ↩
Winguth, A. M. E., and B. Kelp, 2013: The urban heat island of the north-central Texas region and its relation to the 2011 severe Texas drought. Journal of Applied Meteorology and Climatology, 52 (11), 2418–2433. doi:10.1175/jamc-d-12-0195.1. ↩
Winguth, A., J. H. Lee, and Y. Ko, 2015: Climate change/extreme weather vulnerability and risk assessment for transportation infrastructure in Dallas and Tarrant counties. North Central Texas Council of Governments (NCTCOG) and Federal Highway Administration, Arlington, TX, and Washington, DC, 53 pp. URL. ↩
Winter, M., and C. Foster, 2014: Ogallala Aquifer—Lifeblood of the High Plains. Part I: Withdrawals Exceed Recharge. CoBank Knowledge Exchange Division, Greenwood Village, CO, 13 pp. URL. ↩
Wolter, K., J. K. Eischeid, L. Cheng, and M. Hoerling, 2016: What history tells us about 2015 U.S. Daily rainfall extremes. Bulletin of the American Meteorological Society, 97 (12), S9–S13. doi:10.1175/bams-d-16-0166.1. ↩
Wong, C. I., B. J. Mahler, M. Musgrove, and J. L. Banner, 2012: Changes in sources and storage in a karst aquifer during a transition from drought to wet conditions. Journal of Hydrology, 468–469, 159–172. doi:10.1016/j.jhydrol.2012.08.030. ↩
Yang, Y. C. E., S. Wi, P. A. Ray, C. M. Brown, and A. F. Khalil, 2016: The future nexus of the Brahmaputra River Basin: Climate, water, energy and food trajectories. Global Environmental Change, 37, 16–30. doi:10.1016/j.gloenvcha.2016.01.002. ↩
Zanobetti, A., M. S. O'Neill, C. J. Gronlund, and J. D. Schwartz, 2012: Summer temperature variability and long-term survival among elderly people with chronic disease. Proceedings of the National Academy of Sciences of the United States of America, 109 (17), 6608–6613. doi:10.1073/pnas.1113070109. ↩
Zhang, K., T.-H. Chen, and C. E. Begley, 2015: Impact of the 2011 heat wave on mortality and emergency department visits in Houston, Texas. Environmental Health, 14 (1), 11. doi:10.1186/1476-069x-14-11. ↩
Zhang, Y. H. P., 2013: Next generation biorefineries will solve the food, biofuels, and environmental trilemma in the energy–food–water nexus. Energy Science & Engineering, 1 (1), 27–41. doi:10.1002/ese3.2. ↩
Ziolkowska, J. R., C. A. Fiebrich, J. D. Carlson, A. D. Melvin, A. J. Sutherland, K. A. Kloesel, G. D. McManus, B. G. Illston, J. E. Hocker, and R. Reyes, 2017: Benefits and beneficiaries of the Oklahoma Mesonet: A multisectoral ripple effect analysis. Weather, Climate, and Society, 9 (3), 499–519. doi:10.1175/wcas-d-16-0139.1. ↩
External Link
You are leaving The Fourth National Climate Assessment and will be redirected to a new site in 5 seconds.