NCA4 Mitigation
  • ABOUT
    About this Report Guide to this Report Report Credits
  • CHAPTERS

    Front Matter

    • About this Report
    • Guide to the Report
    Summary Findings
    1. Overview

    National Topics

    1. Our Changing Climate
    2. Water
    3. Energy Supply, Delivery & Demand
    4. Land Cover & Land-Use Change
    5. Forests
    6. Ecosystems, Ecosystem Services, & Biodiversity
    7. Coastal Effects
    8. Oceans & Marine Resources
    9. Agriculture & Rural Communities
    10. Built Environment, Urban Systems, & Cities
    11. Transportation

    National Topics (cont.)

    1. Air Quality
    2. Human Health
    3. Tribes & Indigenous Peoples
    4. Climate Effects on U.S. International Interests
    5. Sector Interactions, Multiple Stressors, & Complex Systems

    Regions

    1. Northeast
    2. Southeast
    3. U.S. Caribbean
    4. Midwest
    5. Northern Great Plains
    6. Southern Great Plains
    7. Northwest
    8. Southwest
    9. Alaska
    10. Hawai‘i & U.S.-Affiliated Pacific Islands

    Responses

    1. Reducing Risks Through Adaptation Actions
    2. Reducing Risks Through Emissions Mitigation

    Appendices

    1. Report Development Process
    2. Information in the Fourth National Climate Assessment
    3. Data Tools & Scenario Products
    4. Looking Abroad
    5. Frequently Asked Questions
  • DOWNLOADS
    View All Report Downloads Chapter Executive Summary PDF Full Chapter PDF Chapter Figures (.zip) Chapter Bibliography (RIS) Chapter Presentation Package
CH 29: Mitigation
×

FOURTH NATIONAL CLIMATE ASSESSMENT

CHAPTER 29: REDUCING RISKS THROUGH EMISSIONS MITIGATION

Key Message 1
Mitigation-Related Activities Within the United States

Mitigation-related activities are taking place across the United States at the federal, state, and local levels as well as in the private sector. Since the Third National Climate Assessment, a growing number of states, cities, and businesses have pursued or deepened initiatives aimed at reducing emissions.

Read More

Key Message 2
The Risks of Inaction

In the absence of more significant global mitigation efforts, climate change is projected to impose substantial damages on the U.S. economy, human health, and the environment. Under scenarios with high emissions and limited or no adaptation, annual losses in some sectors are estimated to grow to hundreds of billions of dollars by the end of the century. It is very likely that some physical and ecological impacts will be irreversible for thousands of years, while others will be permanent.

Read More

Key Message 3
Avoided or Reduced Impacts Due to Mitigation

Many climate change impacts and associated economic damages in the United States can be substantially reduced over the course of the 21st century through global-scale reductions in greenhouse gas emissions, though the magnitude and timing of avoided risks vary by sector and region. The effect of near-term emissions mitigation on reducing risks is expected to become apparent by mid-century and grow substantially thereafter.

Read More

Key Message 4
Interactions Between Mitigation and Adaptation

Interactions between mitigation and adaptation are complex and can lead to benefits, but they also have the potential for adverse consequences. Adaptation can complement mitigation to substantially reduce exposure and vulnerability to climate change in some sectors. This complementarity is especially important given that a certain degree of climate change due to past and present emissions is unavoidable.

Read More

Key Message 1

Mitigation-related activities are taking place across the United States at the federal, state, and local levels as well as in the private sector. Since the Third National Climate Assessment, a growing number of states, cities, and businesses have pursued or deepened initiatives aimed at reducing emissions.

Key Message 2

In the absence of more significant global mitigation efforts, climate change is projected to impose substantial damages on the U.S. economy, human health, and the environment. Under scenarios with high emissions and limited or no adaptation, annual losses in some sectors are estimated to grow to hundreds of billions of dollars by the end of the century. It is very likely that some physical and ecological impacts will be irreversible for thousands of years, while others will be permanent.

Key Message 3

Many climate change impacts and associated economic damages in the United States can be substantially reduced over the course of the 21st century through global-scale reductions in greenhouse gas emissions, though the magnitude and timing of avoided risks vary by sector and region. The effect of near-term emissions mitigation on reducing risks is expected to become apparent by mid-century and grow substantially thereafter.

Key Message 4

Interactions between mitigation and adaptation are complex and can lead to benefits, but they also have the potential for adverse consequences. Adaptation can complement mitigation to substantially reduce exposure and vulnerability to climate change in some sectors. This complementarity is especially important given that a certain degree of climate change due to past and present emissions is unavoidable.

Likelihood

Virtually Certain Extremely Likely Very Likely Likely About as Likely as Not Unlikely Very Unikely Extremely Unlikely Exceptionally Unlikely
99%–100% 95%–100% 90%–100% 66%-100% 33%-66% 0%-33% 0%-10% 0%-5% 0%-1%

Confidence Level

Very High High Medium Low
Strong evidence (established theory, multiple sources, consistent results, well documented and accepted methods, etc.), high consensus Moderate evidence (several sources, some consistency, methods vary and/or documentation limited, etc.), medium consensus Suggestive evidence (a few sources, limited consistency, models incomplete, methods emerging, etc.), competing schools of thought Inconclusive evidence (limited sources, extrapolations, inconsistent findings, poor documentation and/or methods not tested, etc.), disagreement or lack of opinions among experts
 

Documenting Uncertainty: This assessment relies on two metrics to communicate the degree of certainty in Key Findings. See Guide to this Report for more on assessments of likelihood and confidence.

  • SECTIONS
  • Executive Summary
  • Introduction
  • Timing of Action
  • State of Mitigation Efforts
  • KM 1: Mitigation Activities
  • KM 2: Risks of Inaction
  • KM 3: Avoided/Reduced Impacts
  • KM 4: Mitigation & Adapatation Interactions
  • Traceable Accounts
  • References

EXECUTIVE SUMMARY:
Chapter 29: Reducing Risks Through Emissions Mitigation

Current and future emissions of greenhouse gases, and thus emission mitigation actions, are crucial for determining future risks and impacts of climate change to society. The scale of risks that can be avoided through mitigation actions is influenced by the magnitude of emissions reductions, the timing of those reductions, and the relative mix of mitigation strategies for emissions of long-lived greenhouse gases (namely, carbon dioxide), short-lived greenhouse gases (such as methane), and land-based biologic carbon.1 Many actions at national, regional, and local scales are underway to reduce greenhouse gas emissions, including efforts in the private sector.

Climate change is projected to significantly damage human health, the economy, and the environment in the United States, particularly under a future with high greenhouse gas emissions. A collection of frontier research initiatives is underway to improve understanding and quantification of climate impacts. These studies have been designed across a variety of sectoral and spatial scales and feature the use of internally consistent climate and socioeconomic scenarios. Recent findings from these multisector modeling frameworks demonstrate substantial and far-reaching changes over the course of the 21st century—and particularly at the end of the century—with negative consequences for a large majority of sectors, including infrastructure and human health.2,3,4,5 For sectors where positive effects are observed in some regions or for specific time periods, the effects are typically dwarfed by changes happening overall within the sector or at broader scales.

Recent studies also show that many climate change impacts in the United States can be substantially reduced over the course of the 21st century through global-scale reductions in greenhouse gas emissions. While the difference in climate outcomes between scenarios is more modest through the first half of the century,6 the effect of mitigation in avoiding climate change impacts typically becomes clear by 2050 and increases substantially in magnitude thereafter. Research supports that early and substantial mitigation offers a greater chance of avoiding increasingly adverse impacts.

The reduction of climate change risk due to mitigation also depends on assumptions about how adaptation changes the exposure and vulnerability of the population. Physical damages to coastal property and transportation infrastructure are particularly sensitive to adaptation assumptions, with proactive measures estimated to be capable of reducing damages by large fractions. Because society is already committed to a certain amount of future climate change due to past and present emissions and because mitigation activities cannot avoid all climate-related risks, mitigation and adaptation activities can be considered complementary strategies. However, adaptation can require large up-front costs and long-term commitments for maintenance, and uncertainty exists in some sectors regarding the applicability and effectiveness of adaptation in reducing risk. Interactions between adaptation and mitigation strategies can result in benefits or adverse consequences. While uncertainties still remain, advancements in the modeling of climate and economic impacts, including current understanding of adaptation pathways, are increasingly providing new capabilities to understand and quantify future effects.


Projected Damages and Potential for Risk Reduction by Sector

Click to zoom in or out and to view data.

Press enter to move cursor back to the first sector in this graphic
CLICK HERE TO INTERACT

View static image

The total area of each circle represents the projected annual economic damages (in 2015 dollars) under a higher scenario (RCP8.5) in 2090 relative to a no-change scenario. The decrease in damages under a lower scenario (RCP4.5) compared to RCP8.5 is shown in the lighter-shaded area of each circle. Where applicable, sectoral results assume population change over time, which in the case of winter recreation leads to positive effects under RCP4.5, as increased visitors outweigh climate losses. Importantly, many sectoral damages from climate change are not included here, and many of the reported results represent only partial valuations of the total physical damages. See EPA 2017 for ranges surrounding the central estimates presented in the figure; results assume limited or no adaptation.2 Adaptation was shown to reduce overall damages in sectors identified with the diamond symbol but was not directly modeled in, or relevant to, all sectors. Asterisks denote sectors with annual damages that may not be visible at the given scale. Only one impact (wildfire) shows very small positive effects, owing to projected landscape-scale shifts to vegetation with longer fire return intervals (see Ch. 6: Forests for a discussion on the weight of evidence regarding projections of future wildfire activity). The interactive version of this figure includes value ranges for both the projected damages under RCP8.5 and the projected percentage of avoided damages under RCP4.5. From Figure 29.2 (Source: adapted from EPA 2017).2

CHAPTER 29
Reducing Risks Through Emissions Mitigation

Introduction

Federal Coordinating Lead Author:
Jeremy Martinich, U.S Environmental Protection Agency
Chapter Lead:
Jeremy Martinich, U.S Environmental Protection Agency
Chapter Authors:
Benjamin DeAngelo, National Oceanic and Atmospheric Administration
Delavane Diaz, Electric Power Research Institute
Brenda Ekwurzel, Union of Concerned Scientists
Guido Franco, California Energy Commission
Carla Frisch, U.S. Department of Energy
James McFarland, U.S. Environmental Protection Agency
Brian O'Neill, University of Denver (National Center for Atmospheric Research through June 2018)
Review Editor:
Andrew Light, George Mason University
USGCRP Coordinators:
David Reidmiller, Director
Christopher W. Avery, Senior Manager

<b>Martinich</b>, J., B.J. DeAngelo, D. Diaz, B. Ekwurzel, G. Franco, C. Frisch, J. McFarland, and B. O’Neill, 2018: Reducing Risks Through Emissions Mitigation. In <i>Impacts, Risks, and Adaptation in the United States: Fourth National Climate Assessment, Volume II</i> [Reidmiller, D.R., C.W. Avery, D.R. Easterling, K.E. Kunkel, K.L.M. Lewis, T.K. Maycock, and B.C. Stewart (eds.)]. U.S. Global Change Research Program, Washington, DC, USA, pp. 1346–1386. doi: 10.7930/NCA4.2018.CH29

  • Climate Science Special Report

This chapter assesses recent advances in climate science and impacts, adaptation, and vulnerability research that have improved understanding of how potential mitigation pathways can avoid or reduce the long-term risks of climate change within the United States. This chapter does not evaluate technology options, costs, or the adequacy of existing or planned mitigation efforts relative to meeting specific policy targets, as those topics have been the subject of domestic (e.g., Executive Office of the President 2016, CCSP 2007, DeAngelo et al. 2017, NRC 20157,8,9,10) and international analyses (e.g., Fawcett et al. 2015, Clarke et al. 201411,12). Also, this chapter does not assess the potential roles for carbon sinks (or storage) in mitigation, which are discussed in Chapter 5: Land Changes, and in the Second State of the Carbon Cycle Report.13 Further, it is beyond the scope of this chapter and this assessment to evaluate or recommend policy options.

USGCRP defines risk as threats to life, health and safety, the environment, economic well-being, and other things of value. Risks are often evaluated in terms of how likely they are to occur (probability) and the damages that would result if they did happen (consequences).

Both mitigation and adaptation responses to climate change are likely to occur as part of an iterative risk management strategy in which initial actions are modified over time as learning occurs (Ch. 28: Adaptation). This chapter focuses primarily on the early stages of this iterative process in which risks and vulnerabilities are identified and the potential climate impacts of emissions scenarios are assessed.

Box 29.1: Options for Reducing or Removing Greenhouse Gases

Mitigation refers to measures to reduce the amount and speed of future climate change by reducing emissions of greenhouse gases (GHGs) or by increasing their removal from the atmosphere. Emission reduction measures include replacing conventional, CO2-emitting fossil fuel energy technologies or systems with low- or zero-emissions ones (such as wind, solar, nuclear, biofuels, fossil energy with carbon capture and storage, and energy efficiency measures), as well as changing technologies and practices in order to lower emissions of other GHGs such as methane, nitrous oxide, and hydrofluorocarbons.7,14,15 Measures that enhance the removal of CO2 from the atmosphere (see Box 29.3) include changing land-use and management practices to store carbon in plants, trees, and soils; increasing ocean carbon storage through biological or chemical means; capturing atmospheric CO2 through engineered chemical reactions and storing it in geologic reservoirs; or converting terrestrial biomass into energy while capturing and storing the CO2.16 Using captured CO2 in products such as polymers and cement is a potential alternative to geologic storage.17

The adoption of these measures may be promoted through a variety of policy instruments, such as emissions pricing (that is, GHG emission fees or emissions caps with permit trading), regulations and standards (such as emission standards, technology requirements, and building codes), subsidies (for example, tax incentives and rebates), and public funding for research, development, and demonstration programs.

Timing and Magnitude of Action

Current and future emissions, and thus emissions mitigation actions, are crucial for determining future risks and impacts. The scale of risks that can be avoided through mitigation actions is influenced by the magnitude of emissions reductions, the timing of those emissions reductions, and the relative mix of mitigation strategies for emissions of long-lived GHGs (namely, CO2), short-lived GHGs (such as methane), and land-based biologic carbon.1 Intentional removal of CO2 from the atmosphere, often referred to as negative emissions, or other climate interventions have also been proposed10,18 and may play a role in future mitigation strategies (see Box 29.3). 

Net cumulative CO2 emissions in the industrial era will largely determine long-term global average temperature change9 and thus the risks and impacts associated with that change in the climate. Large reductions in present-day emissions of the long-lived GHGs are estimated to have modest temperature effects in the near term (over the next couple decades), but these emission reductions are necessary to achieve any long-term objective of preventing warming of any desired magnitude.9 Decisions that decrease or increase emissions over the next few decades will set into motion the degree of impacts that will likely last throughout the rest of this century, with some impacts (such as sea level rise) lasting for thousands of years or even longer.19,20,21

Meeting any climate stabilization goal, such as the oft-cited objective of limiting the long-term globally averaged temperature to 2°C (3.6°F) above preindustrial levels, necessitates that there be a physical upper limit on the cumulative amount of CO2 that can be added to the atmosphere.9 Early and substantial mitigation offers a greater chance for achieving a long-term goal, whereas delayed and potentially much steeper emissions reductions jeopardize achieving any long-term goal given uncertainties in the physical response of the climate system to changing atmospheric CO2, mitigation deployment uncertainties, and the potential for abrupt consequences.11,22,23 Early efforts also enable an iterative approach to risk management, allowing stakeholders to respond to what is learned over time about climate impacts and the effectiveness of available actions (Ch. 28: Adaptation).24,25,26 Evidence exists that early mitigation can reduce climate impacts in the nearer term (such as reducing the loss of perennial sea ice and effects on ice-dwelling species) and, in the longer term, prevent critical thresholds from being crossed (such as marine ice sheet instability and the resulting consequences for global sea level change).27,28,29,30

State of Emissions Mitigation Efforts

Actions are currently underway at global, national, and subnational scales to reduce GHG emissions. This section provides an overview of agreements, policies, and actions being taken at various levels.

Long-Term Temperature Goals and the Paris Agreement

The idea of limiting globally averaged warming to a specific value has long been examined in the scientific literature and, in turn, gained attention in policy discourse (see DeAngelo et al. 2017 for additional information9). Most recently, the Paris Agreement of 2015 took on the long-term aims of “holding the increase in the global average temperature to well below 2°C above pre-industrial levels and pursuing efforts to limit the temperature increase to 1.5°C above pre-industrial levels”.31 These targets were developed with the goal of avoiding the most severe climate impacts; however, they should not be viewed as thresholds below which there are zero risks and above which numerous tipping points occur (that is, a point at which a change in the climate triggers a significant environmental event, which may be permanent). In order to reach the Paris Agreement’s long-term temperature goal, Parties to the Agreement “aim to reach global peaking of GHG emissions as soon as possible . . . and to undertake rapid reductions thereafter.” Many countries announced voluntary, nonbinding GHG emissions reduction targets and related actions in the lead-up to the Paris meeting; these announcements addressed emissions through 2025 or 2030 and took a range of forms.31 The Paris Agreement has been ratified by 180 Parties to the UN Framework Convention on Climate Change, which account for 88% of global GHG emissions.32,33

Achieving the Paris Agreement target of limiting global mean temperature to less than 2°C (3.6°F) above preindustrial levels requires substantial reductions in net global CO2 emissions prior to 2040 relative to present-day values and likely requires net CO2 emissions to become zero or possibly negative later in the century, relying on as-yet unproven technologies to remove CO2 from the atmosphere. To remain under this temperature threshold with two-thirds likelihood, future cumulative net CO2 emissions would need to be limited to approximately 230 gigatons of carbon (GtC), an amount that would be reached in roughly the next two decades assuming global emissions follow the range between the RCP4.5 and RCP8.5 scenarios.9 Achieving global GHG emissions reduction targets and actions announced by governments in the lead-up to the 2015 Paris climate conference would hold open the possibility of meeting the 2°C (3.6°F) temperature goal, whereas there would be virtually no chance if net global emissions followed a pathway well above those implied by country announcements.9

In June 2017, the United States announced its intent to withdraw from the Paris Agreement.34 The statement is available online: https://www.whitehouse.gov/briefings-statements/statement-president-trump-paris-climate-accord/. The earliest effective date of formal withdrawal is November 4, 2020. Some state governments, local governments, and private-sector entities have announced pledges to reduce emissions in the context of long-term temperature aims consistent with those outlined in the Paris Agreement.35,36

Key Message 1

Mitigation-Related Activities Within the United States

Mitigation-related activities are taking place across the United States at the federal, state, and local levels as well as in the private sector. Since the Third National Climate Assessment, a growing number of states, cities, and businesses have pursued or deepened initiatives aimed at reducing emissions.

Many activities within the public and private sectors either aim to or have the effect of reducing these emissions. Fossil fuel combustion accounts for 77% of the total U.S. GHG emissions (using the 100-year global warming potential), with agriculture, industrial processes, and methane from fossil fuel extraction and processing as well as waste accounting for the remainder.37 A 100-year global warming potential is an index measuring the radiative forcing following an emission of a unit mass of a given substance, accumulated over one hundred years, relative to that of the reference substance, CO2.38 At the federal level, a number of mea­sures have been implemented to promote advanced, low-carbon energy technologies and fuels, including energy efficiency. Broadly considered, these measures include GHG regulations; other rules and regulations with climate co-benefits; codes and standards; research, development, and demonstration projects and programs; federal procurement practices; voluntary programs; and various subsidies (such as production and investment tax credits).14,39 Federal measures to address sources other than fossil fuel combustion include agriculture and forestry programs to increase soil and forest carbon sequestration and minimize losses through wildfire or other land-use processes, regulations to phase down hydrofluorocarbons, and standards for reducing methane emissions from fossil fuel extraction and processing.14 The Administration is currently reviewing many of these measures through the lens of Executive Order 13783, which aims to ease regulatory burdens on “the development or use of domestically produced energy resources, with particular attention to oil, natural gas, coal, and nuclear energy resources.”40

State, local, and tribal government mitigation approaches include comprehensive emissions reduction strategies as well as sector- and technology-specific policies designed for many reasons. As shown in Figure 29.1a, at least 455 cities support emissions reductions in the context of global efforts, including 110 with emissions reduction targets.36 At the state level, the color shown on each state indicates the total number of activities taken in that state across six policy areas: GHG target/cap/pricing; renewable/carbon dioxide capture and storage (CCS)/nuclear; transportation; energy efficiency; non-CO2 GHG; and forestry and land use.36 Figure 29.1b shows the number of activities by policy area for each state. For example, states in the Northeast take part in the Regional Greenhouse Gas Initiative, a mandatory market-based effort to reduce power sector emissions.41 California has a legal mandate to reduce emissions 40% below 1990 levels by 2030, and in a 2017 law, the state extended its emissions trading program to 2030, as well. Several states have adopted voluntary pledges to reduce emissions. Technology-specific approaches include targets to increase the use of renewable energy such as wind and solar, zero- or low-emissions transportation options, and energy efficient technologies and practices.42,43 Many tribes are also prioritizing energy-efficiency and renewable-energy projects (Ch. 15: Tribes, KM 1).44 Mitigation activities related to methane and forestry/land-use activities are growing in number and vary by locale.


Figure 29.1: Mitigation-Related Activities at State and Local Levels

CLICK HERE TO INTERACT
Alternative text for the main image for figure 29_1

Click to Sort by Activity Type

GHG Target / Cap / Pricing
Renewable / CCS / Nuclear
Transportation
Energy Efficiency
Non-CO2 GHG
Forestry and Land Use

View static image

Figure 29.1: The map (top) shows the number of mitigation-related activities at the state level (out of 30 illustrative activities) as well as cities supporting emissions reductions; the chart (bottom) depicts the type and number of activities by state.36 Several territories also have a variety of mitigation-related activities including American Sāmoa, the Federated States of Micronesia, Guam, Northern Mariana Islands, Puerto Rico, and the U.S. Virgin Islands.42 ,45 Sources: (top) EPA and ERT, Inc.; (bottom) adapted from America’s Pledge 2017.36
This figure was revised in June 2019. See Errata for details: https://nca2018.globalchange.gov/downloads

In the private sector, many companies seek to provide environmental benefits for a variety of reasons, including supporting environmental stewardship, responding to investor demands for prudent risk management, finding economic opportunities in efforts to reduce GHG emissions, and, in the case of multinationals, meeting mitigation mandates in the European Union or other jurisdictions. Since the last National Climate Assessment, private companies have increasingly taken inventory of their emissions and moved forward to implement science-based emissions reduction targets as well as internal carbon prices.36 The Carbon Disclosure Project46 is one example of a voluntary program where companies register their pledges to reduce GHG emissions and/or to manage their climate risks. Corporate purchases of and commitments to purchase renewable energy have increased over the last decade.47

Market forces and technological change, particularly within the electric power sector, have contributed to a decline in U.S. GHG emissions over the past decade. In 2016, U.S. emissions were at their lowest levels since 1994.37 Power sector emissions were 25% below 2005 levels in 2016, the largest sectoral reduction over this time.37 This decline was in large part due to increases in natural gas generation as well as renewable energy generation and energy efficiency (Ch. 4: Energy, KM 2).48 Given these changes in the power sector, the transportation sector currently has the largest annual sectoral emissions (Ch. 12: Transportation). As of the writing of this report, projections of U.S. fossil fuel CO2 and other GHG emissions show flat or declining trajectories over the next decade, with a central estimate of about 15%–20% below 2005 levels by 2025.49,50 Prior to the adoption of the Paris Agreement, the United States put forward a nonbinding “intended nationally determined contribution” of reducing emissions 26%–28% below 2005 levels in 2025. On June 1, 2017, President Trump announced that the United States would cease implementation of this nationally determined contribution. Some state and local governments, as well as private-sector entities, have announced emission reduction pledges which aim to be consistent with the nonbinding target.35,36 For more information on trends in, drivers of, and potential efforts to address U.S. GHG emissions, see the Inventory of U.S. Greenhouse Gas Emissions and Sinks.37

Reducing Impacts Through Mitigation

To understand how large-scale emissions mitigation can reduce climate impacts, it is useful to look at how the impacts change under various emissions scenarios. In recent years, the science and economics of estimating future climate change impacts have advanced substantially, with increasing emphasis on interdisciplinary approaches to investigate impacts, vulnerabilities, and responses.51,52,53 These advances have enabled several ongoing frontier research initiatives to improve understanding and quantification of climate impacts at various spatial scales ranging from global to local levels. This section describes findings for the United States from a selection of recent multisector coordinated modeling frameworks listed in Table 29.1, which are frequently cited throughout this chapter because each report provides modeling results across multiple sectors and scenarios similar to those developed for this report. These approaches commonly feature the use of internally consistent climate and socioeconomic scenarios and underlying assumptions across a variety of sectoral analyses. While research projecting physical and economic impacts in the United States has increased considerably since the Third National Climate Assessment (NCA3), it is important to note that this literature is incomplete in its coverage of the breadth of potential impacts.

Download CSV
Download JSON
View in GCIS

Table 29.1: Multisector Modeling Frameworks since NCA3

Collaboration or Project Name Host/Lead Organization and References Sectors Covered Coverage
Benefits of Reduced Anthropogenic Climate change (BRACE) National Center for Atmospheric Research (O’Neill et al. 2017)4 Heat extremes and health, agriculture and land use, tropical cyclones, sea level rise, drought and conflict Global
Costs of Inaction and Resource scarcity: Consequences for Long-term Economic growth (CIRCLE) Organisation for Economic Co-operation and Development (OECD 2015)55 Tourism, agriculture, coastal, energy, extreme precipitation events, health Global
Inter-Sectoral Impact Model Intercomparison Project (ISIMIP) Potsdam Institute for Climate Impact Research (Huber et al. 2014)56 Water, agriculture, biomes, infrastructure, health/malaria, fishery, permafrost Global
American Climate Prospectus (ACP) Climate Impact Lab (Houser et al. 2015; Hsiang et al. 2017)3,5 Agriculture, health, labor productivity, crime and conflict, coastal, energy United States
Climate Change Impacts and Risk Analysis (CIRA) U.S. Environmental Protection Agency (EPA 2015, 2017)2,57 More than 20 specific impacts categorized into 6 broad sectors: health (including labor productivity), infrastructure, electricity, water resources, agriculture, ecosystems United States
California Climate Change Assessments State of California (Cayan et al. 2008, 2013; California Energy Commission 2006)58,59,60 Public health, agriculture, energy, coastal, water resources, ecosystems, wildfire, recreation State-Level
Colorado Climate Change Vulnerability Study Colorado Energy Office (Gordon and Ojima 2015)61 Ecosystems, water, agriculture, energy, transportation, recreation and tourism, public health State-Level
New York ClimAID Project New York State Energy Research and Development Authority (Rosenzweig et al. 2011; Horton et al. 2014)62,63 Water resources, coastal zones, ecosystems, agriculture, energy, transportation, telecommunications, public health State-Level
Table 29.1: Selection of Multisector Impacts Modeling Frameworks Since NCA3. Source: adapted from Diaz and Moore 2017.54

Key Message 2

The Risks of Inaction

In the absence of more significant global mitigation efforts, climate change is projected to impose substantial damages on the U.S. economy, human health, and the environment. Under scenarios with high emissions and limited or no adaptation, annual losses in some sectors are estimated to grow to hundreds of billions of dollars by the end of the century. It is very likely that some physical and ecological impacts will be irreversible for thousands of years, while others will be permanent.

Climate change is projected to significantly affect human health, the economy, and the environment in the United States, particularly in futures with high GHG emissions, such as RCP8.5, and under scenarios with limited or no adaptation (for more on RCPs, see the Scenario Products section of App. 3).64 Recent findings from multisector modeling frameworks demonstrate substantial and far-reaching changes over the course of the 21st century—and particularly towards the end of the century—with negative consequences for a large majority of sectors. Moreover, the impacts and costs of climate change are already being felt in the United States, and recent extreme weather and climate-related events can now be attributed with increasingly higher confidence to human-caused warming.65 Impacts associated with human health, such as premature mortality due to extreme temperature and poor air quality, are commonly some of the most economically substantial (Ch. 13: Air Quality; Ch. 14: Human Health).2,3,4,5 While many sectors face large economic risks from climate change, other impacts can have significant implications for societal or cultural resources.66,67 Further, some impacts will very likely be irreversible for thousands of years, including those to species, such as corals (Ch. 9: Oceans; Ch. 27: Hawaiʻi & Pacific Islands1,2,68), or those that involve the exceedance of thresholds, such as the effects of ice sheet disintegration on accelerated sea level rise, leading to widespread effects on coastal development lasting thousands of years.69,70,71 Figure 29.2 shows that climate change is projected to cause damage across nearly all of the sectors analyzed. The conclusion that climate change is projected to result in adverse impacts across most sectors is consistently found in U.S.-focused multisector impact analyses.2,3,4,5 For sectors where positive effects are observed in some regions or for specific time periods (for example, reduced mortality from extreme cold temperatures or beneficial effects on crop yields), the effects are typically dwarfed by changes happening overall within the sector or at broader scales (for example, comparatively larger increases in mortality from extreme heat or many more crops experiencing adverse effects).2,3,4,5


Figure 29.2: Projected Damages and Potential for Risk Reduction by Sector

Click to zoom in or out and to view data.

Press enter to move cursor back to the first sector in this graphic
CLICK HERE TO INTERACT

View static image

Figure 29.2: The total area of each circle represents the projected annual economic damages (in 2015 dollars) under a higher scenario (RCP8.5) in 2090 relative to a no-change scenario. The decrease in damages under a lower scenario (RCP4.5) compared to RCP8.5 is shown in the lighter-shaded area of each circle. Where applicable, sectoral results assume population change over time, which in the case of winter recreation leads to positive effects under RCP4.5, as increased visitors outweigh climate losses. Importantly, many sectoral damages from climate change are not included here, and many of the reported results represent only partial valuations of the total physical damages. See EPA 2017 for ranges surrounding the central estimates presented in the figure; results assume limited or no adaptation.2 Adaptation was shown to reduce overall damages in sectors identified with the diamond symbol but was not directly modeled in, or relevant to, all sectors. Asterisks denote sectors with annual damages that may not be visible at the given scale. Only one impact (wildfire) shows very small positive effects, owing to projected landscape-scale shifts to vegetation with longer fire return intervals (see Ch. 6: Forests for a discussion on the weight of evidence regarding projections of future wildfire activity). The interactive version of this figure includes value ranges for both the projected damages under RCP8.5 and the projected percentage of avoided damages under RCP4.5. Source: adapted from EPA 2017.2

Key Message 3

Avoided or Reduced Impacts Due to Mitigation

Many climate change impacts and associated economic damages in the United States can be substantially reduced over the course of the 21st century through global-scale reductions in greenhouse gas emissions, though the magnitude and timing of avoided risks vary by sector and region. The effect of near-term emissions mitigation on reducing risks is expected to become apparent by mid-century and grow substantially thereafter.

Many climate change impacts in the United States can be substantially reduced over the course of the 21st century through global-scale reductions in GHG emissions (Figure 29.2). While the difference in climate impact outcomes between different scenarios is more modest through the first half of the century,6 the effect of mitigation in avoiding climate change impacts typically becomes clear by 2050 and increases substantially in magnitude thereafter.2,3,4 For some sectors, this creates large projected benefits of mitigation. For example, by the end of the century, reduced climate change under a lower scenario (RCP4.5) compared to a higher one (RCP8.5) avoids (overall) thousands to tens of thousands of deaths per year from extreme temperatures (Ch. 14: Human Health),2,3,5 hundreds to thousands of deaths per year from poor air quality (Ch. 13: Air Quality),2,72 and the annual loss of hundreds of millions of labor hours from extreme temperatures.2,3 When monetized, each of these avoided health impacts represents domestic economic benefits of mitigation on the order of tens to hundreds of billions of dollars per year.2,3,73 For example, Figure 29.2 shows that reduced emissions under RCP4.5 can avoid approximately 48% (or $75 billion) of the $155 billion in lost wages per year by 2090 due to the effects of extreme temperature on labor (for example, outdoor industries reducing total labor hours during heat waves). Looking at the economy as a whole, mitigation can substantially reduce damages while also narrowing the uncertainty in potential adverse impacts (Figure 29.3).


Figure 29.3: Estimates of Direct Economic Damage from Temperature Change

Estimates of Direct Economic Damage from Temperature Change
Two graphs are shown. The first graph depicts observed and projected global fossil fuel emissions of carbon (in gigatons per year) from 1900 to 2100. Under the higher scenario (RCP8.5), emissions are projected to exceed 25 gigatons per year by 2100, whereas under the lower and even lower scenarios (RCP4.5 and RCP2.6), global carbon emissions are projected to decline below 5 gigatons and into the negative, respectively. The second graph shows the projected direct damage (in percent of U.S. gross domestic product, or GDP) from global average temperature change (in degrees Fahrenheit) to the U.S. economy for six impact sectors for the period 2080 to 2099, as compared to 1980 to 2010. Ranges of temperature change and damage are shown for the higher, lower, and even lower scenarios based on multiple climate models. Under the lower and even lower scenarios, temperature change ranges from less than zero to 7.5 degrees, and potential median damages range from zero to about 3 percent of GDP. Under the higher scenario, temperature change ranges from 4 to 14.5 degrees, and potential median damages range from just above zero to more than 10 percent of GDP.
Figure 29.3: The left graph shows the observed and projected changes in fossil fuel and industrial emissions of CO2 from human activities (emissions from land-use change do not appear in the figure; within the RCPs these emissions are less than 1 GtC per year by 2020 and fall thereafter). The right graph shows projections of direct damage to the current U.S. economy for six impact sectors (agriculture, crime, coasts, energy, heat mortality, and labor) as a function of global average temperature change (represented as average for 2080–2099 compared to 1980–2010). Compared to RCP8.5, lower temperatures due to mitigation under either of the lower scenarios (RCP2.6 or RCP4.5) substantially reduce median damages (dots) to the U.S. economy while also narrowing the uncertainty in potential adverse impacts. Dot-whiskers indicate the uncertainty in direct damages in 2090 (average of 2080–2099) derived from multiple combinations of climate models and forcing scenarios (dot, median; thick line, inner 66% credible interval; thin line, inner 90%). The gray shaded area represents the 90% confidence interval in the fit (black line) to the damage estimates. Damage estimates only capture adaptation to the extent that populations employed them in the historical period. Sources: (left) adapted from Wuebbles et al. 2017; 83 (right) adapted from Hsiang et al. 20173 and republished with permission of American Association for the Advancement of Science.

SHRINK

Many impacts have significant societal or cultural values, such as impacts to freshwater recreational fishing. However, estimating the full value of these changes remains a challenge. Recent studies highlight that climate change can disproportionately affect socially vulnerable communities, with mitigation providing substantial risk reduction for these populations.3,74,75,76 Some analyses also suggest that findings are sensitive to assumptions regarding adaptive capacity and socioeconomic change.5,71,77 In general, studies find that reduced damages due to mitigation also reduce the potential level of adaptation needed.2,78 As for socioeconomic change, increasing population growth can compound the damages occurring from climate change.4,79 Some studies have shown that impacts can be more sensitive to demographic and economic conditions than to the differences in future climates between the scenarios.80 See the Scenario Products section of Appendix 3 for more detail on population and land-use scenarios developed for the Fourth National Climate Assessment (NCA4).

For other sectors, such as impacts to coastal development, the effect of mitigation emerges more toward the end of the century due to lags in the response of ice sheets and oceans to warming (Ch. 8: Coastal).81 This results in smaller relative reductions in risk. For example, while annual damages to coastal property from sea level rise and storm surge, assuming no adaptation, are projected to range in the tens to hundreds of billions of dollars by the end of the century under RCP8.5, mitigation under RCP4.5 is projected to avoid less than a quarter of these damages.2,5,82 However, the avoided impacts beyond 2100 are likely to be larger based on projected trajectories of sea level change.19,20,27

The marginal benefit, equivalently the avoided damages, of mitigation can be expressed as the social cost of carbon (SCC). The SCC is a monetized estimate of the long-term climate damages to society from an additional amount of CO2 emitted and includes impacts that accrue in market sectors such as agriculture, energy services, and coastal resources, as well as nonmarket impacts on human health and ecosystems.84,85 This metric is used to inform climate risk management decisions at national, state, and corporate levels.86,87,88,89,90 Notably, estimating the SCC depends on normative social values such as time preference, risk aversion, and equity considerations that can lead to a range of values. In recognition of the ongoing examination about existing approaches to estimating the SCC,91,92,93 a National Academies of Sciences, Engineering, and Medicine report94 recommended various improvements to SCC models, including that they 1) be consistent with the current state of scientific knowledge, 2) characterize and quantify key uncertainties, and 3) be clearly documented and reproducible.

Although uncertainties still remain, advancements in climate impacts and economics modeling are increasingly providing new capabilities to quantify future societal effects of climate change. A growing body of studies use and assess statistical relationships between observed socioeconomic outcomes and weather or climate variables to estimate the impacts of climate change (e.g., Müller et al. 2017, Hsiang et al. 20173,95). In the United States, in particular, the rise of big data (large volumes of data brought about via the digital age) and advanced computational power offer potential improvements to study climate impacts in many sectors like agriculture, energy, and health, including previously omitted sectors such as crime, conflict, political turnover, and labor productivity. Parallel advancements in high-resolution integrated assessment models (those that jointly simulate changes in physical and socioeconomic systems), as well as process-based sectoral models (those with detailed representations of changes in a single sector), enable impact projections with increased regional specificity, which across the modeling frameworks shown in Table 29.1 reveal complex spatial patterns of impacts for many sectors. For example, this spatial variability is consistently observed in the agriculture sector,2,5,96,97 where the large number of domestic crops and growing regions respond to changes in climate and atmospheric CO2 concentrations in differing ways. As such, the benefits of mitigation for agriculture can vary substantially across regions of the United States and summing regional results into national estimates can obscure important effects at the local level.

Key Message 4

Interactions Between Mitigation and Adaptation

Interactions between mitigation and adaptation are complex and can lead to benefits, but they also have the potential for adverse consequences. Adaptation can complement mitigation to substantially reduce exposure and vulnerability to climate change in some sectors. This complementarity is especially important given that a certain degree of climate change due to past and present emissions is unavoidable.

The reduction of climate change risk due to mitigation also depends on assumptions about how adaptation changes the exposure and vulnerability of the population (Ch. 28: Adaptation). For example, recent studies have found that adaptation can substantially reduce climate damages in a number of sectors in both the higher (RCP8.5) and lower (RCP4.5) scenarios.2,5 Damages to infrastructure, such as road and rail networks, are particularly sensitive to adaptation assumptions, with proactive measures (such as planned maintenance and repairs that account for future climate risks) estimated to be able to reduce damages by large fractions. More than half of damages to coastal property are estimated to be avoidable through well-timed adaptation measures, such as shoreline protection and beach replenishment.2,5,196 In the health sector, accounting for possible physiological adaptation (acclimatization) to higher temperatures and for increased air conditioning use reduced estimated mortality by half,2,5 a finding supported by other analyses of mortality from extreme heat.99,100 However, adaptation can require large up-front costs and long-term commitments for maintenance (Ch. 28: Adaptation), and uncertainty exists in some sectors regarding the applicability and effectiveness of adaptation in reducing risk.101

Broadly, quantifying the potential effect of adaptation on impacts remains a research challenge (see the “Direction for Future Research” section)(see also Ch. 17: Complex Systems).102 Because society is already committed to a certain amount of future climate change due to past and present emissions and because mitigation activities cannot avoid all climate-related risks, mitigation and adaptation activities can be considered complementary strategies.196,103,104,105

Adaptation and mitigation strategies can also interact, with the potential for benefits and/or adverse consequences.106 An iterative risk-management approach for assessing and modifying these strategies as experience is gained can be advantageous (Ch. 28: Adaptation). Benefits occur when mitigation strategies make adaptation easier (or vice versa). For example, by reducing climate change and its subsequent effects on the water cycle, mitigation has been projected to reduce water shortages in most river basins of the United States, making adaptation to hydrologic impacts more manageable.107 Also, carbon sequestration through reforestation and/or other protective measures can promote forest ecosystem services (including reduced flood risk), provide habitat for otherwise vulnerable species, or abate urban heat islands. Carbon sequestration measures in agriculture can reduce erosion and runoff, reducing vulnerability to extreme precipitation. Agricultural adaptation strategies that increase yields (such as altering crop varieties, irrigation practices, and fertilizer application), particularly in already high-yielding regions including North America, can have mitigation benefits (Ch. 10: Ag & Rural).108 First, higher productivity lessens the need for clearing new land for production, thereby reducing associated emissions.109 Second, these strategies counteract yield losses due to climate change,2,110,111 which could enhance the ability to produce bioenergy crops or make additional land available for carbon sequestration.

In buildings and industrial facilities, adaptation measures such as investments in energy efficiency (for example, through efficient building materials) would reduce building energy demand (and therefore emissions), as well as lessen the impacts of extreme heat events.112,113

Adaptation and mitigation can also interact negatively. For example, if mitigation strategies include large-scale use of bioenergy crops to produce low-carbon energy, higher irrigation demand can lead to an increase in water stress that more than offsets the benefits of lessened climate change.114 Similarly, mitigation approaches such as afforestation (the establishment of a forest where no previous tree cover existed) and concentrated solar power would increase demand for water and land.115 Likewise, some adaptation measures such as irrigation, desalination, and air conditioning are energy intensive and would lead to increased emissions or create greater demands for clean energy. Higher air conditioning demands are projected to increase annual average and peak demands for electricity, putting added stress on an electrical grid that is already vulnerable to the effects of climate change (Ch. 4: Energy, KM 1).2,116,117 Meeting these higher demands becomes more challenging as higher temperatures reduce the peak capacity of thermal generation technologies and lower peak transmission capacity.118 In addition, complications are expected to arise when climate change impacts occur simultaneously and undermine adaptation measures, such as when a severe storm disrupts power over an extended time of intense heat, which can nullify the benefits of air conditioning adaptation.

Box 29.2: Co-Effects of Mitigation Actions

Recent scientific studies suggest that considering the indirect effects of mitigation can significantly reduce or eliminate the potential costs associated with cutting GHG emissions. This is due to the presence of co-benefits, often immediate, associated with emissions reductions, such as improving air quality and public health. There is now a large body of scientific literature evaluating 1) the health co-benefits of mitigation actions,5,119,120,121,122,123,124,125 2) improvement to crop yields,126,127 and 3) a reduction in the probability of occurrence of extreme weather and climate-related events over the next decades that would otherwise occur with unabated emissions.29 In transportation, for example, switching away from petroleum to potentially lower GHG fuels, such as electricity and hydrogen, is projected to reduce local air pollution. In California, drastic GHG emissions reductions have been estimated to substantially improve air quality and reduce local particulate matter emissions associated with freight transport that disproportionately impact disadvantaged communities.128,129 Decarbonization of the energy system is also expected to increase energy security by increasing reliance on sources of energy that are produced domestically.130,131

At the same time, mitigation actions can have potential adverse effects, such as impacts to the cost of food and biodiversity loss due to the increased use of energy from biomass.132,133 For this reason, it is more appropriate to use the term co-effects to refer to both benefits and costs associated with efforts to reduce GHG emissions.123 The co-effects of investments in GHG emissions reductions generally occur in the near term, whereas the benefits of reducing GHG emissions will likely be mostly realized over longer timescales.

Box 29.3: Reducing Risk Through Climate Intervention

Climate intervention techniques (or geoengineering) are aimed at limiting global or regional temperature increase by affecting net radiative forcing through means other than emissions reductions (for a more detailed discussion see DeAngelo et al. 20179). There are two broad categories of climate intervention techniques. One is carbon dioxide removal (CDR), which would reduce atmospheric CO2 concentrations by changing land-use and management practices to store carbon in plants, trees, and soils; increasing ocean carbon storage through biological or chemical means; capturing atmospheric CO2 through engineered chemical reactions and storing it in geologic reservoirs; or converting terrestrial biomass into energy while capturing and storing the CO2.16 The second is solar radiation management (SRM), which would increase Earth’s regional and/or global reflectivity by, for example, injecting sulfur gases or other substances into the stratosphere or brightening marine clouds. CDR is estimated to have long implementation times, and while costs (and their uncertainties) range widely across different measures,134 it is estimated to be expensive at scale.10 Nonetheless, large-scale CDR can be competitive with more traditional GHG mitigation options when substantial mitigation is required, and therefore it is an element of many scenarios that feature deep emissions reductions or negative emissions. Its climate benefits are likely to be similar to those from emissions reductions since both strategies act through reduced atmospheric concentrations of GHGs. Studies point to the risks of reaching the limits of available land, water, or biogeochemical requirements of biomass-based approaches at scale sufficient to offset large emissions.13,16,99,135,136 In contrast to CDR, SRM strategies are estimated to be relatively inexpensive and realize climate benefits within a few years. They could be targeted at regional as well as global temperature modification137 and could be combined with mitigation to limit the rate or the peak magnitude of warming. However, SRM effects on other outcomes, including precipitation patterns, light availability, and atmospheric circulation, are less well understood. In addition, SRM would not reduce risks from increasing atmospheric CO2 concentrations such as ocean acidification.138,139 Moreover, a sudden cessation of large-scale SRM activities could lead to very rapid climate changes, although a gradual phaseout of SRM as emissions reductions and CDR are phased in could avoid these abrupt changes. As concluded in Chapter 14 of the Climate Science Special Report, “Further assessments of the technical feasibilities, costs, risks, co-benefits, and governance challenges of climate intervention or geoengineering strategies, which are as-yet unproven at scale, are a necessary step before judgments about the benefits and risks of these approaches can be made with high confidence.”9

Direction for Future Research

Coordinated Impacts Modeling Analyses

Multisector impacts modeling frameworks can systematically address specific mitigation and adaptation research needs of the users of the National Climate Assessment. Improved coordination amongst multidisciplinary impact modeling teams could be very effective in informing future climate assessments.

The recent multisector impacts modeling frameworks described above have demonstrated several key advantages for producing policy-relevant information regarding the potential for mitigation to reduce climate change impacts. First, the use of internally consistent scenarios and assumptions in quantifying a broad range of impacts produces comparable estimates across sectors, regions, and time. Second, these frameworks can simulate specific mitigation and adaptation scenarios to investigate the multisector effectiveness of these actions in reducing risk over time. Third, these frameworks can be designed to systematically account for key dimensions of uncertainty along the causal chain—a difficult task when assessing uncoordinated studies from the literature, each with its own choices of scenarios and assumptions.

Advancements to Address Research Needs from the Third National Climate Assessment

While not an exact analog to this chapter, the Third National Climate Assessment (NCA3)140 included a Research Needs chapter as part of the Response Strategies section that recommended five research goals: 1) improve understanding of the climate system and its drivers, 2) improve understanding of climate impacts and vulnerability, 3) increase understanding of adaptation pathways, 4) identify the mitigation options that reduce the risk of longer-term climate change, and 5) improve decision support and integrated assessment.141 Several of these topics have seen substantial advancements since publication of NCA3, informing our understanding of avoided climate risks. For example, research findings related to climate system drivers and the characterization of uncertainty have helped to differentiate the physical and economic outcomes along alternative mitigation pathways.3,20,30 Enormous growth in impacts, adaptation, and vulnerability (IAV) research has enabled more robust quantification of the relative impacts (avoided damages) corresponding to different climate outcomes. However, challenges remain in accounting for the reduced risks and impacts associated with nonlinearities in the climate system, including tipping points such as destabilization of the West Antarctic ice sheet or rapid methane release from thawing permafrost.22,98,142,143 Mitigation options continue to be studied to better understand their potential role in meeting different climate targets, and while many low-emitting or renewable technologies have seen rapid penetration, other strategies involving negative-emissions technologies have prompted caution due to the challenges of achieving widespread deployment at low cost. Adaptation pathways are better understood but continue to be a source of uncertainty related to understanding climate risk and local adaptation decision-making processes. Decision support for climate risk management, especially under uncertainty, is an area of active research,144,145 and despite the limitations of integrated assessment models,146,147 they offer useful insights for decision-makers.148

Remaining Knowledge Gaps

Despite ongoing progress, this assessment finds that significant knowledge gaps remain in many of the research goals and foundational crosscutting capabilities identified in NCA3. Going forward, it will be critically important to reduce uncertainties under different mitigation scenarios in 1) avoided sectoral impacts, such as agriculture and health, and 2) the capacity for adaptation to reduce impacts. Gaps in information on social vulnerability and exposure continue to hamper progress on disaster risk reduction associated with climate impacts.51 Directions for future research in the climate science and impacts field include improved understanding of the avoided/increased risk of thresholds, tipping points, or irreversible outcomes (see Kopp et al. 201722). Specific examples deserving further study include marine ice sheet instability and transformation of specific terrestrial carbon sinks into sources of greenhouse gas emissions.149,150

Gaps remain in quantifying combined impacts and natural feedbacks. For example, coral reef health includes combined stress/relief from changes in local activities (for example, agricultural and other nutrient runoff and fishery management), ocean acidification, ocean temperature, and the ability of coral species to adapt to changing conditions or repeated extreme events.151,152 Additional knowledge gaps include an understanding of how mitigation and adaptation actions affect climate outcomes due to interactions in the coupled human–earth system.142,153

Interdisciplinary collaboration can play a critical role in addressing these knowledge gaps (such as coordinating a research plan across physical, natural, and social sciences).52,154 Combining advances in scientific understanding of the climate system with scenarios to explore socioeconomic responses is expected to lead to an improved understanding of the coupled human–earth system that can better support effective adaptation and mitigation responses. Barriers to implementation arise from data limits (for example, the need for long-term observational records), as well as computational limits that increase model uncertainties.53

TRACEABLE ACCOUNTS

Process Description

The scope for this chapter was determined by the federal Fourth National Climate Assessment (NCA4) Steering Committee, which is made up of representatives from the U.S. Global Change Research Program (USGCRP) member agencies (see App. 1: Process for more information regarding the Steering Committee). The scope was also informed by research needs identified in the Third National Climate Assessment (NCA3) and in subsequent gap analyses.155 Prospective authors were nominated by their respective agency, university, organization, or peers. All prospective authors were interviewed with respect to their qualifications and expertise. Authors were selected to represent the diverse perspectives relevant to mitigation, with the final team providing perspectives from federal and state agencies, nonfederal climate research organizations, and the private sector. The author team sought public input on the chapter scope and outline through a webinar and during presentations at conferences and workshops.

The chapter was developed through technical discussions of relevant evidence and expert deliberation by the report authors during extensive teleconferences, workshops, and email exchanges. These discussions were informed by the results of a comprehensive literature review, including the research focused on estimating the avoided or reduced risks of climate change. The authors considered inputs submitted by the public, stakeholders, and federal agencies and improved the chapter based on rounds of review by the public, National Academies of Sciences, Engineering, and Medicine, and federal agencies. The author team also engaged in targeted consultations during multiple exchanges with contributing authors from other chapters of this assessment, as well as authors of the Climate Science Special Report (CSSR). For additional information on the overall report process, see Appendix 1: Process.


KEY MESSAGES

1 2 3 4

Key Message 1: Mitigation-Related Activities Within the United States

Mitigation-related activities are taking place across the United States at the federal, state, and local levels as well as in the private sector (very high confidence). Since the Third National Climate Assessment, a growing number of states, cities, and businesses have pursued or deepened initiatives aimed at reducing emissions (very high confidence).

Description of evidence base

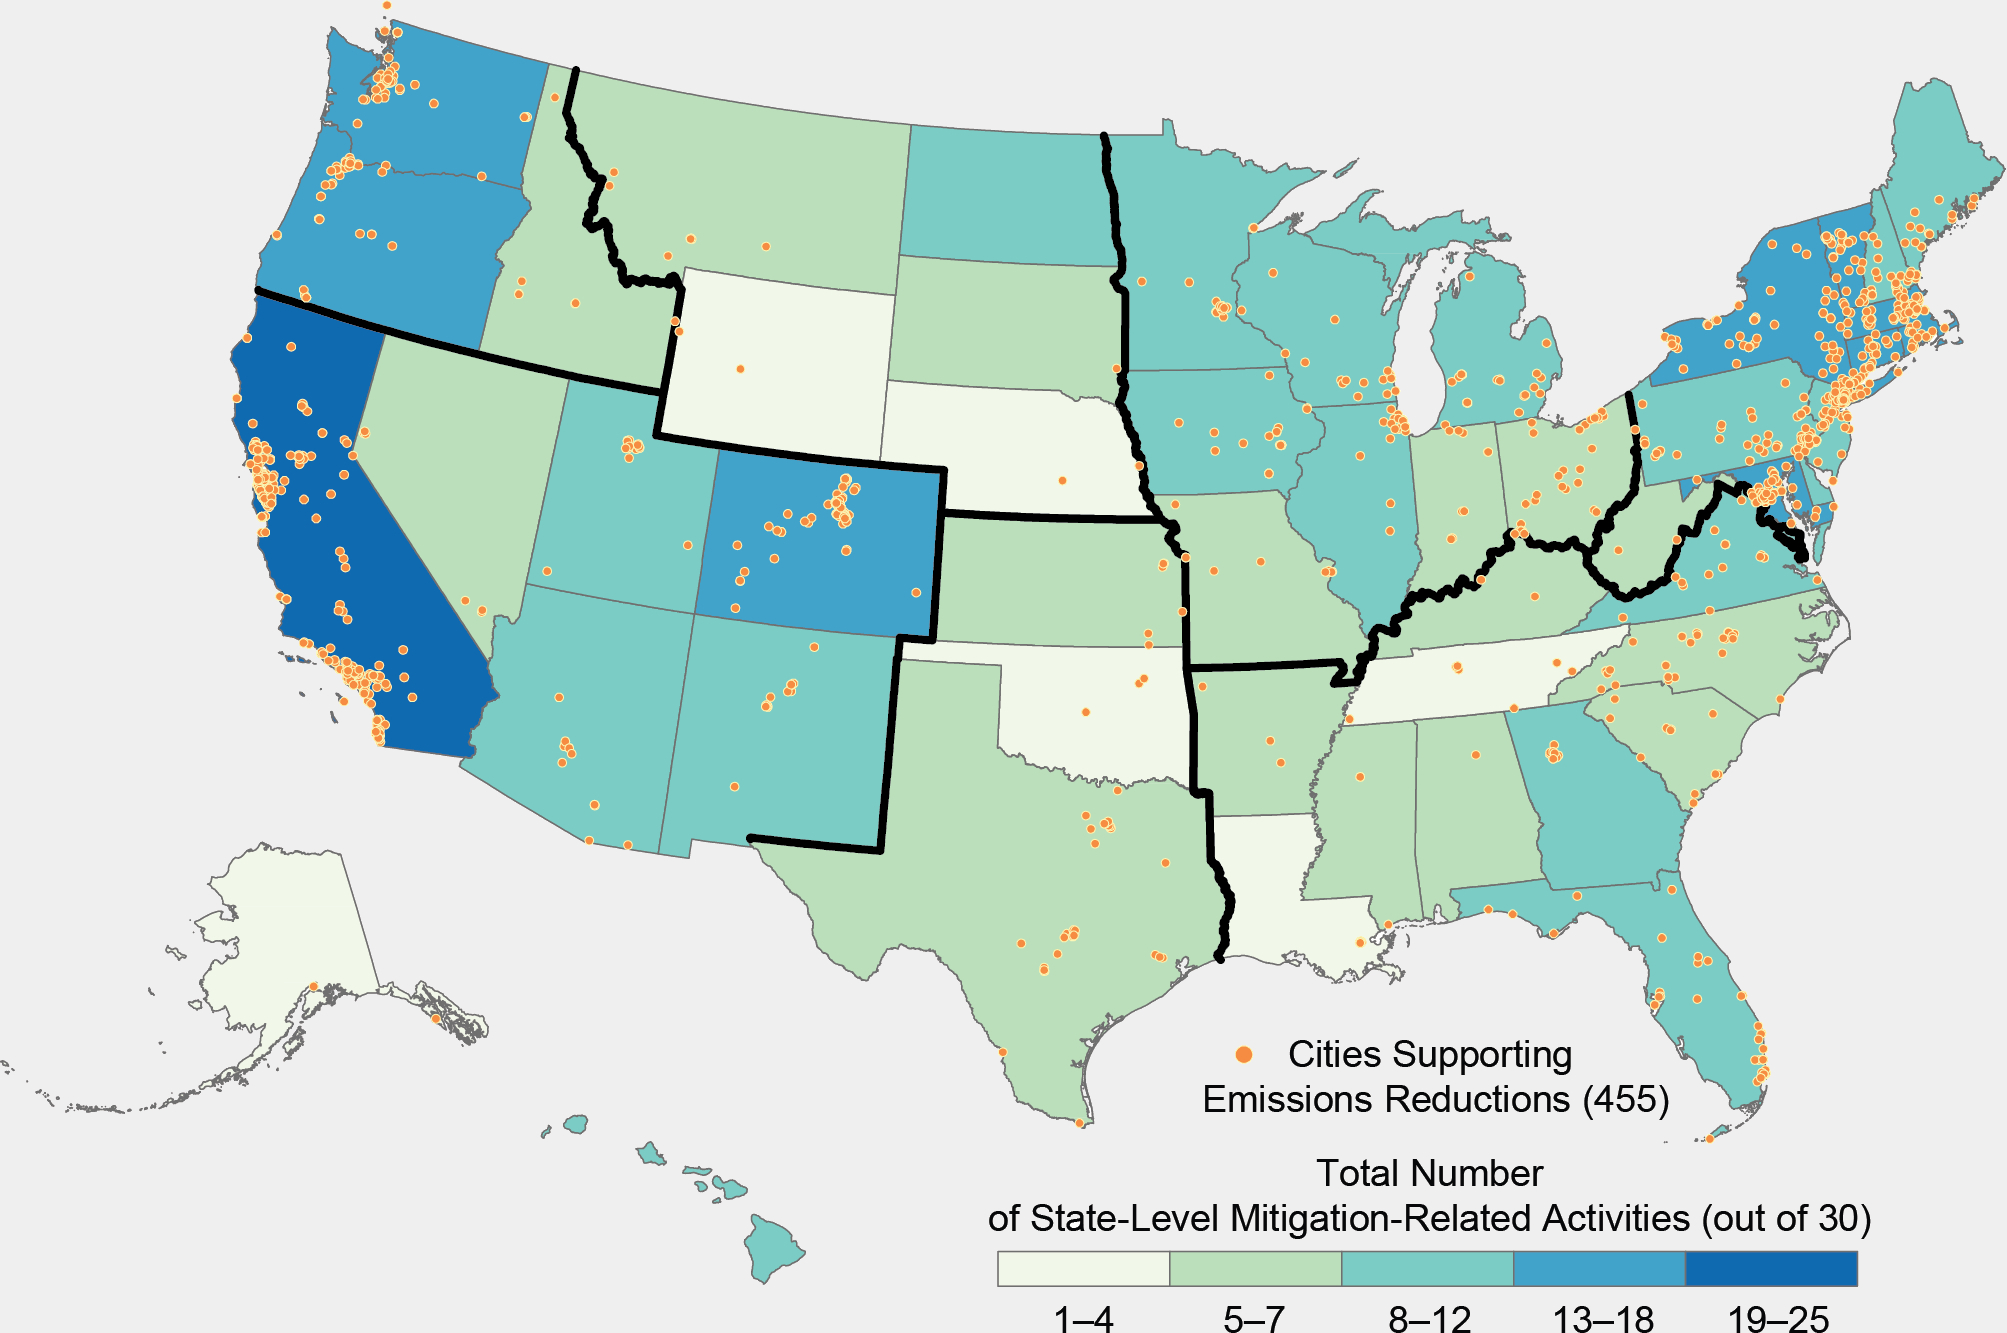
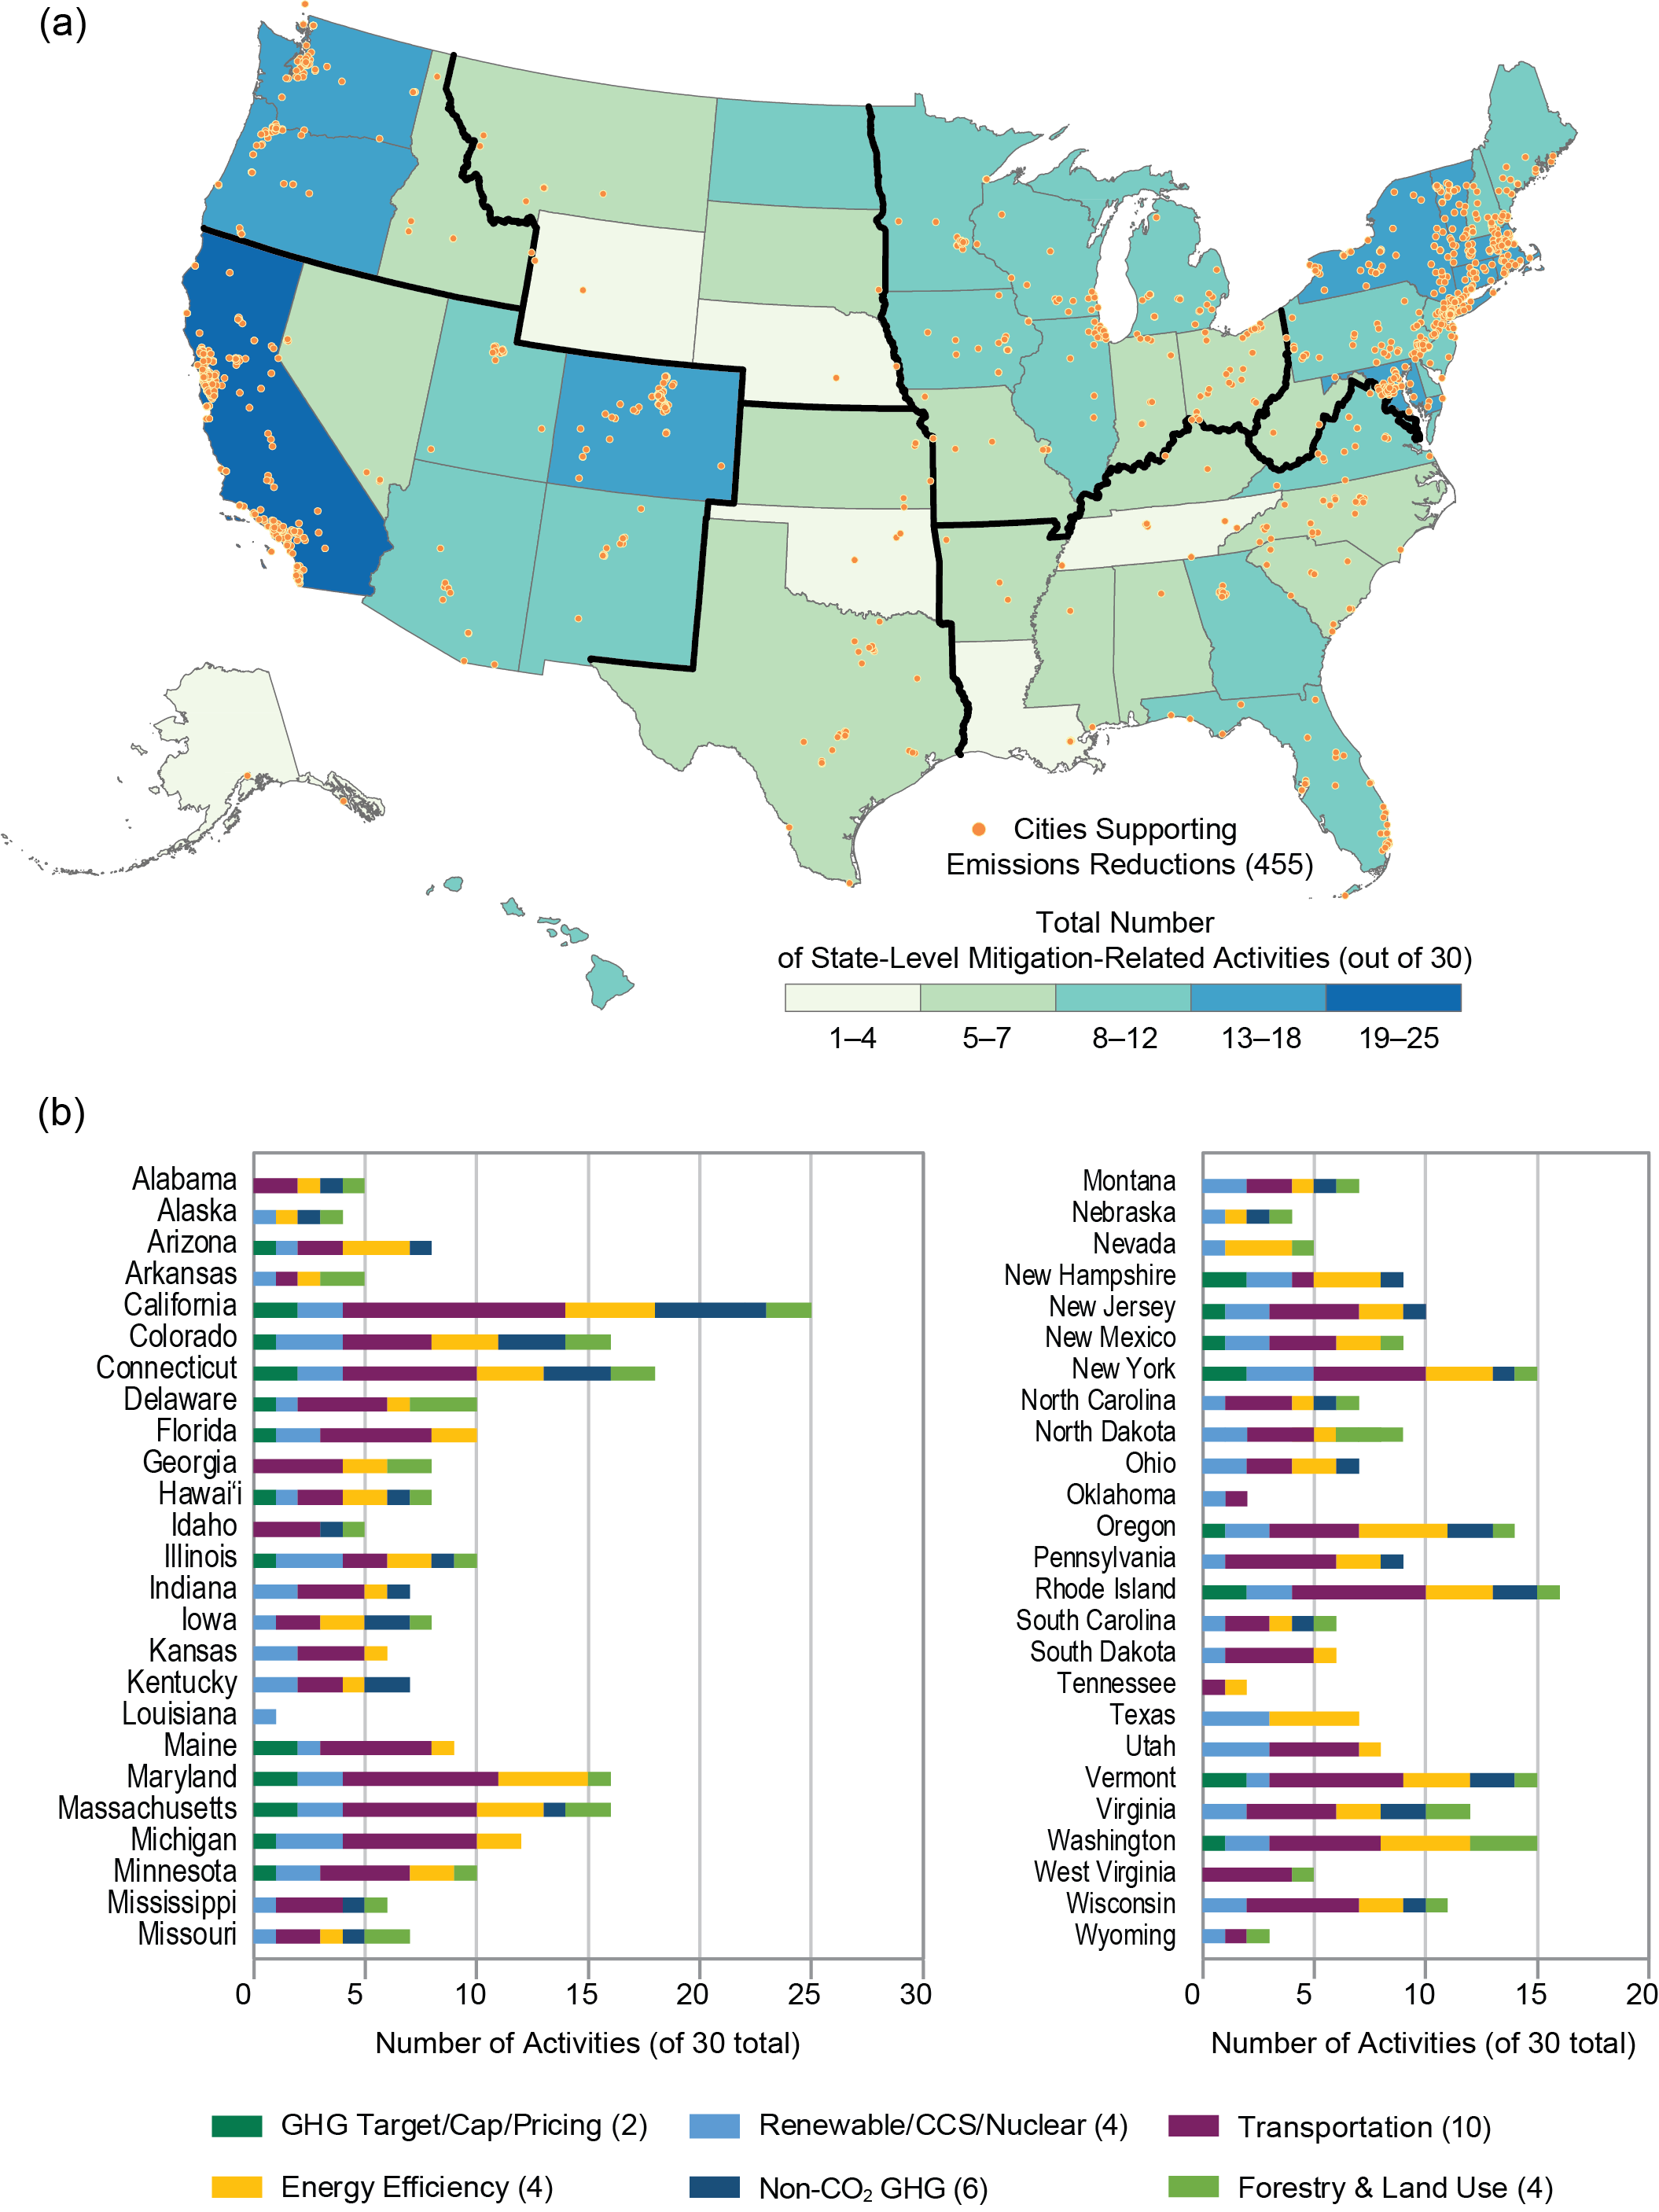
Since NCA3, state, local, and tribal entities have announced new or enhanced efforts to reduce greenhouse gas (GHG) emissions. While some policies with emissions co-benefits have been eliminated, on net there has been an increase in initiatives aimed at reducing emissions. Figure 29.1 includes several types of state-level efforts and is sourced from Figure ES-3 of the America’s Pledge Phase 1 report, the most comprehensive listing of efforts across sectors currently available. The underlying state information is sourced from the U.S. Department of Energy, Appliance Standards Awareness Project, Open Energy Information, Rethink Food Waste Through Economics and Data, World Resources Institute, State of New York, California Air Resources Board, University of Minnesota, Land Trust Alliance, and the U.S. Forest Service.

U.S. state and local carbon pricing programs have increased in number since NCA3.156 The Regional Greenhouse Gas Initiative has expanded the depth of emissions reductions activities and is considering adding transportation to their scope. California’s cap and trade program started in 2012 and expanded by linking to Quebec and Ontario in 2017. Emissions trading systems are scheduled in Massachusetts and under consideration in Virginia.156

U.S. states have both mandatory and voluntary programs that vary in stringency and impact. For example, 29 states, Washington, DC, and 3 territories have Renewable Portfolio Standards (RPS; https://energy.gov/eere/slsc/renewable-portfolio-standards-resources), which require some portion of electricity to be sourced from renewable energy; while 8 states and 1 territory have voluntary renewable portfolio goals.42,45 Likewise, 20 states have mandatory statewide Energy Efficiency Resource Standards (EERS; https://energy.gov/eere/slsc/energy-efficiency-resource-standards-resources), and 8 states have energy efficiency goals.42 While the number of states with RPS and EERS policies remains similar to that during NCA3, emissions reductions associated with the impact of these policies have and are projected to increase.157 In 2013, 8 states initiated an effort to coordinate implementation of their state zero-emission vehicle programs and have since taken a wide range of actions.158

Federal budget levels for activities that have reduced GHG have remained steady over recent years. There is uncertainty around the implementation of federal initiatives, in part owing to the implementation of Executive Order 13783.40,159 Federal energy-related research and development have several co-benefits, including reduced emissions.15

U.S. companies that report through the Carbon Disclosure Project increasingly (although not comprehensively) reported board-level oversight on climate issues, which rose from 50% in 2011 to 71% in 2017. Likewise, 59 U.S. companies recently committed to set science-based emissions reduction targets.46 U.S. businesses are increasingly pricing carbon.46,160 Corporate procurement of utility-scale solar has grown by an order of magnitude since 2014.47

As indicated in the Education Institutions Reporting Database, a growing number of universities have made emissions reduction commitments or deepened existing commitments161 as well as publicized the progress on their efforts.162

Major uncertainties

Figure 29.1 shows a count of each type of 30 measures across 6 categories, but it does not explore the relative stringency or emissions impact of the measures. The size, scope, time frame, and enforceability of the measures vary across states. Some state efforts and the majority of city efforts are voluntary, and therefore standards for reporting are heterogeneous. Efforts are underway to provide a rigorous accounting of the cumulative scale of these initiatives. Data collection through the America’s Pledge effort is an ongoing, iterative process and, by necessity, involves aggregating different measures into categories. Historically, state, local, and corporate policies change on different cycles.

Description of confidence and likelihood

There is very high confidence that state, local, and private entities are increasingly taking, or are committed to taking, GHG mitigation action. Public statements and collated indices show an upward trend in the number of commitments, as well as the breadth and depth of commitments over the past five years.

Key Message 2: The Risks of Inaction

In the absence of more significant global mitigation efforts, climate change is projected to impose substantial damages on the U.S. economy, human health, and the environment (very high confidence). Under scenarios with high emissions and limited or no adaptation, annual losses in some sectors are estimated to grow to hundreds of billions of dollars by the end of the century (high confidence). It is very likely that some physical and ecological impacts will be irreversible for thousands of years, while others will be permanent (very high confidence).

Description of evidence base

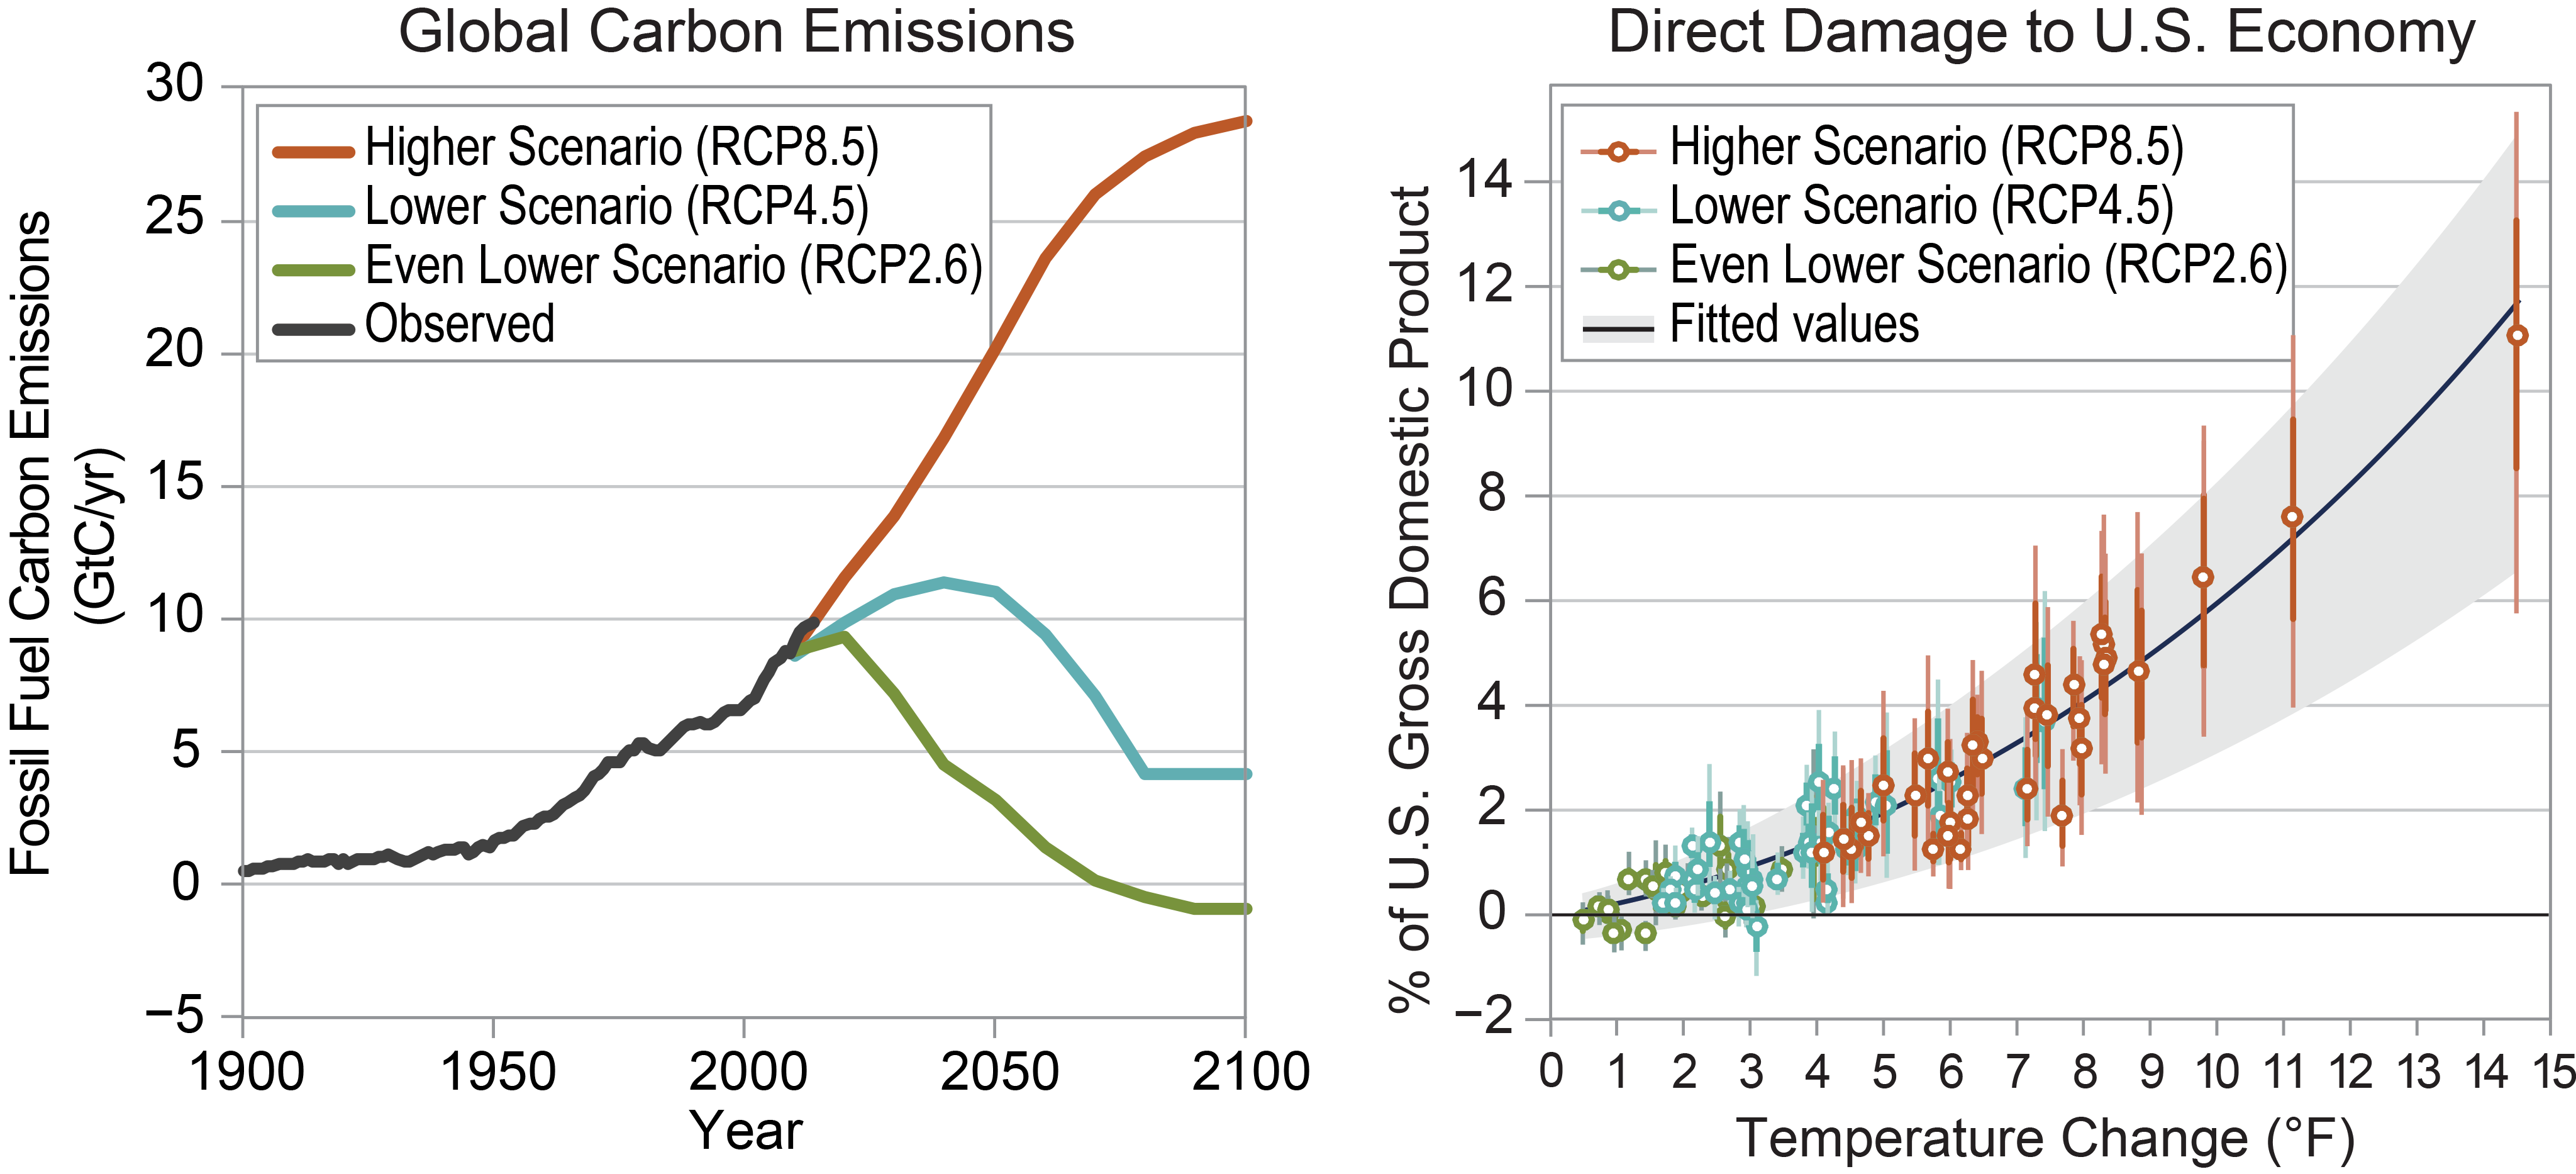
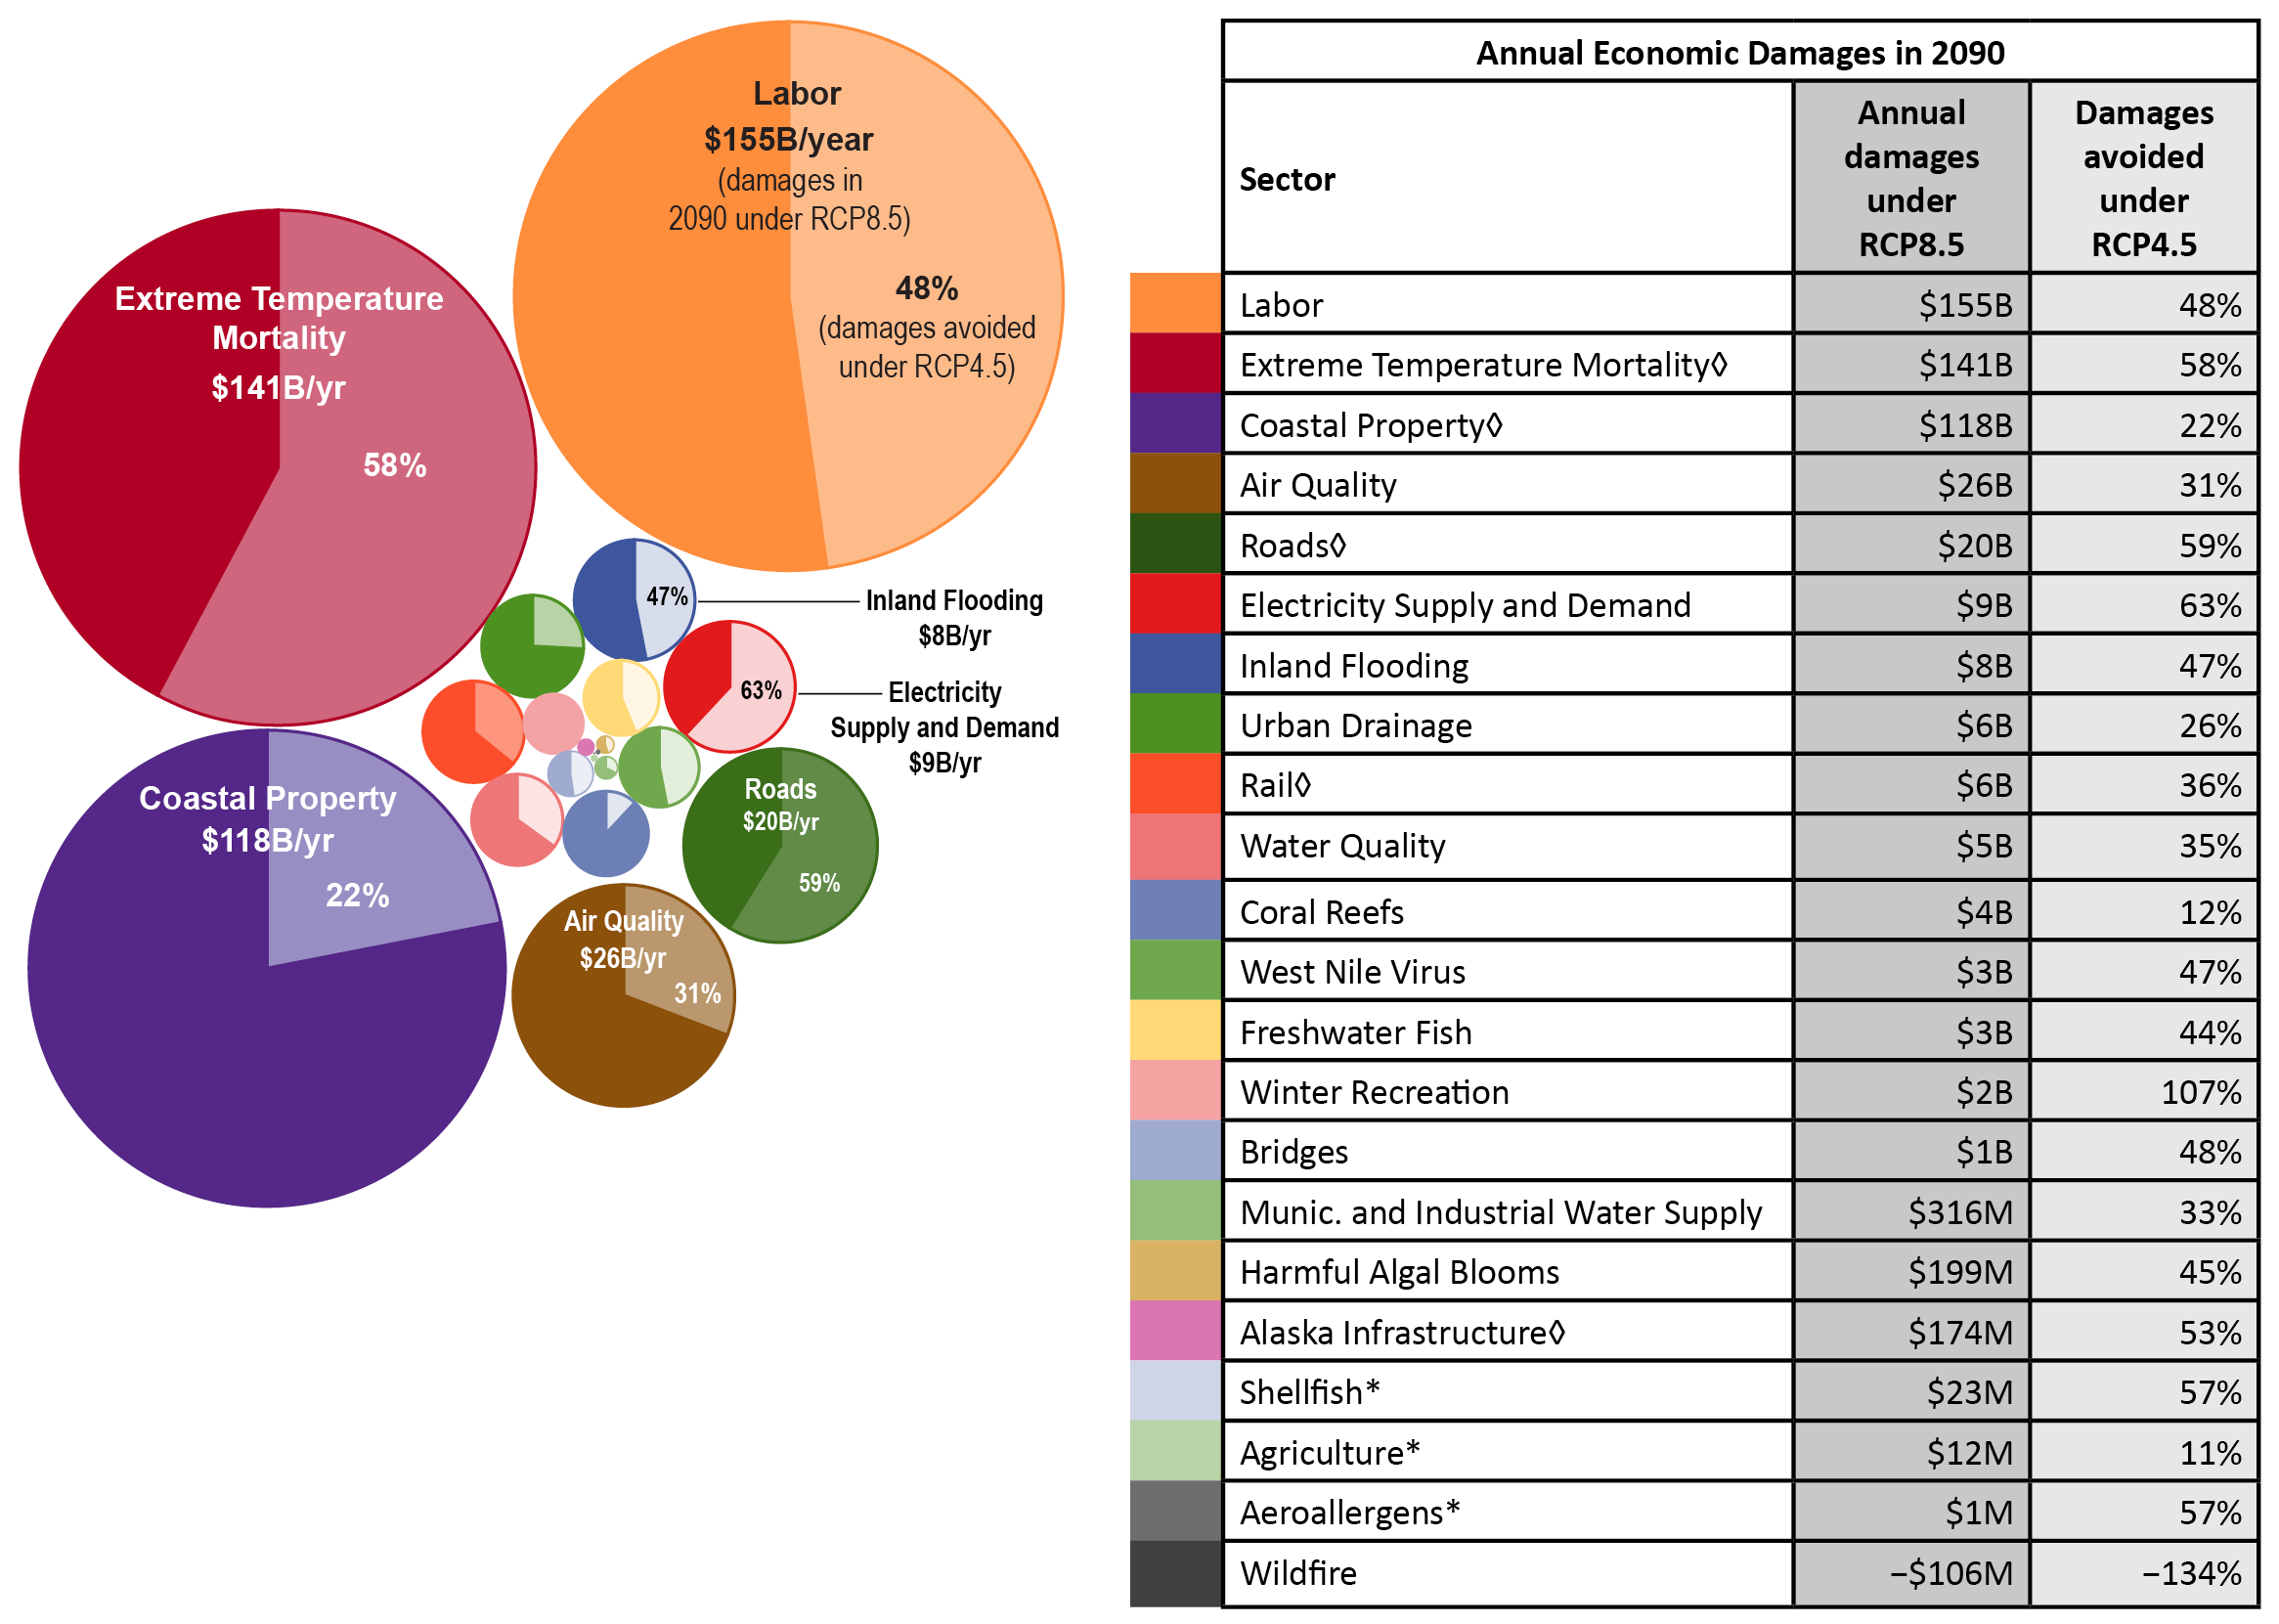
Recent scientific and economic advances are improving the ability to understand and quantify the physical and economic impacts of climate change in the United States, including how those risks can be avoided or reduced through large-scale GHG mitigation. While the projected impacts of climate change across sectors and regions are well documented throughout this assessment, several multisector modeling projects are enabling the comparison of effects through the use of consistent scenarios and assumptions.2,3,4,5 A well-recognized conclusion from the literature produced by these projects is that climate change is projected to adversely affect the U.S. economy, human health, and the environment, each of which is further detailed below. These estimated damages increase over time, especially under a higher scenario (RCP8.5). For sectors where positive effects are observed in some regions or for specific time periods (for example, reduced mortality from extreme cold temperatures or beneficial effects on crop yields), the effects are typically dwarfed by changes happening overall within the sector or at broader scales (for example, comparatively larger increases in mortality from extreme heat or many more crops experiencing adverse effects).2,3,4,5 In Figure 29.2, wildfire is the only sector showing positive effects, a result driven in this particular study by projected shifts to vegetation with longer fire return intervals.2 However, it is important to note that the analysis underlying this result did not quantify the broader economic effects associated with these vegetative shifts, including ecosystem disruption and changes to ecosystem services. See Chapter 6: Forests for a discussion on the weight of evidence regarding projections of future wildfire activity, which generally show increases in annual area burned over time. See Chapter 25: Southwest for a discussion on aridification toward the end of this century under high emissions.

There is robust and consistent evidence that climate change is projected to adversely affect many components of the U.S. economy. Increasing temperatures, sea level rise, and changes in extreme events are projected to affect the built environment, including roads, bridges, railways, and coastal development. For example, coastal high tide flooding is projected to significantly increase the hours of delay for vehicles.163 Annual damages to coastal property from sea level rise and storm surge, assuming no adaptation, are projected to range in the tens to hundreds of billions of dollars by the end of the century under RCP8.5 (Ch. 8: Coastal).2,5 Projected annual repair costs in order for roads, bridges, and railways to maintain levels of service in light of climate change range in the billions to tens of billions of dollars under RCP8.5.2,164 Numerous studies suggest that regional economies can also be at risk, especially when they are tied to environmental resources or ecosystem services that are particularly vulnerable to climate change. For example, projected declines in coral reef-based recreation152,165,166 would lead to decreases in tourism revenue; shorter seasons for winter recreation would likely lead to the closure of ski areas and resorts;167,168,169,170 and increased risks of harmful algal blooms can limit reservoir recreation (Ch. 3: Water).171,172

An increasing body of literature indicates that impacts to human health are likely to have some of the largest effects on the economy. Studies consistently indicate that climate-driven changes to morbidity and mortality can be substantial.72,100,173,174,175,176 In some sectors, the value of health damages is estimated to reach hundreds of billions of dollars per year under RCP8.5 by the end of the century. A large fraction of total health damages is due to mortality, quantified using the Value of a Statistical Life (VSL) approach based on standard VSL values used in federal government regulatory analysis.177 For example, annual damages associated with extreme temperature-related deaths are estimated at $140 billion by the end of the century under RCP8.5, while lost wages from extreme temperatures, especially for outdoor industries, are projected at $160 billion per year by 2090.2 Adaptive actions, including physiological adaptation and increased availability of air conditioning, are projected to reduce extreme temperature mortality by approximately half; however, the implementation costs of those adaptations were not estimated. Although less studied compared to the research on the direct effects of temperature on health, climate-driven impacts to air quality72,178 and aeroallergens173,179 are also projected to have large economic effects, due to increases in medical expenditures (such as emergency room visits) and premature mortality (Ch. 13: Air Quality).

Multiple lines of research have also shown that some climate change impacts will very likely be irreversible for thousands of years. For some species, the rate and magnitude of climate change projected for the 21st century is projected to increase the risk of extinction or extirpation (local-scale extinction) from the United States.180,181,182,183 Coral reefs, coldwater fish, and high-elevation species are particularly vulnerable (Ch. 9: Oceans; Ch. 7: Ecosystems). The rapid and widespread climate changes occurring in the Arctic and Antarctic are leading to the loss of mountain glaciers and shrinking continental ice sheets.69,184 The contribution of this land ice volume to the rate of global sea level rise is projected to affect U.S. coastlines for centuries (Ch. 8: Coastal).19,30,185

Major uncertainties

This Key Message reflects consideration of the findings of several recent multisector modeling projects (e.g., Hsiang et al. 2017, O’Neill et al. 2017, EPA 2017, Houser et al. 2015)2,3,4,5 released since NCA3. Despite these improvements to quantify the physical and economic impacts of climate change across sectors, uncertainty exists regarding the ultimate timing and magnitude of changes, particularly at local to regional scales. The sources of uncertainty vary by sector and the modeling approaches applied. Each approach also varies in its capacity to measure the ability of adaptation to reduce vulnerability, exposure, and risk. While the coverage of impacts has improved with recent advancements in the science, many important climate change effects remain unstudied, as do the interactions between sectors (Ch. 17: Complex Systems).85 Finally, as climate conditions pass further outside the natural variability experienced over past several millennia, the odds of crossing thresholds or tipping points (such as the loss of Arctic summer sea ice) increase, though these thresholds are not well represented in current models.22,142

Description of confidence and likelihood

There is very high confidence that climate change is projected to substantially affect American livelihoods and well-being in the future compared to a future without climate change. The evidence supporting this conclusion is based on agreement across a large number of studies analyzing impacts across a multitude of sectors, scenarios, and regions. The literature clearly indicates that the adverse impacts of climate change are projected to substantially outweigh the positive effects. Although important uncertainties exist that affect our understanding of the timing and magnitude of some impacts, there is very high confidence that some effects will very likely lead to changes that are irreversible on human timescales.

Key Message 3: Avoided or Reduced Impacts Due to Mitigation

Many climate change impacts and associated economic damages in the United States can be substantially reduced over the course of the 21st century through global-scale reductions in greenhouse gas emissions, though the magnitude and timing of avoided risks vary by sector and region (very high confidence). The effect of near-term emissions mitigation on reducing risks is expected to become apparent by mid-century and grow substantially thereafter (very high confidence).

Description of evidence base

There are multiple lines of research and literature available to characterize the effect of large-scale GHG mitigation in avoiding or reducing the long-term risks of climate change in the United States. Recent multisector impacts modeling projects, all of which feature consistent sets of scenarios and assumptions across analyses, provide improved capabilities to compare impacts across sectors and regions, including the effect of global GHG mitigation in avoiding or reducing risks.2,3,4,5 The results of these coordinated modeling projects consistently show reductions in impacts across sectors due to large-scale mitigation. For most sectors, this effect of mitigation typically becomes clear by mid-century and increases substantially in magnitude thereafter. In some sectors, mitigation can provide large benefits. For example, by the end of the century, reduced climate change under a lower scenario (RCP4.5) compared to a higher one (RCP8.5) avoids (on net, and absent additional risk reduction through adaptation) thousands to tens of thousands of deaths per year from extreme temperatures,2,5 hundreds to thousands of deaths per year from poor air quality,2,72 and the loss of hundreds of millions of labor hours.2,3,5

Beyond these multisector modeling projects, an extensive literature of sector-specific studies compares impacts in the United States under alternative scenarios. A careful review of these studies, especially those published since the Third National Climate Assessment, finds strong and consistent support for the conclusion that global GHG mitigation can avoid or reduce the long-term risks of climate change in the United States. For example, mitigation is projected to reduce the risk of adverse impacts associated with extreme weather events,29,186 temperature-related health effects,99,100,175 agricultural yields,187,188,189 and wildfires.73,190,191

The finding that the magnitude and timing of avoided risks vary by sector and region, as well as due to changes in socioeconomics and adaptive capacity, is consistently supported by the broad literature base of multisector analyses (e.g., Hsiang et al. 2017, O’Neill et al. 2017, EPA 2017, Houser et al. 20152,3,4,5) and focused sector studies (e.g., Melvin et al. 2016, Neumann et al. 201471,77). Complex spatial patterns of avoided risks are commonly observed across sectors, including for human health effects (e.g., Fann et al. 2015, Sarofim et al. 2016100,178), agriculture (e.g., Beach et al. 2015192), and water resources (e.g., Chapra et al. 2017, Wobus et al. 2017, EPA 2013167,171,193).

The weight of evidence among studies in the literature indicates that the difference in climate impact outcomes between different scenarios is more modest through the first half of the century,2,4,5,9 as the human-forced response may not yet have emerged from the noise of natural climate variability.6 In evaluating and quantifying multisector impacts across alternative scenarios, the literature generally shows that the effect of near-term mitigation in avoiding damages increases substantially in magnitude after 2050.2,4,5 For example, mitigation under RCP4.5 is projected to reduce the number of premature deaths and lost labor hours from extreme temperatures by 24% and 21% (respectively) by 2050, and 58% and 48% by 2090.2 For coastal impacts, where inertia in the climate system leads to smaller differences in rates of sea level rise across scenarios, the effects of near-term mitigation only become evident toward the end of the century (Ch. 8: Coastal).2,5,19

Major uncertainties

Quantifying the multisector impacts of climate change involves a number of analytic steps, each of which has its own potential sources of uncertainty. The timing and magnitude of projected future climate change are uncertain due to the ambiguity introduced by human choices, natural variability, and scientific uncertainty, which includes uncertainty in both scientific modeling and climate sensitivity. One of the most prominent sources involves the projection of climate change at a regional level, which can vary based on assumptions about climate sensitivity, natural variability, and the use of any one particular climate model. Advancements in the ability of climate models to resolve key aspects of atmospheric circulation, improved statistical and dynamic downscaling procedures, and the use of multiple ensemble members in impact analyses have all increased the robustness of potential climate changes that drive impact estimates described in the recent literature. However, key uncertainties and challenges remain, including the structural differences between sectoral impact models, the ability to simulate future impacts at fine spatial and temporal resolutions, and insufficient approaches to quantify the economic value of changes in nonmarket goods and services.85 In addition, the literature on economic damages of climate change in the United States is incomplete in coverage, and additional research is needed to better reflect future socioeconomic change, including the ability of adaptation to reduce risk.

Description of confidence and likelihood

There is very high confidence that large-scale reductions in GHG emissions throughout the 21st century are projected to reduce the level of climate change projected to occur in the United States, along with the adverse impacts affecting human health and the environment. Across the literature, there are limited instances where mitigation, compared to a higher emissions scenario, does not provide a net beneficial outcome for the United States. While the content of this chapter is primarily focused on the 21st century, confidence in the ability of mitigation to avoid or reduce impacts improves when considering impacts beyond 2100.

Key Message 4: Interactions Between Mitigation and Adaptation

Interactions between mitigation and adaptation are complex and can lead to benefits, but they also have the potential for adverse consequences (very high confidence). Adaptation can complement mitigation to substantially reduce exposure and vulnerability to climate change in some sectors (very high confidence). This complementarity is especially important given that a certain degree of climate change due to past and present emissions is unavoidable (very high confidence).

Description of evidence base

Global-scale reductions in GHG emissions are projected to reduce many of the risks posed by climate change. However, Americans are already experiencing, and will continue to experience, impacts that have already been committed to because of past and present emissions.5,9 In addition, multisector modeling frameworks demonstrate that mitigation is unlikely to completely avoid the adverse impacts of climate change.2,3,4,5,27 These factors will likely necessitate widespread adaptation to climate change (Ch. 28: Adaptation); an expanding literature consistently indicates potential for the reduction of long-term risks and economic damages of climate change.2,4,5,194 However, it is important to note that adaptation can require large up-front costs and long-term commitments for maintenance (Ch. 28: Adaptation), and uncertainty exists in some sectors regarding the applicability and effectiveness of adaptation in reducing risk.101

Because of adaptation’s ability to reduce risk in ways that mitigation cannot, and vice versa, the weight of the evidence shows that the two strategies can act as complements. Several recent studies jointly model the effects of mitigation and adaptation in reducing overall risk to the impacts of climate change in the United States, focusing on infrastructure (e.g., Larsen et al. 2017, Melvin et al. 2016, Neumann et al. 2014)71,77,195 and agriculture (e.g., Kaye and Quemada 2017, Challinor et al. 2014, Lobell et al. 2013).108,109,111 Exploration of this mitigation and adaptation nexus is also advancing in the health sector, with both mitigation and adaptation (such as behavioral changes or physiological acclimatization) being projected to reduce deaths from extreme temperatures100 in both the higher and lower emissions scenarios that are the focus of this chapter. Similarly, energy efficiency investments are reducing GHG emissions and operating costs and improving resilience to future power interruptions from extreme weather events (Ch. 14: Human Health). While more studies exploring the joint effects of mitigation and adaptation are needed, recent literature finds that combined mitigation and adaptation actions can substantially reduce the risks posed by climate change in several sectors.2,103,104 However, several studies highlight that mitigation and adaptation can also interact negatively. While these studies are more limited in the literature, sectors exhibiting potential negative co-effects from mitigation and adaptation include the bioenergy–water resource nexus114 and changes in electricity demand and supply in response to increased use of air conditioning.2,117

Major uncertainties

It is well understood that adaptation will likely reduce climate risks and that adaptation and mitigation interact. However, there are uncertainties regarding the magnitude, timing, and regional/sectoral distribution of these effects. Developing a full understanding of the interaction between mitigation and adaptation, with detailed accounting of potential positive and negative co-effects, is an important research objective that is only beginning to be explored in the detail necessary to inform effective implementation of these policies. Quantifying the effectiveness of adaptation requires detailed analyses regarding the timing and magnitude of how climate is projected to affect people living in the United States and their natural and built environments. As such, the uncertainties described under Key Messages 1 and 2 are also relevant here. Further, uncertainty exists regarding the effectiveness of adaptation measures in improving resilience to climate impacts. For some sectors, such as coastal development, protection measures (for example, elevating structures) have been well studied and implemented to reduce risk. However, the effectiveness of adaptation in other sectors, such as the physiological response to more intense heat waves, is only beginning to be understood.

Description of confidence and likelihood

There is very high confidence that the dual strategies of mitigation and adaptation being taken at national, regional, and local levels provide complementary opportunities to reduce the risks posed by climate change. Studies consistently find that adaptation would be particularly important for impacts occurring over the next several decades, a time period in which the effects of large-scale mitigation would not yet be easily recognizable. However, further analysis is needed to help resolve uncertainties regarding the timing and magnitude of adaptation, including the potential positive and negative co-effects with mitigation.

REFERENCES

  • Ahluwalia, M. B., 2017: The business of pricing carbon: How companies are pricing carbon to mitigate risks and prepare for a Low-Carbon future. Center for Climate and Energy Solutions (C2ES), Arlington, VA, 39 pp. URL. ↩
  • Aldy, J. E., 2017: Real world headwinds for Trump climate change policy. Bulletin of the Atomic Scientists, 73 (6), 376–381. doi:10.1080/00963402.2017.1388673. ↩
  • Al‐Mamoori, A., A. Krishnamurthy, A. A. Rownaghi, and F. Rezaei, 2017: Carbon capture and utilization update. Energy Technology, 5 (6), 834–849. doi:10.1002/ente.201600747. ↩
  • America's Pledge, 2017: America's Pledge Phase 1 Report: States, Cities, and Businesses in the United States Are Stepping Up on Climate Action. Bloomberg Philanthropies, New York, NY, 123 pp. URL. ↩
  • Anderson, G. B., K. W. Oleson, B. Jones, and R. D. Peng, 2016: Projected trends in high-mortality heatwaves under different scenarios of climate, population, and adaptation in 82 US communities. Climatic Change, doi:10.1007/s10584-016-1779-x. ↩
  • Anenberg, S. C., K. R. Weinberger, H. Roman, J. E. Neumann, A. Crimmins, N. Fann, J. Martinich, and P. L. Kinney, 2017: Impacts of oak pollen on allergic asthma in the United States and potential influence of future climate change. GeoHealth, 1 (3), 80–92. doi:10.1002/2017GH000055. ↩
  • Auffhammer, M., P. Baylis, and C. H. Hausman, 2017: Climate change is projected to have severe impacts on the frequency and intensity of peak electricity demand across the United States. Proceedings of the National Academy of Sciences of the United States of America, 114 (8), 1886–1891. doi:10.1073/pnas.1613193114. ↩
  • Barbose, G. L., 2016: U.S. Renewables Portfolio Standards 2016 Annual Status Report. LBNL-1005057. Lawrence Berkeley National Laboratory, Berkeley, CA, URL. ↩
  • Bartos, M., M. Chester, N. Johnson, B. Gorman, D. Eisenberg, I. Linkov, and M. Bates, 2016: Impacts of rising air temperatures on electric transmission ampacity and peak electricity load in the United States. Environmental Research Letters, 11 (11), 114008. doi:10.1088/1748-9326/11/11/114008. ↩
  • Beach, R. H., Y. Cai, A. Thomson, X. Zhang, R. Jones, B. A. McCarl, A. Crimmins, J. Martinich, J. Cole, S. Ohrel, B. DeAngelo, J. McFarland, K. Strzepek, and B. Boehlert, 2015: Climate change impacts on US agriculture and forestry: Benefits of global climate stabilization. Environmental Research Letters, 10 (9), 095004. doi:10.1088/1748-9326/10/9/095004. ↩
  • Beard, C. B., R. J. Eisen, C. M. Barker, J. F. Garofalo, M. Hahn, M. Hayden, A. J. Monaghan, N. H. Ogden, and P. J. Schramm, 2016: Ch. 5: Vector-borne diseases . The Impacts of Climate Change on Human Health in the United States: A Scientific Assessment., U.S. Global Change Research Program, Washington, DC, 129–156. doi:10.7930/J0765C7V. ↩
  • Beaudin, L., and J.-C. Huang, 2014: Weather conditions and outdoor recreation: A study of New England ski areas. Ecological Economics, 106, 56–68. doi:10.1016/j.ecolecon.2014.07.011. ↩
  • Biehl, P. F., S. Crate, M. Gardezi, L. Hamilton, S. L. Harlan, C. Hritz, B. Hubbell, T. A. Kohler, N. Peterson, and J. Silva, 2018: Innovative Tools, Methods, and Analysis: Social Science Perspectives on Climate Change, Part 3. USGCRP, Washington, DC, 38 pp. URL. ↩
  • Blanc, E., K. Strzepek, A. Schlosser, H. Jacoby, A. Gueneau, C. Fant, S. Rausch, and J. Reilly, 2014: Modeling U.S. water resources under climate change. Earth's Future, 2 (4), 197–224. doi:10.1002/2013EF000214. ↩
  • Bosello, F., C. Carraro, and E. De Cian, 2013: Adaptation can help mitigation: An integrated approach to post-2012 climate policy. Environment and Development Economics, 18 (3), 270–290. doi:10.1017/S1355770X13000132. ↩
  • Bouttes, N., J. M. Gregory, and J. A. Lowe, 2013: The reversibility of sea level rise. Journal of Climate, 26 (8), 2502–2513. doi:10.1175/jcli-d-12-00285.1. ↩
  • Burakowski, E., and M. Magnusson, 2012: Climate impacts on the winter tourism economy in the United States. Natural Resources Defense Council, New York, 33 pp. URL. ↩
  • Burke, L., L. Reytar, M. Spalding, and A. Perry, 2011: Reefs at Risk Revisited. World Resources Institute, Washington, D.C., 130 pp. URL. ↩
  • CAFF, 2013: Arctic Biodiversity Assessment: Status and Trends in Arctic Biodiversity. Arctic Council, Conservation of Arctic Flora and Fauna (CAFF), Akureyri, Iceland, 674 pp. URL. ↩
  • California Assembly, 2016: URL. ↩
  • Capps, S. L., C. T. Driscoll, H. Fakhraei, P. H. Templer, K. J. Craig, J. B. Milford, and K. F. Lambert, 2016: Estimating potential productivity cobenefits for crops and trees from reduced ozone with U.S. coal power plant carbon standards. Journal of Geophysical Research Atmospheres, 121 (24), 14,679-14,690. doi:10.1002/2016JD025141. ↩
  • Cayan, D. R., S. Moser, G. Franco, M. Hanemann, and M.-A. Jones, Eds., 2013: California Climate Scenarios Assessment. Springer, The Netherlands, 554 pp. ↩
  • Cayan, D., A. L. Luers, M. Hanemann, G. Franco, and B. Croes, 2006: Scenarios of climate change in California: An overview. CEC-500-2005-186-SF. California Energy Commission, Sacramento, CA, 47 pp. URL. ↩
  • Cayan, D., A. Luers, G. Franco, M. Hanemann, B. Croes, and Edward Vine, 2008: California at a crossroads: Climate change science informing policy. Climatic Change, 87 (1 Suppl.), 1–322. URL. ↩
  • CBO, 2016: Potential Increases in Hurricane Damage in the United States: Implications for the Federal Budget. Congressional Budget Office (CBO), Washington, DC, 33 pp. URL. ↩
  • CDP, 2015: Putting a price on risk: Carbon pricing in the corporate world. CDP Report 2015 v.1.2. CDP North America, New York, 66 pp. URL. ↩
  • CDP, 2017: CDP web site. CDP, [worldwide]. URL. ↩
  • Chadburn, S. E., E. J. Burke, P. M. Cox, P. Friedlingstein, G. Hugelius, and S. Westermann, 2017: An observation-based constraint on permafrost loss as a function of global warming. Nature Climate Change, 7, 340–344. doi:10.1038/nclimate3262. ↩
  • Challinor, A. J., J. Watson, D. B. Lobell, S. M. Howden, D. R. Smith, and N. Chhetri, 2014: A meta-analysis of crop yield under climate change and adaptation. Nature Climate Change, 4 (4), 287–291. doi:10.1038/nclimate2153. ↩
  • Chambwera, M., G. Heal, C. Dubeux, S. Hallegatte, L. Leclerc, A. Markandya, B. A. McCarl, R. Mechler, and J. E. Neumann, 2014: Economics of adaptation. Climate Change 2014: Impacts, Adaptation, and Vulnerability. Part A: Global and Sectoral Aspects. Contribution of Working Group II to the Fifth Assessment Report of the Intergovernmental Panel of Climate Change. Field, C. B., V. R. Barros, D. J. Dokken, K. J. Mach, M. D. Mastrandrea, T. E. Bilir, M. Chatterjee, K. L. Ebi, Y. O. Estrada, R. C. Genova, B. Girma, E. S. Kissel, A. N. Levy, S. MacCracken, P. R. Mastrandrea, and L. L. White, Eds., Cambridge University Press, Cambridge, United Kingdom and New York, NY, USA, 945–977. ↩
  • Chang, H. H., H. Hao, and S. E. Sarnat, 2014: A statistical modeling framework for projecting future ambient ozone and its health impact due to climate change. Atmospheric Environment, 89, 290–297. doi:10.1016/j.atmosenv.2014.02.037. ↩
  • Chapra, S. C., B. Boehlert, C. Fant, V. J. Bierman, J. Henderson, D. Mills, D. M. L. Mas, L. Rennels, L. Jantarasami, J. Martinich, K. M. Strzepek, and H. W. Paerl, 2017: Climate change impacts on harmful algal blooms in U.S. freshwaters: A screening-level assessment. Environmental Science & Technology, 51 (16), 8933–8943. doi:10.1021/acs.est.7b01498. ↩
  • Childress, A., E. Gordon, T. Jedd, R. Klein, J. Lukas, and R. McKeown, 2015: Colorado Climate Change Vulnerability Study. University of Colorado Boulder, Boulder, CO, 176 pp. URL. ↩
  • Cho, S. J., and B. A. McCarl, 2017: Climate change influences on crop mix shifts in the United States. Scientific Reports, 7, 40845. doi:10.1038/srep40845. ↩
  • Ciavarella, A., P. Stott, and J. Lowe, 2017: Early benefits of mitigation in risk of regional climate extremes. Nature Climate Change, 7, 326–330. doi:10.1038/nclimate3259. ↩
  • Clarke, L., J. Edmonds, H. Jacoby, H. Pitcher, J. Reilly, and R. Richels, 2007: Scenarios of Greenhouse Gas Emissions and Atmospheric Concentrations—US Climate Change Science Program Synthesis and Assessment Product 2.1a. Sub-report 2.1A of Synthesis and Assessment Product 2.1 . U.S. Department of Energy, Office of Biological & Environmental Research, Washington, D.C., 154 pp. URL. ↩
  • Clarke, L., K. Jiang, K. Akimoto, M. Babiker, G. Blanford, K. Fisher-Vanden, J.-C. Hourcade, V. Krey, E. Kriegler, A. Löschel, D. McCollum, S. Paltsev, S. Rose, P. Shukla, M. Tavoni, B. van der Zwaan, and D. van Vuuren, 2014: Assessing transformation pathways. Climate Change 2014: Mitigation of Climate Change. Contribution of Working Group III to the Fifth Assessment Report of the Intergovernmental Panel on Climate Change. Edenhofer, O., R. Pichs-Madruga, Y. Sokona, E. Farahani, S. Kadner, K. Seyboth, A. Adler, I. Baum, S. Brunner, P. Eickemeier, B. Kriemann, J. Savolainen, S. Schlömer, C. von Stechow, T. Zwickel, and J. C. Minx, Eds., Cambridge University Press, Cambridge, United Kingdom and New York, NY, USA, 413–510. URL. ↩
  • Collins, M., R. Knutti, J. Arblaster, J.-L. Dufresne, T. Fichefet, P. Friedlingstein, X. Gao, W. J. Gutowski, T. Johns, G. Krinner, M. Shongwe, C. Tebaldi, A. J. Weaver, and M. Wehner, 2013: Long-term climate change: Projections, commitments and irreversibility. Climate Change 2013: The Physical Science Basis. Contribution of Working Group I to the Fifth Assessment Report of the Intergovernmental Panel on Climate Change. Stocker, T. F., D. Qin, G.-K. Plattner, M. Tignor, S. K. Allen, J. Boschung, A. Nauels, Y. Xia, V. Bex, and P. M. Midgley, Eds., Cambridge University Press, Cambridge, United Kingdom and New York, NY, USA, 1029–1136. URL. ↩
  • Cooley, S. R., and S. C. Doney, 2009: Anticipating ocean acidification's economic consequences for commercial fisheries. Environmental Research Letters, 4 (024007), 8. doi:10.1088/1748-9326/4/2/024007. ↩
  • Cooley, S. R., J. E. Rheuban, D. R. Hart, V. Luu, D. M. Glover, J. A. Hare, and S. C. Doney, 2015: An integrated assessment model for helping the United States sea scallop (Placopecten magellanicus) fishery plan ahead for ocean acidification and warming. PLOS ONE, 10 (5), e0124145. doi:10.1371/journal.pone.0124145. ↩
  • Corell, R. W., D. Liverman, K. Dow, K. L. Ebi, K. Kunkel, L. O. Mearns, and J. Melillo, 2014: Ch. 29: Research needs for climate and global change assessments. Climate Change Impacts in the United States: The Third National Climate Assessment. Melillo, J. M., Terese (T.C.) Richmond, and G. W. Yohe, Eds., U.S. Global Change Research Program, Washington, DC, 707–718. doi:10.7930/J03R0QR3. ↩
  • Cornford, S. L., D. F. Martin, A. J. Payne, E. G. Ng, A. M. Le Brocq, R. M. Gladstone, T. L. Edwards, S. R. Shannon, C. Agosta, M. R. van den Broeke, H. H. Hellmer, G. Krinner, S. R. M. Ligtenberg, R. Timmermann, and D. G. Vaughan, 2015: Century-scale simulations of the response of the West Antarctic Ice Sheet to a warming climate. The Cryosphere, 9 (4), 1579–1600. doi:10.5194/tc-9-1579-2015. ↩
  • Dawson, J., and D. Scott, 2013: Managing for climate change in the alpine ski sector. Tourism Management, 35, 244–254. doi:10.1016/j.tourman.2012.07.009. ↩
  • DeAngelo, B., J. Edmonds, D. W. Fahey, and B. M. Sanderson, 2017: Perspectives on Climate Change Mitigation. Climate Science Special Report: Fourth National Climate Assessment, Volume I. Wuebbles, D. J., D. W. Fahey, K. A. Hibbard, D. J. Dokken, B. C. Stewart, and T. K. Maycock, Eds., U.S. Global Change Research Program, Washington, DC, USA, 393–410. doi:10.7930/J0M32SZG. ↩
  • DeConto, R. M., and D. Pollard, 2016: Contribution of Antarctica to past and future sea-level rise. Nature, 531 (7596), 591–597. doi:10.1038/nature17145. ↩
  • Denton, F., T. J. Wilbanks, A. C. Abeysinghe, I. Burton, Q. Gao, M. C. Lemos, T. Masui, K. L. O'Brien, and K. Warner, 2014: Climate-resilient pathways: Adaptation, mitigation, and sustainable development. Climate Change 2014: Impacts, Adaptation, and Vulnerability. Part A: Global and Sectoral Aspects. Contribution of Working Group II to the Fifth Assessment Report of the Intergovernmental Panel of Climate Change. Field, C. B., V. R. Barros, D. J. Dokken, K. J. Mach, M. D. Mastrandrea, T. E. Bilir, M. Chatterjee, K. L. Ebi, Y. O. Estrada, R. C. Genova, B. Girma, E. S. Kissel, A. N. Levy, S. MacCracken, P. R. Mastrandrea, and L. L. White, Eds., Cambridge University Press, Cambridge, United Kingdom and New York, NY, USA, 1101–1131. ↩
  • Diaz, D. B., 2016: Estimating global damages from sea level rise with the Coastal Impact and Adaptation Model (CIAM). Climatic Change, 137 (1), 143–156. doi:10.1007/s10584-016-1675-4. ↩
  • Diaz, D., and F. Moore, 2017: Quantifying the economic risks of climate change. Nature Climate Change, 7, 774–782. doi:10.1038/nclimate3411. ↩
  • Diaz, D., and F. Moore, 2017: Valuing Potential Climate Impacts: A Review of Current Limitations and the Research Frontier. Report #3002011885. EPRI, Palo Alto, CA, 34 pp. URL. ↩
  • Diaz, D., and K. Keller, 2016: A potential disintegration of the West Antarctic ice sheet: Implications for economic analyses of climate policy. American Economic Review, 106 (5), 607–611. doi:10.1257/aer.p20161103. ↩
  • DOE, 2017: Transforming the Nation's Electricity System: The Second Installment of the QER. DOE/EPSA-0008. U.S. Department of Energy (DOE), Washington, DC, URL. ↩
  • DOE-EPSA, 2017: Energy CO2 Emissions Impacts of Clean Energy Technology Innovation and Policy. U.S. Department of Energy's Office of Energy Policy and Systems Analysis (DOE-EPSA), Washington, DC, 43 pp. URL. ↩
  • DSIRE, 2017: Database of State Incentives for Renewables & Efficiency (DSIRE) [online tool]. NC State University, NC Clean Energy Technology Center, Raleigh, NC. URL. ↩
  • EASAC, 2018: Negative emissions technologies: What role in meeting Paris Agreement targets? EASAC policy report 35. European Academies' Science Advisory Council (EASAC), Halle, Germany, 37 pp. URL. ↩
  • EIA, 2018: Annual Energy Outlook 2018. AEO2018. U.S. Energy Information Administration (EIA), 146 pp. URL. ↩
  • Environment and Climate Change Canada, 2016: Technical update to Environment and Climate Change Canada's social cost of greenhouse gas estimates. En14-202/2016E-PDF. Environment and Climate Change Canada, Gatineau, Quebec, various pp. URL. ↩
  • EPA, 2000: Guidelines for preparing economic analyses. EPA 240-R-00-003. U.S. Environmental Protection Agency, Washington, DC, various pp. URL. ↩
  • EPA, 2013: Watershed Modeling to Assess the Sensitivity of Streamflow, Nutrient, and Sediment Loads to Potential Climate Change and Urban Development in 20 U.S. Watersheds (Final Report). EPA/600/R-12/058F. U.S. Environmental Protection Agency (EPA), Washington, DC, various pp. URL. ↩
  • EPA, 2015: Climate Change in the United States: Benefits of Global Action. EPA 430-R-15-001. U.S. Environmental Protection Agency (EPA), Office of Atmospheric Programs, Washington, DC, 93 pp. URL. ↩
  • EPA, 2017: Multi-model Framework for Quantitative Sectoral Impacts Analysis: A Technical Report for the Fourth National Climate Assessment. EPA 430‐R‐17‐001. U.S. Environmental Protection Agency (EPA), Washington, DC, 271 pp. URL. ↩
  • EPA, 2018: Inventory of U.S. greenhouse gas emissions and sinks: 1990–2016. EPA 430-P-18-001. U.S. Environmental Protection Agency (EPA), Washington, DC, various pp. URL. ↩
  • EPRI, 2015: CO2 Mitigation for Climate Risk Management. 3002005831. EPRI, Palo Alto, 28 pp. URL. ↩
  • Executive Office of the President, 2016: Climate change: Fiscal risks facing the federal government. The White House, Office of Management and Budget, Washington, DC, 34 pp. URL. ↩
  • Executive Office of the President, 2016: United States Mid-century strategy for deep decarbonization. The White House, Washington, DC, 110 pp. URL. ↩
  • Executive Office of the President, 2017: Executive Order 13783: Promoting Energy Independence and Economic Growth. The White House, Washington, DC. March 28. URL. ↩
  • Executive Office of the President, 2017: Statement by President Trump on the Paris Climate Accord. The White House, Washington, DC. June 1. URL. ↩
  • Fann, N., C. G. Nolte, P. Dolwick, T. L. Spero, A. Curry Brown, S. Phillips, and S. Anenberg, 2015: The geographic distribution and economic value of climate change-related ozone health impacts in the United States in 2030. Journal of the Air & Waste Management Association, 65 (5), 570–580. doi:10.1080/10962247.2014.996270. ↩
  • Fann, N., T. Brennan, P. Dolwick, J. L. Gamble, V. Ilacqua, L. Kolb, C. G. Nolte, T. L. Spero, and L. Ziska, 2016: Ch. 3: Air quality impacts. The Impacts of Climate Change on Human Health in the United States: A Scientific Assessment., U.S. Global Change Research Program, Washington, DC, 69–98. doi:10.7930/J0GQ6VP6. ↩
  • Fawcett, A. A., G. C. Iyer, L. E. Clarke, J. A. Edmonds, N. E. Hultman, H. C. McJeon, J. Rogelj, R. Schuler, J. Alsalam, G. R. Asrar, J. Creason, M. Jeong, J. McFarland, A. Mundra, and W. Shi, 2015: Can Paris pledges avert severe climate change? Science, 350 (6265), 1168–1169. doi:10.1126/science.aad5761. ↩
  • Felgenhauer, T., and M. Webster, 2013: Multiple adaptation types with mitigation: A framework for policy analysis. Global Environmental Change, 23 (6), 1556–1565. doi:10.1016/j.gloenvcha.2013.09.018. ↩
  • Fisher-Vanden, K., I. Sue Wing, E. Lanzi, and D. Popp, 2013: Modeling climate change feedbacks and adaptation responses: Recent approaches and shortcomings. Climatic Change, 117 (3), 481–495. doi:10.1007/s10584-012-0644-9. ↩
  • Fiske, S., K. Hubacek, A. Jorgenson, J. Li, T. McGovern, T. Rick, J. Schor, W. Solecki, R. York, and A. Zycherman, 2018: Drivers and responses: Social science perspectives on climate change, Part 2. USGCRP, Washington, DC, 37 pp. URL. ↩
  • Foden, W. B., S. H. M. Butchart, S. N. Stuart, J.-C. Vié, H. R. Akçakaya, A. Angulo, L. M. DeVantier, A. Gutsche, E. Turak, L. Cao, S. D. Donner, V. Katariya, R. Bernard, R. A. Holland, A. F. Hughes, S. E. O'Hanlon, S. T. Garnett, Ç. H. Şekercioğlu, and G. M. Mace, 2013: Identifying the world's most climate change vulnerable species: A systematic trait-based assessment of all birds, amphibians and corals. PLOS ONE, 8 (6), e65427. doi:10.1371/journal.pone.0065427. ↩
  • Gamble, J. L., J. Balbus, M. Berger, K. Bouye, V. Campbell, K. Chief, K. Conlon, A. Crimmins, B. Flanagan, C. Gonzalez-Maddux, E. Hallisey, S. Hutchins, L. Jantarasami, S. Khoury, M. Kiefer, J. Kolling, K. Lynn, A. Manangan, M. McDonald, R. Morello-Frosch, M. H. Redsteer, P. Sheffield, K. Thigpen Tart, J. Watson, K. P. Whyte, and A. F. Wolkin, 2016: Ch. 9: Populations of concern. The Impacts of Climate Change on Human Health in the United States: A Scientific Assessment., U.S. Global Change Research Program, Washington, DC, 247–286. doi:10.7930/J0Q81B0T. ↩
  • Ganopolski, A., R. Winkelmann, and H. J. Schellnhuber, 2016: Critical insolation–CO2 relation for diagnosing past and future glacial inception. Nature, 529, 200–203. doi:10.1038/nature16494. ↩
  • Garcia-Menendez, F., R. K. Saari, E. Monier, and N. E. Selin, 2015: U.S. air quality and health benefits from avoided climate change under greenhouse gas mitigation. Environmental Science & Technology, 49 (13), 7580–7588. doi:10.1021/acs.est.5b01324. ↩
  • Gibon, T., E. G. Hertwich, A. Arvesen, B. Singh, and F. Verones, 2017: Health benefits, ecological threats of low-carbon electricity. Environmental Research Letters, 12 (3), 034023. doi:10.1088/1748-9326/aa6047. ↩
  • Golub, A., R. Lubowski, and P. Piris-Cabezas, 2017: Balancing Risks from Climate Policy Uncertainties: The Role of Options and Reduced Emissions from Deforestation and Forest Degradation. Ecological Economics, 138, 90–98. doi:10.1016/j.ecolecon.2017.03.013. ↩
  • Hadka, D., J. Herman, P. Reed, and K. Keller, 2015: An open source framework for many-objective robust decision making. Environmental Modelling & Software, 74, 114–129. doi:10.1016/j.envsoft.2015.07.014. ↩
  • Hallegatte, S., 2009: Strategies to adapt to an uncertain climate change. Global Environmental Change, 19 (2), 240–247. doi:10.1016/j.gloenvcha.2008.12.003. ↩
  • Hardy, D., H. Lazrus, M. Mendez, B. Orlove, I. Rivera-Collazo, J. T. Roberts, M. Rockman, K. Thomas, B. P. Warner, and R. Winthrop, 2018: Social vulnerability: Social science perspectives on climate change, part 1. USGCRP, Washington, DC, 38 pp. URL. ↩
  • Hayhoe, K., J. Edmonds, R. E. Kopp, A. N. LeGrande, B. M. Sanderson, M. F. Wehner, and D. J. Wuebbles, 2017: Climate Models, Scenarios, and Projections. Climate Science Special Report: Fourth National Climate Assessment, Volume I. Wuebbles, D. J., D. W. Fahey, K. A. Hibbard, D. J. Dokken, B. C. Stewart, and T. K. Maycock, Eds., U.S. Global Change Research Program, Washington, DC, USA, 133–160. doi:10.7930/J0WH2N54. ↩
  • Heck, V., D. Gerten, W. Lucht, and A. Popp, 2018: Biomass-based negative emissions difficult to reconcile with planetary boundaries. Nature Climate Change, 8 (2), 151–155. doi:10.1038/s41558-017-0064-y. ↩
  • Heeter, J., J. J. Cook, and L. Bird, 2017: Charting the Emergence of Corporate Procurement of Utility-Scale PV. NREL/TP-6A20-69080. National Renewable Energy Laboratory, Golden, CO, 43 pp. URL. ↩
  • Hejazi, M. I., N. Voisin, L. Liu, L. M. Bramer, D. C. Fortin, J. E. Hathaway, M. Huang, P. Kyle, L. R. Leung, H.-Y. Li, Y. Liu, P. L. Patel, T. C. Pulsipher, J. S. Rice, T. K. Tesfa, C. R. Vernon, and Y. Zhou, 2015: 21st century United States emissions mitigation could increase water stress more than the climate change it is mitigating. Proceedings of the National Academy of Sciences of the United States of America, 112 (34), 10635–10640. doi:10.1073/pnas.1421675112. ↩
  • Horton, R. H., D. A. Bader, C. Rosenzweig, A. T. DeGaetano, and W. Solecki, 2014: Climate Change in New York State. Updating the 2011 ClimAID Climate Risk Information, Supplement to NYSERDA Report 11-18. NYSERDA Report 14-26. New York State Energy Research and Development Authority (NYSERDA), Albany, NY, 17 pp. URL. ↩
  • Houser, T., S. Hsiang, R. Kopp, K. Larsen, M. Delgado, A. Jina, M. Mastrandrea, S. Mohan, R. Muir-Wood, D. J. Rasmussen, J. Rising, and Paul Wilson, 2015: Economic Risks of Climate Change: An American Prospectus. Columbia University Press, New York,. ↩
  • Hsiang, S., R. Kopp, A. Jina, J. Rising, M. Delgado, S. Mohan, D. J. Rasmussen, R. Muir-Wood, P. Wilson, M. Oppenheimer, K. Larsen, and T. Houser, 2017: Estimating economic damage from climate change in the United States. Science, 356 (6345), 1362–1369. doi:10.1126/science.aal4369. ↩
  • Huber, V., H. J. Schellnhuber, N. W. Arnell, K. Frieler, A. D. Friend, D. Gerten, I. Haddeland, P. Kabat, H. Lotze-Campen, W. Lucht, M. Parry, F. Piontek, C. Rosenzweig, J. Schewe, and L. Warszawski, 2014: Climate impact research: Beyond patchwork. Earth System Dynamics, 5 (2), 399–408. doi:10.5194/esd-5-399-2014. ↩
  • IPCC, 2014: Annex II: Glossary [Mach, K.J., S. Planton and C. von Stechow (eds.)]. Climate Change 2014: Synthesis Report. Contribution of Working Groups I, II and III to the Fifth Assessment Report of the Intergovernmental Panel on Climate Change. Core Writing Team, R. K. Pachauri, and L. A. Meyer, Eds., IPCC, Geneva, 117–130. URL. ↩
  • IWGSCC, 2010: Technical Support Document: Social Cost of Carbon for Regulatory Impact Analysis Under Executive Order 12866. Interagency Working Group on Social Cost of Carbon (IWGSCC), Washington, DC, 50 pp. URL. ↩
  • Jacobs, J. M., L. R. Cattaneo, W. Sweet, and T. Mansfield, 2018: Recent and future outlooks for nuisance flooding impacts on roadways on the US East Coast. Transportation Research Record, doi:10.1177/0361198118756366. ↩
  • Jacoby, H. D., A. C. Janetos, R. Birdsey, J. Buizer, K. Calvin, F. de la Chesnaye, D. Schimel, I. Sue Wing, R. Detchon, J. Edmonds, L. Russell, and J. West, 2014: Ch. 27: Mitigation. Climate Change Impacts in the United States: The Third National Climate Assessment. Melillo, J. M., Terese (T.C.) Richmond, and G. W. Yohe, Eds., U.S. Global Change Research Program, Washington, DC, 648–669. doi:10.7930/J0C8276J. ↩
  • Jewell, J., A. Cherp, and K. Riahi, 2014: Energy security under de-carbonization scenarios: An assessment framework and evaluation under different technology and policy choices. Energy Policy, 65, 743–760. doi:10.1016/j.enpol.2013.10.051. ↩
  • Joughin, I., B. E. Smith, and B. Medley, 2014: Marine ice sheet collapse potentially under way for the Thwaites Glacier Basin, West Antarctica. Science, 344 (6185), 735–738. doi:10.1126/science.1249055. ↩
  • Kaye, J. P., and M. Quemada, 2017: Using cover crops to mitigate and adapt to climate change. A review. Agronomy for Sustainable Development, 37 (1), 4. doi:10.1007/s13593-016-0410-x. ↩
  • Kingsley, S. L., M. N. Eliot, J. Gold, R. R. Vanderslice, and G. A. Wellenius, 2016: Current and projected heat-related morbidity and mortality in Rhode Island. Environmental Health Perspectives, 124 (4), 460–467. doi:10.1289/ehp.1408826. ↩
  • Klein, R. J. T., G. F. Midgley, B. L. Preston, M. Alam, F. G. H. Berkhout, K. Dow, and M. R. Shaw, 2014: Adaptation opportunities, constraints, and limits. Climate Change 2014: Impacts, Adaptation, and Vulnerability. Part A: Global and Sectoral Aspects. Contribution of Working Group II to the Fifth Assessment Report of the Intergovernmental Panel of Climate Change. Field, C. B., V. R. Barros, D. J. Dokken, K. J. Mach, M. D. Mastrandrea, T. E. Bilir, M. Chatterjee, K. L. Ebi, Y. O. Estrada, R. C. Genova, B. Girma, E. S. Kissel, A. N. Levy, S. MacCracken, P. R. Mastrandrea, and L. L. White, Eds., Cambridge University Press, Cambridge, United Kingdom and New York, NY, USA, 899–943. ↩
  • Knutson, T., J. P. Kossin, C. Mears, J. Perlwitz, and M. F. Wehner, 2017: Detection and Attribution of Climate Change. Climate Science Special Report: Fourth National Climate Assessment, Volume I. Wuebbles, D. J., D. W. Fahey, K. A. Hibbard, D. J. Dokken, B. C. Stewart, and T. K. Maycock, Eds., U.S. Global Change Research Program, Washington, DC, USA, 114–132. doi:10.7930/J01834ND. ↩
  • Kopp, R. E., D. R. Easterling, T. Hall, K. Hayhoe, R. Horton, K. E. Kunkel, and A. N. LeGrande, 2017: Potential Surprises: Compound Extremes and Tipping Elements. Climate Science Special Report: Fourth National Climate Assessment, Volume I. Wuebbles, D. J., D. W. Fahey, K. A. Hibbard, D. J. Dokken, B. C. Stewart, and T. K. Maycock, Eds., U.S. Global Change Research Program, Washington, DC, USA, 411–429. doi:10.7930/J0GB227J. ↩
  • Kopp, R. E., R. L. Shwom, G. Wagner, and J. Yuan, 2016: Tipping elements and climate–economic shocks: Pathways toward integrated assessment. Earth's Future, 4, 346–372. doi:10.1002/2016EF000362. ↩
  • Kopp, R. E., R. M. DeConto, D. A. Bader, C. C. Hay, R. M. Horton, S. Kulp, M. Oppenheimer, D. Pollard, and B. H. Strauss, 2017: Evolving understanding of Antarctic ice‐sheet physics and ambiguity in probabilistic sea‐level projections. Earth's Future, 5 (12), 1217–1233. doi:10.1002/2017EF000663. ↩
  • Kopp, R. E., R. M. Horton, C. M. Little, J. X. Mitrovica, M. Oppenheimer, D. J. Rasmussen, B. H. Strauss, and C. Tebaldi, 2014: Probabilistic 21st and 22nd century sea-level projections at a global network of tide-gauge sites. Earth's Future, 2 (8), 383–406. doi:10.1002/2014EF000239. ↩
  • Kruger, J. A., 2017: Hedging an Uncertain Future: Internal Carbon Prices in the Electric Power Sector. Resources for the Future, Washington, DC, 14 pp. URL. ↩
  • Lane, D. R., R. C. Ready, R. W. Buddemeier, J. A. Martinich, K. C. Shouse, and C. W. Wobus, 2013: Quantifying and valuing potential climate change impacts on coral reefs in the United States: Comparison of two scenarios. PLOS ONE, 8 (12), e82579. doi:10.1371/journal.pone.0082579. ↩
  • Larkin, A., J. Kuriakose, M. Sharmina, and K. Anderson, 2018: What if negative emission technologies fail at scale? Implications of the Paris Agreement for big emitting nations. Climate Policy, 18 (6), 690–714. doi:10.1080/14693062.2017.1346498. ↩
  • Larsen, K., J. Larsen, W. Herndon, S. Mohan, and T. Houser, 2017: Taking Stock 2017: Adjusting Expectations for US Greenhouse Gas Emissions. Rhodium Group, New York, NY, 10 pp. URL. ↩
  • Larsen, P. H., B. Boehlert, J. H. Eto, K. Hamachi-LaCommare, J. Martinich, and L. Rennels, 2017: Projecting future costs to U.S. electric utility customers from power interruptions. LBNL- 1007027. Lawrence Berkeley National Laboratory, Berkeley, CA, 45 pp. URL. ↩
  • Le Bars, D., S. Drijfhout, and H. de Vries, 2017: A high-end sea level rise probabilistic projection including rapid Antarctic ice sheet mass loss. Environmental Research Letters, 12 (4), 044013. doi:10.1088/1748-9326/aa6512. ↩
  • Lempert, R. J., 2014: Embedding (some) benefit-cost concepts into decision support processes with deep uncertainty. Journal of Benefit-Cost Analysis, 5 (3), 487–514. doi:10.1515/jbca-2014-9006. ↩
  • Liverman, D., 2016: U.S. national climate assessment gaps and research needs: Overview, the economy and the international context. Climatic Change, 135 (1), 173–186. doi:10.1007/s10584-015-1464-5. ↩
  • Lobell, D. B., and S. Asseng, 2017: Comparing estimates of climate change impacts from process-based and statistical crop models. Environmental Research Letters, 12 (1), 015001. doi:10.1088/1748-9326/aa518a. ↩
  • Lobell, D. B., U. L. C. Baldos, and T. W. Hertel, 2013: Climate adaptation as mitigation: The case of agricultural investments. Environmental Research Letters, 8 (1), 015012. doi:10.1088/1748-9326/8/1/015012. ↩
  • Luderer, G., C. Bertram, K. Calvin, E. De Cian, and E. Kriegler, 2016: Implications of weak near-term climate policies on long-term mitigation pathways. Climatic Change, 136 (1), 127–140. doi:10.1007/s10584-013-0899-9. ↩
  • MacCracken, M. C., 2016: The rationale for accelerating regionally focused climate intervention research. Earth's Future, 4 (12), 649–657. doi:10.1002/2016EF000450. ↩
  • Macknick, J., R. Newmark, G. Heath, and K. C. Hallett, 2012: Operational water consumption and withdrawal factors for electricity generating technologies: A review of existing literature. Environmental Research Letters, 7 (4), 045802. doi:10.1088/1748-9326/7/4/045802. ↩
  • Marsha, A., S. R. Sain, M. J. Heaton, A. J. Monaghan, and O. V. Wilhelmi, 2016: Influences of climatic and population changes on heat-related mortality in Houston, Texas, USA. Climatic Change, doi:10.1007/s10584-016-1775-1. ↩
  • Marshall, E., M. Aillery, S. Malcolm, and R. Williams, 2015: Climate Change, Water Scarcity, and Adaptation in the U.S. Fieldcrop Sector. Economic Research Report No. (ERR-201). USDA Economic Research Service, Washington, DC, 119 pp. URL. ↩
  • Martinich, J., A. Crimmins, R. H. Beach, A. Thomson, and J. McFarland, 2017: Focus on agriculture and forestry benefits of reducing climate change impacts. Environmental Research Letters, 12 (6), 060301. doi:10.1088/1748-9326/aa6f23. ↩
  • Martinich, J., J. Neumann, L. Ludwig, and L. Jantarasami, 2013: Risks of sea level rise to disadvantaged communities in the United States. Mitigation and Adaptation Strategies for Global Change, 18, 169–185. doi:10.1007/s11027-011-9356-0. ↩
  • McCollum, D. L., V. Krey, K. Riahi, P. Kolp, A. Grubler, M. Makowski, and N. Nakicenovic, 2013: Climate policies can help resolve energy security and air pollution challenges. Climatic Change, 119 (2), 479–494. doi:10.1007/s10584-013-0710-y. ↩
  • McFarland, J., Y. Zhou, L. Clarke, P. Sullivan, J. Colman, W. S. Jaglom, M. Colley, P. Patel, J. Eom, S. H. Kim, G. P. Kyle, P. Schultz, B. Venkatesh, J. Haydel, C. Mack, and J. Creason, 2015: Impacts of rising air temperatures and emissions mitigation on electricity demand and supply in the United States: A multi-model comparison. Climatic Change, 131 (1), 111–125. doi:10.1007/s10584-015-1380-8. ↩
  • McKenzie, D., and J. S. Littell, 2017: Climate change and the eco-hydrology of fire: Will area burned increase in a warming western USA? Ecological Applications, 27 (1), 26–36. doi:10.1002/eap.1420. ↩
  • Melillo, J. M., T. (T. C. . Richmond, and G. W. Yohe, Eds., 2014: Climate Change Impacts in the United States: The Third National Climate Assessment. U.S. Global Change Research Program, Washington, DC, 841 pp. doi:10.7930/J0Z31WJ2. ↩
  • Melvin, A. M., J. Murray, B. Boehlert, J. A. Martinich, L. Rennels, and T. S. Rupp, 2017: Estimating wildfire response costs in Alaska's changing climate. Climatic Change, 141 (4), 783–795. doi:10.1007/s10584-017-1923-2. ↩
  • Melvin, A. M., P. Larsen, B. Boehlert, J. E. Neumann, P. Chinowsky, X. Espinet, J. Martinich, M. S. Baumann, L. Rennels, A. Bothner, D. J. Nicolsky, and S. S. Marchenko, 2017: Climate change damages to Alaska public infrastructure and the economics of proactive adaptation. Proceedings of the National Academy of Sciences of the United States of America, 114 (2), E122–E131. doi:10.1073/pnas.1611056113. ↩
  • Mengel, M., A. Levermann, K. Frieler, A. Robinson, B. Marzeion, and R. Winkelmann, 2016: Future sea level rise constrained by observations and long-term commitment. Proceedings of the National Academy of Sciences of the United States of America, 113 (10), 2597–2602. doi:10.1073/pnas.1500515113. ↩
  • Mills, D., J. Schwartz, M. Lee, M. Sarofim, R. Jones, M. Lawson, M. Duckworth, and L. Deck, 2015: Climate change impacts on extreme temperature mortality in select metropolitan areas in the United States. Climatic Change, 131 (1), 83–95. doi:10.1007/s10584-014-1154-8. ↩
  • Mills, D., R. Jones, C. Wobus, J. Ekstrom, L. Jantarasami, A. St. Juliana, and A. Crimmins, 2018: Projecting age-stratified risk of exposure to inland flooding and wildfire smoke in the United States under two climate scenarios. Environmental Health Perspectives, 126 (4), 047007. doi:10.1289/EHP2594. ↩
  • Monier, E., and X. Gao, 2015: Climate change impacts on extreme events in the United States: An uncertainty analysis. Climatic Change, 131 (1), 67–81. doi:10.1007/s10584-013-1048-1. ↩
  • Morini, E., A. Touchaei, B. Castellani, F. Rossi, and F. Cotana, 2016: The impact of albedo increase to mitigate the urban heat island in Terni (Italy) using the WRF model. Sustainability, 8 (10), 999. doi:10.3390/su8100999. ↩
  • Moser, S. C., 2012: Adaptation, mitigation, and their disharmonious discontents: An essay. Climatic Change, 111 (2), 165–175. doi:10.1007/s10584-012-0398-4. ↩
  • Moser, S. C., J. M. Melillo, K. L. Jacobs, R. H. Moss, and J. L. Buizer, 2016: Aspirations and common tensions: Larger lessons from the third US national climate assessment. Climatic Change, 135 (1), 187–201. doi:10.1007/s10584-015-1530-z. ↩
  • Moss, R. H., J. A. Edmonds, K. A. Hibbard, M. R. Manning, S. K. Rose, D. P. van Vuuren, T. R. Carter, S. Emori, M. Kainuma, T. Kram, G. A. Meehl, J. F. B. Mitchell, N. Nakicenovic, K. Riahi, S. J. Smith, R. J. Stouffer, A. M. Thomson, J. P. Weyant, and T. J. Wilbanks, 2010: The next generation of scenarios for climate change research and assessment. Nature, 463, 747–756. doi:10.1038/nature08823. ↩
  • Murray, B. C., and P. T. Maniloff, 2015: Why have greenhouse emissions in RGGI states declined? An econometric attribution to economic, energy market, and policy factors. Energy Economics, 51, 581–589. doi:10.1016/j.eneco.2015.07.013. ↩
  • Müller, C., J. Elliott, J. Chryssanthacopoulos, A. Arneth, J. Balkovic, P. Ciais, D. Deryng, C. Folberth, M. Glotter, S. Hoek, T. Iizumi, R. C. Izaurralde, C. Jones, N. Khabarov, P. Lawrence, W. Liu, S. Olin, T. A. M. Pugh, D. K. Ray, A. Reddy, C. Rosenzweig, A. C. Ruane, G. Sakurai, E. Schmid, R. Skalsky, C. X. Song, X. Wang, A. de Wit, and H. Yang, 2017: Global gridded crop model evaluation: Benchmarking, skills, deficiencies and implications. Geoscientific Model Development, 10 (4), 1403–1422. doi:10.5194/gmd-10-1403-2017. ↩
  • NACUBO, 2012: Higher Education: Leading the Nation to a Safe and Secure Energy Future. National Association of College and University Business Officers (NACUBO) and Second Nature, Washington, DC and Boston, MA, 15 pp. URL. ↩
  • NAS, 2015: Climate Intervention: Carbon Dioxide Removal and Reliable Sequestration. The National Academies Press, Washington, DC, 154 pp. doi:10.17226/18805. ↩
  • National Academies of Sciences Engineering and Medicine, 2017: Valuing Climate Damages: Updating Estimation of the Social Cost of Carbon Dioxide. The National Academies Press, Washington, DC, doi:10.17226/24651. ↩
  • National Trust for Historic Preservation, 2015: High water and high stakes: Cultural resources and climate change. Forum Journal, 29 (4), 1–66. URL. ↩
  • Neumann, J. E., K. Emanuel, S. Ravela, L. Ludwig, P. Kirshen, K. Bosma, and J. Martinich, 2015: Joint effects of storm surge and sea-level rise on US Coasts: New economic estimates of impacts, adaptation, and benefits of mitigation policy. Climatic Change, 129 (1), 337–349. doi:10.1007/s10584-014-1304-z. ↩
  • New York State Department of Public Service, 2016: Staff's responsive proposal for preserving zero-emissions attributes. New York State Department of Public Service, Albany, NY, 11 pp. URL. ↩
  • Norton-Smith, K., K. Lynn, K. Chief, K. Cozzetto, J. Donatuto, M. H. Redsteer, L. E. Kruger, J. Maldonado, C. Viles, and K. P. Whyte, 2016: Climate Change and Indigenous Peoples: A Synthesis of Current Impacts and Experiences. Gen. Tech. Rep. PNW-GTR-944. U.S. Department of Agriculture, Forest Service, Pacific Northwest Research Station, Portland, OR, 136 pp. URL. ↩
  • O'Neill, B. C., J. M. Done, A. Gettelman, P. Lawrence, F. Lehner, J.-F. Lamarque, L. Lin, A. J. Monaghan, K. Oleson, X. Ren, B. M. Sanderson, C. Tebaldi, M. Weitzel, Y. Xu, B. Anderson, M. J. Fix, and S. Levis, 2017: The Benefits of Reduced Anthropogenic Climate changE (BRACE): A synthesis. Climatic Change, doi:10.1007/s10584-017-2009-x. ↩
  • OECD, 2015: The Economic Consequences of Climate Change. OECD (Organisation for Economic Co-operation and Development) Publishing, Paris, 140 pp. pp. doi:10.1787/9789264235410-en. ↩
  • Patiño, R., D. Dawson, and M. M. VanLandeghem, 2014: Retrospective analysis of associations between water quality and toxic blooms of golden alga (Prymnesium parvum) in Texas reservoirs: Implications for understanding dispersal mechanisms and impacts of climate change. Harmful Algae, 33, 1–11. doi:10.1016/j.hal.2013.12.006. ↩
  • Pendleton, L. H., O. Hoegh-Guldberg, C. Langdon, and A. Comte, 2016: Multiple stressors and ecological complexity require a new approach to coral reef research. Frontiers in Marine Science, 3, article 36. doi:10.3389/fmars.2016.00036. ↩
  • Pendleton, L., A. Comte, C. Langdon, J. A. Ekstrom, S. R. Cooley, L. Suatoni, M. W. Beck, L. M. Brander, L. Burke, J. E. Cinner, C. Doherty, P. E. T. Edwards, D. Gledhill, L.-Q. Jiang, R. J. van Hooidonk, L. Teh, G. G. Waldbusser, and J. Ritter, 2016: Coral reefs and people in a high-CO2 world: Where can science make a difference to people? PLOS ONE, 11 (11), e0164699. doi:10.1371/journal.pone.0164699. ↩
  • Pindyck, R. S., 2017: The use and misuse of models for climate policy. Review of Environmental Economics and Policy, 11 (1), 100–114. doi:10.1093/reep/rew012. ↩
  • Revesz, R. L., P. H. Howard, K. Arrow, L. H. Goulder, R. E. Kopp, M. A. Livermore, M. Oppenheimer, and T. Sterner, 2014: Global warming: Improve economic models of climate change. Nature, 508, 173–175. doi:10.1038/508173a. ↩
  • Rockman, M., M. Morgan, S. Ziaja, G. Hambrecht, and A. Meadow, 2016: Cultural Resources Climate Change Strategy. Cultural Resources, Partnerships, and Science and Climate Change Response Program, National Park Service, Washington, DC, URL. ↩
  • Rose, S. K., D. B. Diaz, and G. J. Blanford, 2017: Understanding the social cost of carbon: A model diagnostic and inter-comparison study. Climate Change Economics, 08 (02), 1750009. doi:10.1142/s2010007817500099. ↩
  • Rosenzweig, C., J. Elliott, D. Deryng, A. C. Ruane, C. Müller, A. Arneth, K. J. Boote, C. Folberth, M. Glotter, N. Khabarov, K. Neumann, F. Piontek, T. A. M. Pugh, E. Schmid, E. Stehfest, H. Yang, and J. W. Jones, 2014: Assessing agricultural risks of climate change in the 21st century in a global gridded crop model intercomparison. Proceedings of the National Academy of Sciences of the United States of America, 111 (9), 3268–3273. doi:10.1073/pnas.1222463110. ↩
  • Rosenzweig, C., W. Solecki, A. DeGaetano, M. O'Grady, S. Hassol, and P. Grabhorn, Eds., 2011: Responding to climate change in New York state: The ClimAID integrated assessment for effective climate change adaptation. Technical report. NYSERDA Report 11-18. Albany, NY, 149 pp. URL. ↩
  • Saari, R. K., N. E. Selin, S. Rausch, and T. M. Thompson, 2015: A self-consistent method to assess air quality co-benefits from U.S. climate policies. Journal of the Air & Waste Management Association, 65 (1), 74–89. doi:10.1080/10962247.2014.959139. ↩
  • Sarofim, M. C., S. Saha, M. D. Hawkins, D. M. Mills, J. Hess, R. Horton, P. Kinney, J. Schwartz, and A. St. Juliana, 2016: Ch. 2: Temperature-related death and illness. The Impacts of Climate Change on Human Health in the United States: A Scientific Assessment., U.S. Global Change Research Program, Washington, DC, 43–68. doi:10.7930/J0MG7MDX. ↩
  • Schuur, E. A. G., A. D. McGuire, C. Schadel, G. Grosse, J. W. Harden, D. J. Hayes, G. Hugelius, C. D. Koven, P. Kuhry, D. M. Lawrence, S. M. Natali, D. Olefeldt, V. E. Romanovsky, K. Schaefer, M. R. Turetsky, C. C. Treat, and J. E. Vonk, 2015: Climate change and the permafrost carbon feedback. Nature, 520 (7546), 171–179. doi:10.1038/nature14338. ↩
  • Searchinger, T., R. Edwards, D. Mulligan, R. Heimlich, and R. Plevin, 2015: Do biofuel policies seek to cut emissions by cutting food? Science, 347 (6229), 1420–1422. doi:10.1126/science.1261221. ↩
  • Second Nature, 2018: Second Nature Reporting Platform [web tool]. Second Nature Inc., Boston, MA,  accessed March 30. URL. ↩
  • Shindell, D., G. Faluvegi, K. Seltzer, and C. Shindell, 2018: Quantified, localized health benefits of accelerated carbon dioxide emissions reductions. Nature Climate Change, 8 (4), 291–295. doi:10.1038/s41558-018-0108-y. ↩
  • Shindell, D., J. C. I. Kuylenstierna, E. Vignati, R. van Dingenen, M. Amann, Z. Klimont, S. C. Anenberg, N. Muller, G. Janssens-Maenhout, F. Raes, J. Schwartz, G. Faluvegi, L. Pozzoli, K. Kupiainen, L. Hoglund-Isaksson, L. Emberson, D. Streets, V. Ramanathan, K. Hicks, N. T. K. Oanh, G. Milly, M. Williams, V. Demkine, and D. Fowler, 2012: Simultaneously mitigating near-term climate change and improving human health and food security. Science, 335 (6065), 183–189. doi:10.1126/science.1210026. ↩
  • Smith, P., S. J. Davis, F. Creutzig, S. Fuss, J. Minx, B. Gabrielle, E. Kato, R. B. Jackson, A. Cowie, E. Kriegler, D. P. van Vuuren, J. Rogelj, P. Ciais, J. Milne, J. G. Canadell, D. McCollum, G. Peters, R. Andrew, V. Krey, G. Shrestha, P. Friedlingstein, T. Gasser, A. Grubler, W. K. Heidug, M. Jonas, C. D. Jones, F. Kraxner, E. Littleton, J. Lowe, J. R. Moreira, N. Nakicenovic, M. Obersteiner, A. Patwardhan, M. Rogner, E. Rubin, A. Sharifi, A. Torvanger, Y. Yamagata, J. Edmonds, and C. Yongsung, 2016: Biophysical and economic limits to negative CO2 emissions. Nature Climate Change, 6, 42–50. doi:10.1038/nclimate2870. ↩
  • Stern, N., 2013: The structure of economic modeling of the potential impacts of climate change: Grafting gross underestimation of risk onto already narrow science models. Journal of Economic Literature, 51 (3), 838–859. doi:10.1257/jel.51.3.838. ↩
  • Stern, N., 2016: Economics: Current climate models are grossly misleading. Nature, 530, 407–409. doi:10.1038/530407a. ↩
  • Su, J. G., Y.-Y. Meng, M. Pickett, E. Seto, B. Ritz, and M. Jerrett, 2016: Identification of effects of regulatory actions on air quality in goods movement corridors in California. Environmental Science & Technology, 50 (16), 8687–8696. doi:10.1021/acs.est.6b00926. ↩
  • Sweet, W. V., R. Horton, R. E. Kopp, A. N. LeGrande, and A. Romanou, 2017: Sea Level Rise. Climate Science Special Report: Fourth National Climate Assessment, Volume I. Wuebbles, D. J., D. W. Fahey, K. A. Hibbard, D. J. Dokken, B. C. Stewart, and T. K. Maycock, Eds., U.S. Global Change Research Program, Washington, DC, USA, 333–363. doi:10.7930/J0VM49F2. ↩
  • Taylor, L. L., J. Quirk, R. M. S. Thorley, P. A. Kharecha, J. Hansen, A. Ridgwell, M. R. Lomas, S. A. Banwart, and D. J. Beerling, 2016: Enhanced weathering strategies for stabilizing climate and averting ocean acidification. Nature Climate Change, 6, 402–406. doi:10.1038/nclimate2882. ↩
  • Taylor, P. C., W. Maslowski, J. Perlwitz, and D. J. Wuebbles, 2017: Arctic Changes and their Effects on Alaska and the Rest of the United States. Climate Science Special Report: Fourth National Climate Assessment, Volume I. Wuebbles, D. J., D. W. Fahey, K. A. Hibbard, D. J. Dokken, B. C. Stewart, and T. K. Maycock, Eds., U.S. Global Change Research Program, Washington, DC, USA, 303–332. doi:10.7930/J00863GK. ↩
  • The World Bank, 2018: Carbon pricing dashboard [web tool]. The World Bank, Washington, DC,  accessed March 28. URL. ↩
  • Thompson, T. M., S. Rausch, R. K. Saari, and N. E. Selin, 2014: A systems approach to evaluating the air quality co-benefits of US carbon policies. Nature Climate Change, 4, 917–923. doi:10.1038/nclimate2342. ↩
  • U.S. Climate Alliance, 2018: United States Climate Alliance: States United for Climate Action [web site]. U.S. Climate Alliance, . URL. ↩
  • U.S. Department of State, 2016: Second Biennial Report of the United States of America. U.S. State Department, Washington, DC, 75 pp. URL. ↩
  • Underwood, B. S., Z. Guido, P. Gudipudi, and Y. Feinberg, 2017: Increased costs to US pavement infrastructure from future temperature rise. Nature Climate Change, 7, 704. doi:10.1038/nclimate3390. ↩
  • UNFCCC, 2015: Paris Agreement. United Nations Framework Convention on Climate Change, [Bonn, Germany], 25 pp. URL. ↩
  • UNFCCC, 2018: Paris Agreement—Status of ratification. United Nations Framework Convention on Climate Change, Bonn, Germany, URL. ↩
  • Urban, D. W., J. Sheffield, and D. B. Lobell, 2015: The impacts of future climate and carbon dioxide changes on the average and variability of US maize yields under two emission scenarios. Environmental Research Letters, 10 (4), 045003. doi:10.1088/1748-9326/10/4/045003. ↩
  • Urban, M. C., 2015: Accelerating extinction risk from climate change. Science, 348 (6234), 571–573. doi:10.1126/science.aaa4984. ↩
  • Urban, N. M., P. B. Holden, N. R. Edwards, R. L. Sriver, and K. Keller, 2014: Historical and future learning about climate sensitivity. Geophysical Research Letters, 41 (7), 2543–2552. doi:10.1002/2014GL059484. ↩
  • USGCRP, 2017: Climate Science Special Report: Fourth National Climate Assessment, Volume I. Wuebbles, D. J., D. W. Fahey, K. A. Hibbard, D. J. Dokken, B. C. Stewart, and T. K. Maycock, Eds. U.S. Global Change Research Program, Washington, DC, USA, 470 pp. doi:10.7930/J0J964J6. ↩
  • USGCRP, 2018: Second State of the Carbon Cycle Report (SOCCR2): A Sustained Assessment Report. U.S. Global Change Research Program, Washington, DC, 877 pp. URL. ↩
  • van Hooidonk, R., J. Maynard, J. Tamelander, J. Gove, G. Ahmadia, L. Raymundo, G. Williams, S. F. Heron, and S. Planes, 2016: Local-scale projections of coral reef futures and implications of the Paris Agreement. Scientific Reports, 6, 39666. doi:10.1038/srep39666. ↩
  • Warren, R., J. VanDerWal, J. Price, J. A. Welbergen, I. Atkinson, J. Ramirez-Villegas, T. J. Osborn, A. Jarvis, L. P. Shoo, S. E. Williams, and J. Lowe, 2013: Quantifying the benefit of early climate change mitigation in avoiding biodiversity loss. Nature Climate Change, 3, 678–682. doi:10.1038/nclimate1887. ↩
  • Watkiss, P., 2015: A review of the economics of adaptation and climate-resilient development. Centre for Climate Change Economics and Policy Working Paper No. 231 and Grantham Research Institute on Climate Change and the Environment Working Paper No. 205. Centre for Climate Change Economics and Policy (CCCEP) and Grantham Research Institute on Climate Change and the Environment, 41 pp. URL. ↩
  • West, J. J., S. J. Smith, R. A. Silva, V. Naik, Y. Zhang, Z. Adelman, M. M. Fry, S. Anenberg, L. W. Horowitz, and J.-F. Lamarque, 2013: Co-benefits of mitigating global greenhouse gas emissions for future air quality and human health. Nature Climate Change, 3 (10), 885–889. doi:10.1038/nclimate2009. ↩
  • Weyant, J., 2017: Some contributions of integrated assessment models of global climate change. Review of Environmental Economics and Policy, 11 (1), 115–137. doi:10.1093/reep/rew018. ↩
  • Wiens, J., J. Fargione, and J. Hill, 2011: Biofuels and biodiversity. Ecological Applications, 21 (4), 1085–1095. doi:10.1890/09-0673.1. ↩
  • Wiser, R., T. Mai, D. Millstein, G. Barbose, L. Bird, J. Heeter, D. Keyser, V. Krishnan, and J. Macknick, 2017: Assessing the costs and benefits of US renewable portfolio standards. Environmental Research Letters, 12 (9), 094023. doi:10.1088/1748-9326/aa87bd. ↩
  • Wobus, C., E. E. Small, H. Hosterman, D. Mills, J. Stein, M. Rissing, R. Jones, M. Duckworth, R. Hall, M. Kolian, J. Creason, and J. Martinich, 2017: Projected climate change impacts on skiing and snowmobiling: A case study of the United States. Global Environmental Change, 45, 1–14. doi:10.1016/j.gloenvcha.2017.04.006. ↩
  • World Resources Institute, 2018: CAIT Climate Data Explorer [web tool]. World Resources Institute, Washington, DC,  accessed April 11. URL. ↩
  • Wuebbles, D. J., D. W. Fahey, K. A. Hibbard, B. DeAngelo, S. Doherty, K. Hayhoe, R. Horton, J. P. Kossin, P. C. Taylor, A. M. Waple, and C. P. Weaver, 2017: Executive summary. Climate Science Special Report: Fourth National Climate Assessment, Volume I. Wuebbles, D. J., D. W. Fahey, K. A. Hibbard, D. J. Dokken, B. C. Stewart, and T. K. Maycock, Eds., U.S. Global Change Research Program, Washington, DC, USA, 12–34. doi:10.7930/J0DJ5CTG. ↩
  • Yang, J., Z.-H. Wang, and K. E. Kaloush, 2015: Environmental impacts of reflective materials: Is high albedo a “silver bullet” for mitigating urban heat island? Renewable and Sustainable Energy Reviews, 47, 830–843. doi:10.1016/j.rser.2015.03.092. ↩
  • Yuksel, T., M.-A. M. Tamayao, C. Hendrickson, I. M. L. Azevedo, and J. J. Michalek, 2016: Effect of regional grid mix, driving patterns and climate on the comparative carbon footprint of gasoline and plug-in electric vehicles in the United States. Environmental Research Letters, 11 (4), 044007. doi:10.1088/1748-9326/11/4/044007. ↩
  • Zapata, C. B., C. Yang, S. Yeh, J. Ogden, and M. J. Kleeman, 2018: Low-carbon energy generates public health savings in California. Atmospheric Chemistry and Physics, 18 (7), 4817–4830. doi:10.5194/acp-18-4817-2018. ↩
  • ZEV, 2018: Multi-State ZEV Task Force [web site]. Multi-State ZEV (Zero-Emission Vehicle) Task Force, . URL. ↩
  • Zhang, Y., S. J. Smith, J. H. Bowden, Z. Adelman, and J. J. West, 2017: Co-benefits of global, domestic, and sectoral greenhouse gas mitigation for US air quality and human health in 2050. Environmental Research Letters, 12 (11), 114033. doi:10.1088/1748-9326/aa8f76 . ↩
  • Ürge-Vorsatz, D., S. T. Herrero, N. K. Dubash, and F. Lecocq, 2014: Measuring the co-benefits of climate change mitigation. Annual Review of Environment and Resources, 39 (1), 549–582. doi:10.1146/annurev-environ-031312-125456. ↩

External Link External Link

You are leaving The Fourth National Climate Assessment and will be redirected to a new site in 5 seconds.

USGCRP Globalchange.gov earth logo

13 Logos #1 13 Logos #2

U.S. Global Change Research Program
1800 G Street, NW, Suite 9100, Washington, DC 20006 USA
Tel: +1 202.223.6262 | Fax: +1 202.223.3065

Contact Us • Credits • Privacy Policy • Site Map

Some figures and images are copyright protected.
Permission of the copyright owner must be obtained
before making use of copyrighted material.