NCA4 A3: Tools
  • ABOUT
    About this Report Guide to this Report Report Credits
  • CHAPTERS

    Front Matter

    • About this Report
    • Guide to the Report
    Summary Findings
    1. Overview

    National Topics

    1. Our Changing Climate
    2. Water
    3. Energy Supply, Delivery & Demand
    4. Land Cover & Land-Use Change
    5. Forests
    6. Ecosystems, Ecosystem Services, & Biodiversity
    7. Coastal Effects
    8. Oceans & Marine Resources
    9. Agriculture & Rural Communities
    10. Built Environment, Urban Systems, & Cities
    11. Transportation

    National Topics (cont.)

    1. Air Quality
    2. Human Health
    3. Tribes & Indigenous Peoples
    4. Climate Effects on U.S. International Interests
    5. Sector Interactions, Multiple Stressors, & Complex Systems

    Regions

    1. Northeast
    2. Southeast
    3. U.S. Caribbean
    4. Midwest
    5. Northern Great Plains
    6. Southern Great Plains
    7. Northwest
    8. Southwest
    9. Alaska
    10. Hawai‘i & U.S.-Affiliated Pacific Islands

    Responses

    1. Reducing Risks Through Adaptation Actions
    2. Reducing Risks Through Emissions Mitigation

    Appendices

    1. Report Development Process
    2. Information in the Fourth National Climate Assessment
    3. Data Tools & Scenario Products
    4. Looking Abroad
    5. Frequently Asked Questions
  • DOWNLOADS
    View All Report Downloads Full Chapter PDF Chapter Figures (.zip) Chapter Bibliography (RIS)
A3: Tools
×

FOURTH NATIONAL CLIMATE ASSESSMENT

DATA TOOLS AND SCENARIO PRODUCTS

  • SECTIONS
  • Introduction
  • Scenario Products
  • Indicators
  • Climate Resilience Toolkit
  • Global Change Information System
  • NOAA State Climate Summaries
  • References

APPENDIX 3
Data Tools and Scenario Products

Introduction

Federal Coordinating Lead Author:
David Reidmiller, U.S. Global Change Research Program
Lead Author:
Christopher W. Avery, U.S. Global Change Research Program
Contributing Authors:
Michael Kolian, U.S. Environmental Protection Agency
Kenneth E. Kunkel, North Carolina State University
David Herring, National Oceanic and Atmospheric Administration
Reid Sherman, U.S. Global Change Research Program/Straughan Environmental
William V. Sweet, National Oceanic and Atmospheric Administration
Kathryn Tipton, U.S. Global Change Research Program/ICF
Christopher Weaver, U.S. Environmental Protection Agency

<strong>Avery</strong>, C.W., D.R. Reidmiller, M. Kolian, K.E. Kunkel, D. Herring, R. Sherman, W.V. Sweet, K. Tipton, and C. Weaver, 2018: Data Tools and Scenario Products. In <em>Impacts, Risks, and Adaptation in the United States: Fourth National Climate Assessment, Volume II</em> [Reidmiller, D.R., C.W. Avery, D.R. Easterling, K.E. Kunkel, K.L.M. Lewis, T.K. Maycock, and B.C. Stewart (eds.)]. U.S. Global Change Research Program, Washington, DC, USA, pp. 1413–1430. doi: <a href='http://doi.org/10.7930/NCA4.2018.AP3'>10.7930/NCA4.2018.AP3</a>

  • Climate Science Special Report
  • NOAA Technical Report NESDIS TR144
  • Scenarios for the National Climate Assessment
  • State Climate Summaries
  • USGCRP Indicators

To enable National Climate Assessment (NCA) authors to do the in-depth analysis necessary to make the Fourth National Climate Assessment (NCA4) most useful, the U.S. Global Change Research Program (USGCRP) provided author teams with an array of data tools and scenario products. This appendix contains additional information on some of the materials available to NCA4 authors in developing their chapters. While designed in part with NCA4 authors in mind, this suite of “Tools for Informed Decision-Making” is intended to support the day-to-day work of resource managers, community planners, and scientists across the country.

Tools Within the Sustained Assessment Process

Since the completion of the Third National Climate Assessment (NCA3) in 2014,1 a major focus of work among USGCRP and its affiliated agencies has been to establish a process to continually add to and improve the knowledge and resources available to decision-makers seeking to address climate risks. The motivation for and benefit from that process is to evolve the NCA from being a periodic snapshot of the state of climate science into a sustained effort that is not only responsive to changing conditions but also allows for the continuing incorporation of newly developed products and research. Beyond being useful for NCA4 authors, these tools also represent a mechanism for ongoing development and updating of materials. Such a continuous process could make assessment products more valuable for connecting research with decision-making, thus facilitating evaluation of the state of knowledge and establishing rigorous ways of documenting and responding to changes over time.

Scenario Products

Scenarios are coherent, internally consistent, and plausible descriptions of possible future states of the world. Scenarios may be quantitative, qualitative, or both. The components of a scenario are often linked by an overarching logic, such as a qualitative narrative of how the future may evolve.

Overview

The USGCRP is mandated to “assist the Nation and the world to understand, assess, predict, and respond to human-induced and natural processes of global change.” To fulfill this mandate, the NCA evaluates risks that climate and global change pose to the United States. This entails addressing specific questions about what is at risk in a particular region or sector and how it might be affected in different potential futures. Scenarios that span a range of plausible future changes in key environmental parameters, such as weather and climate extremes, sea level, population, and land use, can help carry this out. USGCRP has therefore coordinated the development of a set of scenario products, accessible at https://scenarios.globalchange.gov/, to support NCA4 development. Specifically, NCA4 authors have been provided with a suite of high-resolution (downscaled) scenario products for the United States, covering (at least) the entire 21st century, to support chapter development.

Selection of Representative Concentration Pathways

NCA4 authors have grounded their assessment in an analysis of the widely-used scenarios termed “Representative Concentration Pathways,” or RCPs, that form the foundation for the majority of recent coordinated global climate model experiments. (RCPs are also discussed in this report’s Front Matter.) Consistent with previous NCAs, NCA4 relies in part on climate scenarios and modeling efforts generated for the Intergovernmental Panel on Climate Change (IPCC) assessments. In May 2015, USGCRP released a memo outlining the decisions regarding climate-related scenarios and the rationale around them.2 Specifically, USGCRP decided to use the RCPs3,4 and associated model results from the Climate Model Intercomparison Project Phase 5 (CMIP5)5 that underpinned the IPCC 5th Assessment Report (AR5), completed in 2013–2014.

The CMIP model results, as driven by the RCP scenarios, have similarly become standard reference inputs for virtually all work in the United States and internationally concerning climate change science, impacts, vulnerability, adaptation, and mitigation. It is, therefore, reasonable, practical, and in line with the expectations of the research community for NCA4 to use the most recently available model outputs from CMIP5, associated with the RCPs. CMIP5 climate data were widely available during the development of NCA4; products from the next phase of the CMIP project (CMIP6) were not available in time to support NCA4.

USGCRP further decided that NCA4 would focus primarily on RCP8.5 and RCP4.5 for framing purposes, while also considering other scenario information where appropriate (for example, RCP2.6). These RCPs capture a range of plausible atmospheric concentration futures that drive climate models. RCP8.5 is the high-end scenario (high emissions, high concentrations, large temperature increase) in the IPCC’s AR5; it likewise serves as the high-end scenario for NCA4, similar to the use of IPCC’s 4th Assessment Report (AR4) Special Report on Emissions Scenarios (SRES) A2 scenario in NCA3.6 RCP4.5 is not the lowest scenario in AR5, but it is similar to the AR4 SRES low-end B1 scenario that was used in NCA3. RCP2.6 represents the low end of the range considered by AR5, but it also assumes significantly greater emissions reductions, even for current and near-term emissions, than previous low-end scenarios used by the IPCC. The range represented by RCP8.5 and RCP4.5, therefore, provides the most continuity and consistency with the IPCC scenarios used for framing purposes by the previous NCA3.

As simulated in CMIP5, all of the RCPs result in similar global temperature and sea level rise outcomes for the next few decades. However, by mid-century and beyond, differences between RCPs have a substantial effect on the climate and impact outcomes (see Ch. 2: Climate, Figure 2.2). The choice to focus on RCP8.5 and RCP4.5 for impacts, adaptation, and vulnerability analyses allows for an evaluation of near-term concerns for the nation, as well as a robust and wide range of longer-term outcomes relative to the present.

Because RCPs intentionally focus on the outputs that are in turn fed into climate models (namely atmospheric concentrations), a wide range of future assumptions about underlying socioeconomic conditions, both at the global and national scale (for example, population growth, technological innovation, and carbon intensity of the energy mix), could plausibly be consistent with each of the RCPs used in NCA4. For this reason, further guidance on U.S. population and land-use assumptions was provided to authors, as discussed in the Products section of this chapter. Nevertheless, each RCP was developed by a separate modeling team;4 for illustration, some of the assumptions in those modeling runs include

  • The range of future global population projections within the RCPs falls within the range of the low and high United Nations population projections from 2003.

  • The range of global gross domestic product (GDP) projections within the RCPs falls within the range of the 90th-percentile range of GDP scenarios found in the literature available prior to publication of the RCPs.

  • RCP2.6, RCP4.5, and RCP6.0 represent intermediate scenarios from the literature, resulting in primary energy use of 750 to 900 EJ (exajoules) in 2100 or about double recent levels; RCP8.5 is a much more energy-intensive scenario.

  • Because of assumptions about future viability of carbon capture and storage (CCS) technologies, all scenarios use greater amounts of coal and/or natural gas than in the year 2000.

  • An important element of RCP2.6 is the use of bio-energy in combination with CCS, resulting in negative emissions by the end of century.

  • All RCPs assume increasingly stringent air pollution control policies.

Comparing outcomes under RCP8.5 with those of RCP4.5 (and RCP2.6 in some cases) not only captures a range of uncertainties and plausible futures but also provides information about the potential benefits of mitigation. Comparing outcomes under the two pathways shows the degree to which significant emissions mitigation at the global scale can avoid some impacts and inform adaptation choices to the risks that are present even at the low-end scenario. The scenario range allows for an assessment of impacts at a variety of temperature thresholds.

Products

Overview

As noted earlier, NCA4 authors were provided with a suite of high-resolution (downscaled) scenario products for the United States, covering at least the entire 21st century, to assist them in the development of their chapters (hosted at https://scenarios.globalchange.gov). These included

  • changes in the averages and extremes of key climate variables (for example, temperature and precipitation),

  • relative sea level rise along the entire U.S. coastline,

  • population change as a function of demographic shifts and migration, and

  • changes in developed land use driven by these population changes.

Authors were encouraged to use the provided scenario products to help ensure consistency in underlying assumptions and to improve the ability to compare and synthesize across chapters. Authors used these scenario products to frame uncertainty in future climate as it related to the regional and sectoral risks that were the focus of their chapters—both uncertainty as a result of considering multiple RCPs and uncertainty due to limitations in our understanding of key climate system processes or our ability to fully represent these processes in earth system models.

To better assist the author teams in meeting their needs, and to reduce the potentially large volume of underlying scenario products from which the authors could potentially draw, NCA4 authors were encouraged to think of the scenario products as being grouped into the following three USGCRP scenarios: “Lower,” “Higher,” and “Upper Bound” departures from current conditions (Table A3.1).

Download CSV
Download JSON
View in GCIS

Table A3.1: USGCRP Scenarios

Scenario Inputs Lower Scenario Higher Scenario Upper Bound Scenario
temperature means/extremes RCP4.5 ensemble mean RCP8.5 ensemble mean 95th percentile of RCP8.5
precipitation means/extremes RCP4.5 ensemble mean RCP8.5 ensemble mean 95th percentile of RCP8.5
sea level rise “Intermediate-Low” “Intermediate” “Extreme”
population “lower” (SSP2) “higher” (SSP5) “higher” (SSP5)
development land use “lower” (SSP2) “higher” (SSP5) “higher” (SSP5)
Table A3.1: Scenario products are organized into three USGCRP scenarios based on their departure from current conditions. The Shared Socioeconomic Pathways (SSPs) are described in greater detail later in this chapter.

For example, given this assessment’s emphasis on using a risk-based framework, authors were asked to consider low-probability, high-consequence climate futures. Addressing this potential future, in addition to more probable futures, is facilitated by considering the Upper Bound USGCRP scenario. These outcomes will often pose the greatest risks to society and thus must be considered in any comprehensive risk assessment.

Similarly, the authors were asked to consider how future trends in other critical, non-climatic stressors, including population growth and land-use change, may interact with climate change to exacerbate (or alleviate) climate-related risks. Authors have, therefore, been provided with scenarios of these additional drivers, grouped with the climate-related scenarios under the “Lower,” “Higher,” and “Upper Bound” USGCRP scenarios (see Ch. 17: Complex Systems for additional discussion on how non-climatic stressors can exacerbate climate-related risks).

Authors have used these scenario products to support a range of tasks within individual NCA4 chapters. Many chapters use scenario products for broad needs, such as general context-setting to illustrate a range of possible future outcomes in key drivers of risk and determinants of vulnerability. Others have applied them to bound the envelope of scientifically plausible future climate change in assessing regional or sectoral risks. Still others have used scenarios to place existing literature into the context of a consistent, coordinated set of possible future conditions in order to facilitate improved synthesis. All of these applications are valuable uses of these scenario products for both the NCA and its users.

Downscaled Climate Information

Driven by stakeholder feedback and input seeking information about potential future climate change at much finer spatial scales than is typically generated by the state-of-the-art global climate models (which have horizontal resolutions on the order of 100 km, or about 62 miles), NCA4 authors were provided with CMIP5 model outputs that had been downscaled to finer scales using the LOcalized Constructed Analogs (LOCA) methodology.7

The LOCA method is a statistical technique to downscale climate model output to a smaller spatial scale, providing a much finer geographical resolution for analysis. In the LOCA method, the local simulated climate model field for each day is matched to examples in historical observations that resemble the climate model spatial distribution, called analog days. Since historical observations are sufficiently dense to represent local features, the resulting dataset provides a realistic representation of the local variability suitable for many impacts analyses..

Previous methods that utilized the same basic approach identified a set of days (typically 30) that resemble the climate model field over a large region and produced the downscaled field through an optimal weighting of the entire set of analog days.8 The LOCA method improves on these earlier methods in several ways. First, the analog days are chosen separately for local regions, thus providing a more realistic choice of analog days at the local scale. Second, for most of the local region, the single analog day best matching the climate model simulation is used for downscaling, rather than averaging a set of days. This produces a better representation of extreme events.

The LOCA data include 32 CMIP5 models covering the 1950–2100 period, including the historical period of 1950–2005, as well as a higher scenario (RCP8.5) and a lower scenario (RCP4.5) for 2006–2100. The LOCA data include maximum temperature, minimum temperature, and precipitation at a daily resolution and at 1/16th-degree spatial resolution. The spatial coverage is the continental United States, southern Canada, and northern Mexico. LOCA data were not completely available for the U.S. Caribbean, Alaska, or Hawai‘i and U.S.-Affiliated Pacific Islands regions for NCA4, but extending LOCA to include these locations is an area of active research.

Sea Level Rise Scenarios

The Federal Interagency Sea Level Rise and Coastal Flood Hazard Scenarios and Tools Task Force, a joint task force of the National Ocean Council (NOC) and USGCRP, was charged with developing and disseminating future sea level rise and associated coastal flood hazard scenarios and tools for the entire United States to support coastal preparedness planning and risk management processes.

Two key subtasks of the overall Task Force effort were to 1) develop updated scenarios of global mean sea level (GMSL), and 2) regionalize these global scenarios for the entire U.S. coastline, to serve both as inputs into assessments of potential vulnerabilities and risks in the coastal environment and as key technical inputs into NCA4. In order to bound the set of GMSL rise scenarios for year 2100, the Task Force assessed the most up-to-date scientific literature on scientifically supported upper-end GMSL projections, including recent observational and modeling literature related to the potential for rapid ice melt in Greenland and Antarctica.


Figure A3.1: Global Mean Sea Level Rise Scenarios

Global Mean Sea Level Rise Scenarios
A line graph illustrates historical and projected global average sea level rise (in feet and meters) from 1800 to 2100. Projections for six global average sea level rise scenarios that describe the full range of future possible scenarios, from Low (a half foot or 0.3 meters) to Extreme (8 feet or 2.4 meters) sea level rise, are shown. These are represented by six lines of increasing steepness extending outward from the historical line at the year 2000. Projections for the very likely range in sea level rise under the very low RCP2.6, low RCP4.5, and high RCP8.5 scenarios are also shown and are represented by three vertical box and whisker plots to the right of the x-axis. Historically, sea level has remained fairly constant but has risen by about a half foot (0.3 meters) since 1900. By 2100, global average sea level is expected to rise nearly 1 to 3 feet (0.3 to 0.9 meters) under a very low scenario, 1 to nearly 5 feet (0.3 to 1.5 meters) under a low scenario, and nearly 2 to 8 feet (0.6 to 2.4 meters) under a high scenario.
Figure A3.1: The figure shows observed (black and orange lines) and projected changes in global mean (average) sea level rise for 1800–2100. The projected changes are from six global average sea level scenarios developed for an interagency technical report.9 The boxes on the right show the very likely ranges in sea level rise by 2100 (relative to 2000) corresponding to the three different RCP scenarios. The lines above the boxes show possible increases based on the newest research of the potential contribution to sea level rise from Antarctic ice melt. Source: Ch. 2: Climate, Figure 2.3, adapted from Sweet et al. 2017.9
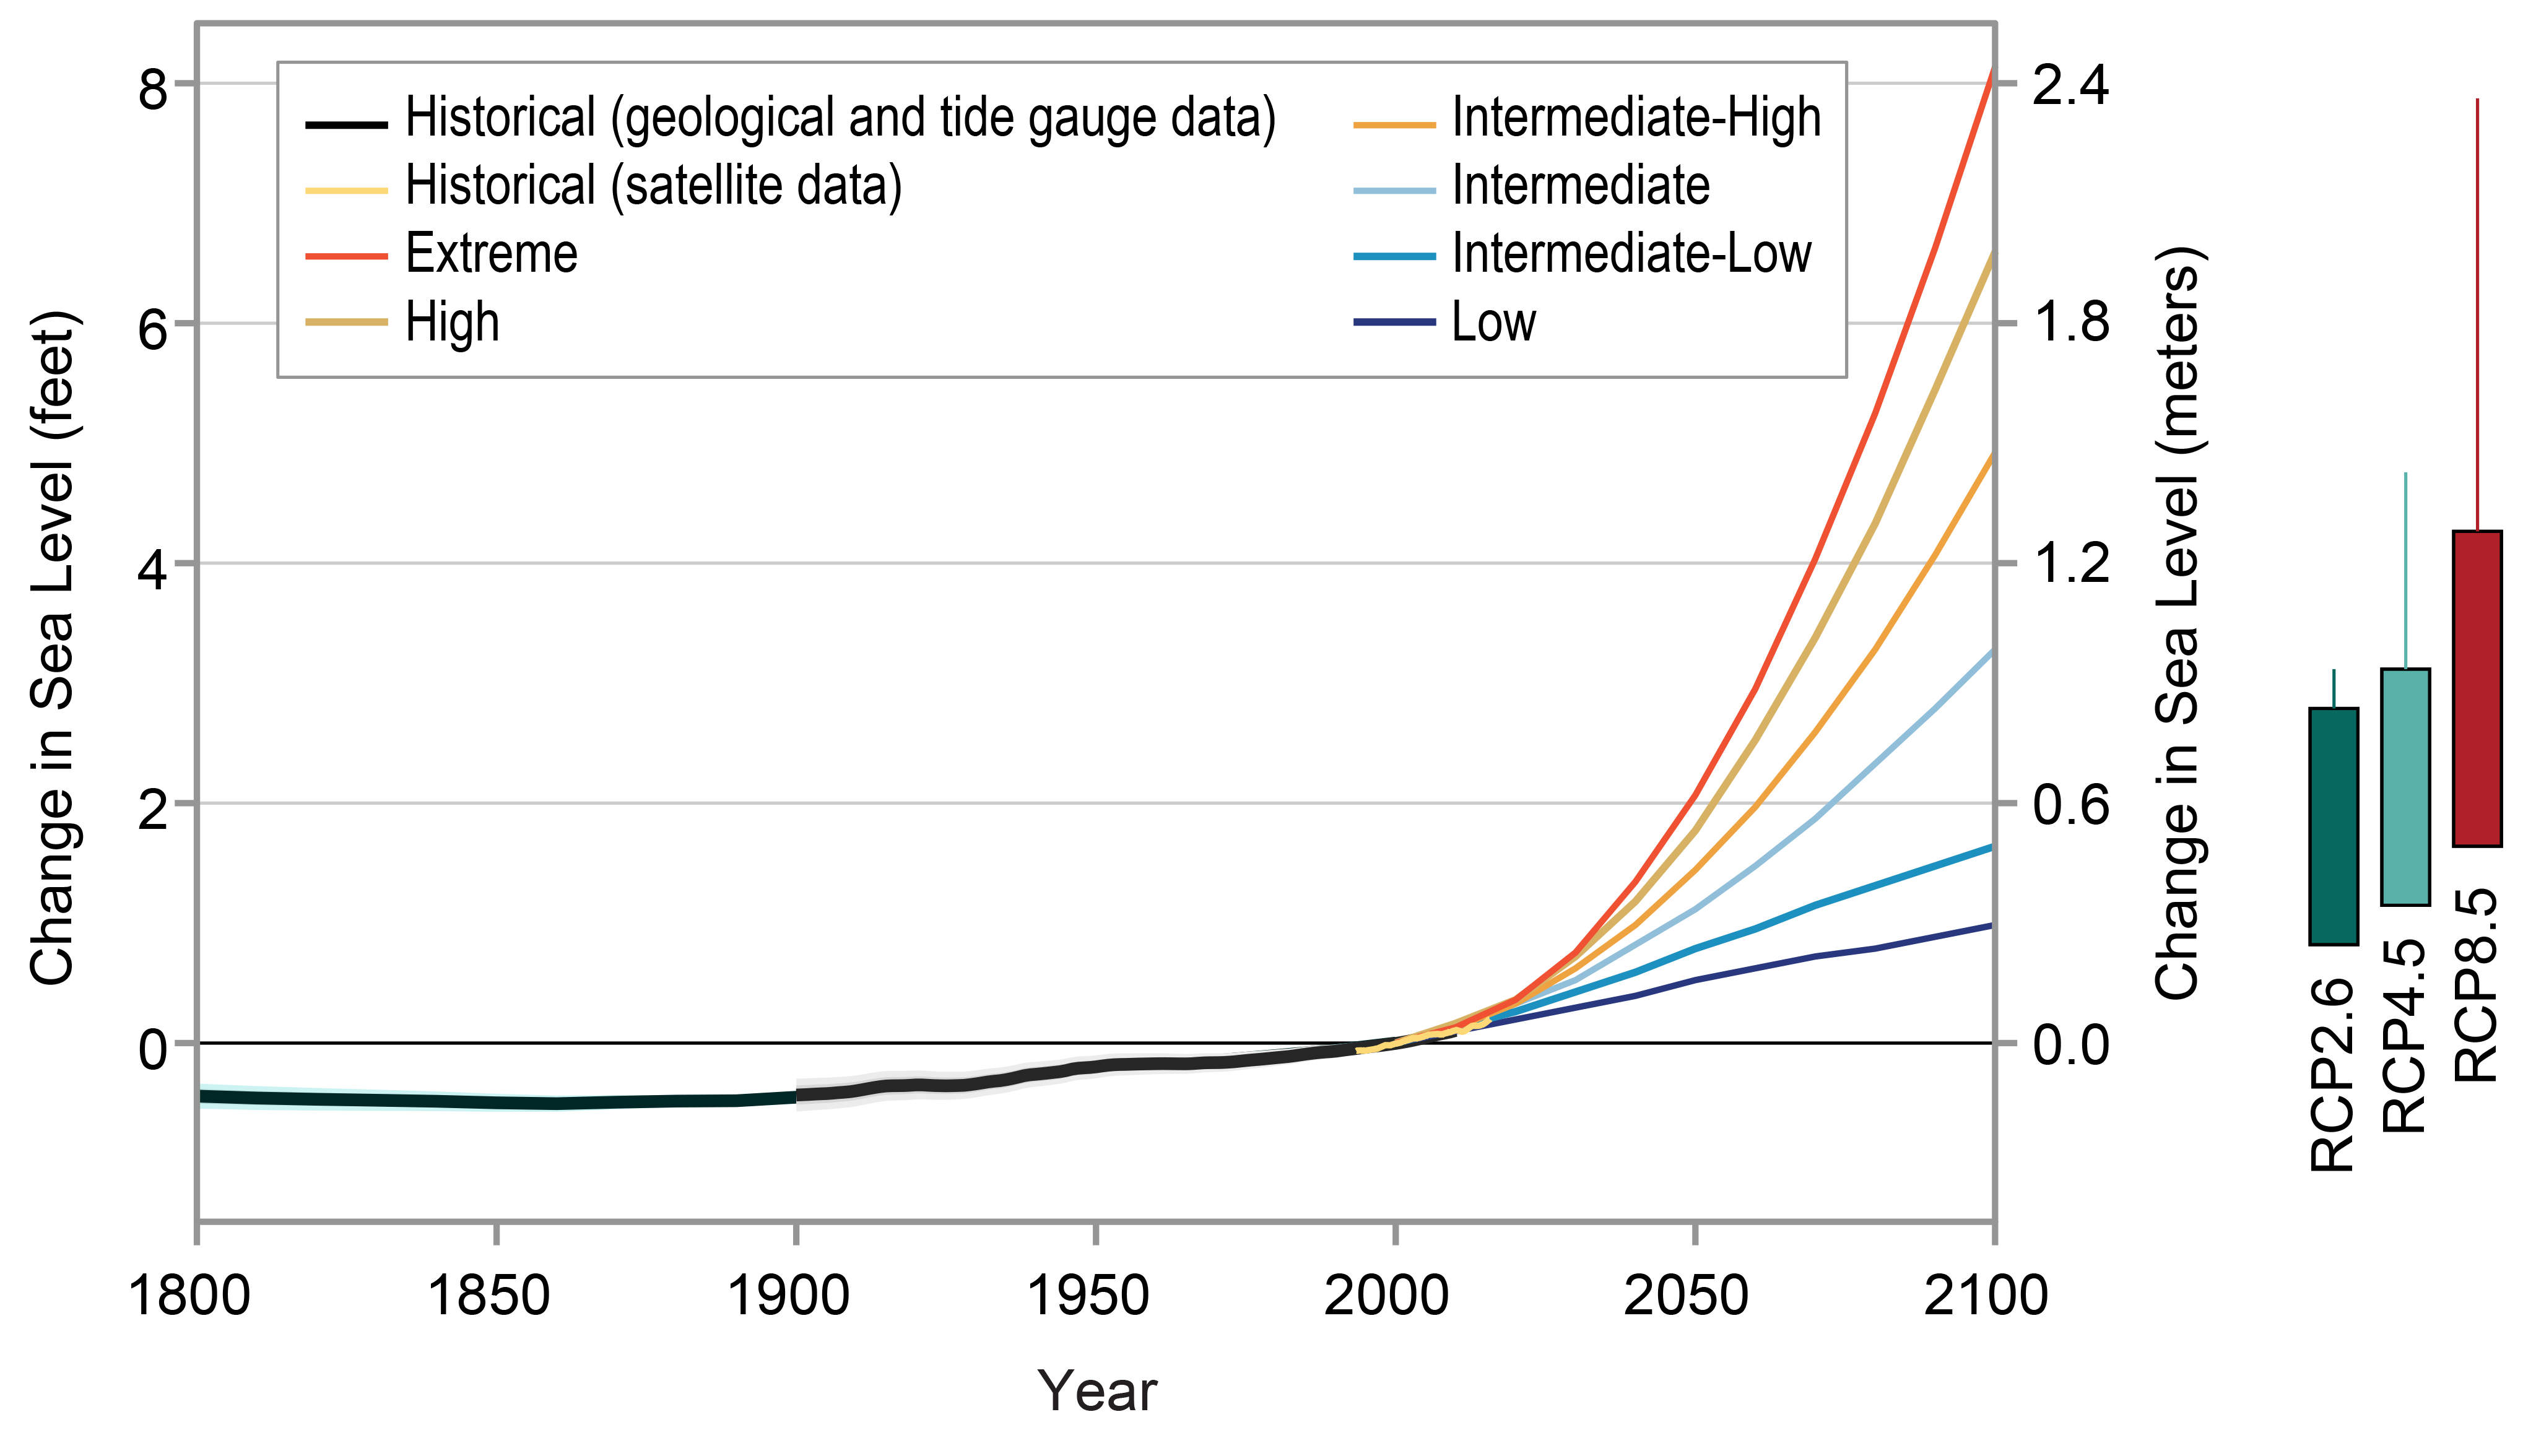
This figure was revised in June 2019. See Errata for details: https://nca2018.globalchange.gov/downloads

SHRINK

This projected GMSL range was discretized into six GMSL rise scenarios at 0.5-meter increments (Low, Intermediate-Low, Intermediate, Intermediate-High, High, and Extreme, which correspond to a GMSL rise of 0.3 m, 0.5 m, 1.0 m, 1.5 m, 2.0 m, and 2.5 m, respectively, by 2100). These were then used as the basis for deriving relative sea level (RSL) rise on a 1-degree grid covering the coastlines of the U.S. mainland, Alaska, Hawai‘i, the U.S. Caribbean, and the U.S.-Affiliated Pacific Islands regions, as well as at the precise locations of available tide gauges along these coastlines. The RSL values account for key factors important at regional scales, including 1) shifts in oceanographic factors; 2) changes in Earth’s gravitational field and rotation, and flexure of the crust and upper mantle due to melting of land-based ice; and 3) non-climatic factors mostly associated with vertical land movement (subsidence or uplift) due to glacial isostatic adjustment (the continuing vertical movement of land in response to the melting of the ice cover from the last ice age), sediment compaction, and groundwater and fossil fuel withdrawals.

These global and regional/local scenario products are available for the 2000–2100 period at 10-year intervals and over 2100–2200 at a coarser temporal resolution (the scenario values are provided for 2120, 2150, and 2200).

Population and Land-Use Scenarios

Population and land-use scenarios for NCA4 have been developed through the U.S. Environmental Protection Agency’s (EPA) Integrated Climate and Land Use Scenarios (ICLUS) effort. ICLUS explores future changes in human population and developed land use for the contiguous United States. These projections are broadly consistent with peer-reviewed storylines of population growth and economic development that are now widely used by the climate change impacts community.10 Specifically, the different population and land-use change scenarios stem from global population and urbanization assumptions underlying two different future trajectories from the Shared Socioeconomic Pathways (SSPs) effort:11 SSP2, which represents a business-as-usual trajectory, similar to the U.S. Census population projection (out to 2060), and SSP5, which represents a trajectory with higher fertility and higher net migration into the United States.12 At the global scale, socioeconomic assumptions under SSP2 are broadly consistent with the concentration pathway and resultant radiative forcing for RCP4.5, whereas the socio-economic assumptions under SSP5 are more consistent with RCP8.5.

ICLUS data (version 2) outputs have been made available to NCA4 authors (including training webinars) and consist of both population and land-use projections. Two ICLUS projections are provided. These are based on the 2010 U.S. Census and use fertility, mortality, and immigration rates from the Wittgenstein Centre to project decadal population to 2100, consistent with the demographic assumptions of the SSP2 and SSP5 socioeconomic scenarios, respectively.

These ICLUS population projections are used as inputs to a land-use model, which spatially allocates five residential land uses (exurban-low, exurban-high, suburban, urban-low, and urban-high) as well as commercial and industrial uses.

Indicators

Overview

The USGCRP hosts an interagency climate-related indicator platform at http://www.globalchange.gov/browse/indicators. Climate indicators for this purpose are defined as observations or other measures that are used to track the state of or the trend in conditions with a scientifically based relationship to the changing climate. For example, businesses might look at the unemployment index as one of a number of indicators representing the condition of the economy. Similarly, indicators related to climate—which may be physical, ecological, or societal—can be used to understand how environmental conditions are changing, to assess risks and vulnerabilities, and to help inform resilience and planning for climate impacts.

One of the primary goals of the USGCRP indicators effort is to support a sustained National Climate Assessment process by regularly tracking variables relevant to climate change. USGCRP and its participating agencies intend to maintain the indicators as a living resource, routinely updating them with new data. In addition, the indicators effort serves as a platform for USGCRP agencies to showcase data collection efforts and to highlight research related to indicators of change across a range of sectors.

The USGCRP indicators are not intended to be representative of all potential indicators across all possible scales; rather, they are meant to communicate several key aspects of climate change, such as temperatures over land and at sea, greenhouse gas (GHG) levels in the atmosphere, the extent of arctic sea ice, and related effects in sectors like public health, water resources, and agriculture. All of the indicators show climate-related trends over time and meet established criteria related to data quality.13 Similar to the findings and figures in NCA3 and other NCA reports and products, the indicators’ underlying datasets are documented in USGCRP’s Global Change Information System (GCIS).

USGCRP Indicators

USGCRP’s indicator platform currently includes 15 representative global and national-level climate indicators:14

  • annual GHG index
  • arctic glacial mass balance
  • arctic sea ice extent
  • atmospheric carbon dioxide
  • frost-free season
  • global surface temperatures
  • heating and cooling degree days
  • heavy precipitation
  • ocean chlorophyll concentrations
  • sea level rise (global)
  • sea surface temperatures
  • start of spring
  • terrestrial carbon storage
  • U.S. heat waves
  • U.S. surface temperatures
     

Figure A3.2: Climate Change Indicators

Click on a topic or on the thumbnails below the image to see a relevant indicator.

Alternative text for the main image for figure 1_2
Caption for figure 1.2 a Caption for figure 1.2 b Caption for figure 1.2 c Caption for figure 1.2 d Caption for figure 1.2 e Caption for figure 1.2 f Caption for figure 1.2 g Caption for figure 1.2 h Caption for figure 1.2 i Caption for figure 1.2 j Caption for figure 1.2 k Caption for figure 1.2 l
a b c d e f g h i j k l
CLICK HERE TO INTERACT

View static image

Figure A3.2: Long-term observations demonstrate the warming trend in the climate system and the effects of increasing atmospheric greenhouse gas concentrations (Ch. 2: Climate, Box 2.2). This figure shows climate-relevant indicators of change based on data collected across the United States. Upward-pointing arrows indicate an increasing trend; downward-pointing arrows indicate a decreasing trend. Bidirectional arrows (e.g., for drought conditions) indicate a lack of a definitive national trend.

Atmosphere (a–c): (a) Annual average temperatures have increased by 1.8°F across the contiguous United States since the beginning of the 20th century; this figure shows observed change for 1986–2016 (relative to 1901–1960 for the contiguous United States and 1925–1960 for Alaska, Hawai‘i, Puerto Rico, and the U.S. Virgin Islands). Alaska is warming faster than any other state and has warmed twice as fast as the global average since the mid-20th century (Ch. 2: Climate, KM 5; Ch. 26: Alaska, Background). (b) The season length of heat waves in many U.S. cities has increased by over 40 days since the 1960s. Hatched bars indicate partially complete decadal data. (c) The relative amount of annual rainfall that comes from large, single-day precipitation events has changed over the past century; since 1910, a larger percentage of land area in the contiguous United States receives precipitation in the form of these intense single-day events.

Ice, snow, and water (d–f): (d) Large declines in snowpack in the western United States occurred from 1955 to 2016. (e) While there are a number of ways to measure drought, there is currently no detectable change in long-term U.S. drought statistics using the Palmer Drought Severity Index. (f) Since the early 1980s, the annual minimum sea ice extent (observed in September each year) in the Arctic Ocean has decreased at a rate of 11%–16% per decade (Ch. 2: Climate, KM 7).

Oceans and coasts (g–i): (g) Annual median sea level along the U.S. coast (with land motion removed) has increased by about 9 inches since the early 20th century as oceans have warmed and land ice has melted (Ch. 2: Climate, KM 4). (h) Fish, shellfish, and other marine species along the Northeast coast and in the eastern Bering Sea have, on average, moved northward and to greater depths toward cooler waters since the early 1980s (records start in 1982). (i) Oceans are also currently absorbing more than a quarter of the carbon dioxide emitted to the atmosphere annually by human activities, increasing their acidity (measured by lower pH values; Ch. 2: Climate, KM 3).

Land and ecosystems (j–l): (j) The average length of the growing season has increased across the contiguous United States since the early 20th century, meaning that, on average, the last spring frost occurs earlier and the first fall frost arrives later; this map shows changes in growing season length at the state level from 1895 to 2016. (k) Warmer and drier conditions have contributed to an increase in large forest fires in the western United States and Interior Alaska over the past several decades (CSSR, Ch. 8.3). (l) Degree days are defined as the number of degrees by which the average daily temperature is higher than 65°F (cooling degree days) or lower than 65°F (heating degree days) and are used as a proxy for energy demands for cooling or heating buildings. Changes in temperatures indicate that heating needs have decreased and cooling needs have increased in the contiguous United States over the past century.

Sources: (a) adapted from Vose et al. 2017, (b) EPA, (c–f and h–l) adapted from EPA 2016, (g and center infographic) EPA and NOAA.
The interactive version of this figure was revised in June 2019. See Errata for details: https://nca2018.globalchange.gov/downloads

Additional Indicator Resources

Several U.S. federal agencies make available climate-relevant indicators and their underlying data. For example, the EPA partners with more than 40 data contributors from various government agencies, academic institutions, and other organizations to compile a key set of nearly 40 indicators related to the causes and effects of climate change. The indicators are published in the EPA’s report Climate Change Indicators in the United States. Updated datasets can be found on the EPA website.17 To provide a more comprehensive resource to NCA4 authors and the broader public, readers can access a much more expansive suite of climate indicators, many at a regional scale, here: https://www.epa.gov/climate-indicators.

The EPA’s climate indicators effort is meant to communicate the causes and effects of climate change in the areas of atmospheric composition, weather and climate, oceans, snow and ice, health and society, and ecosystems. All of the indicators are based on historical observations (no projections), are independently peer-reviewed, and are routinely updated with new data.

A variety of other readily accessible federal climate indicator resources are available for public use, including

  • Centers for Disease Control and Prevention’s (CDC) National Environmental Public Health Tracking network: https://ephtracking.cdc.gov/showClimateChangeIndicators,

  • EPA’s U.S. Inventory of Greenhouse Gas Emissions and Sinks: https://www.epa.gov/ghgemissions/inventory-us-greenhouse-gas-emissions-and-sinks,

  • National Aeronautics and Space Administration’s (NASA) Global Climate Change: Vital Signs of the Planet: https://climate.nasa.gov/,

  • National Oceanic and Atmospheric Administration’s (NOAA) Arctic Program, Arctic Report Card: http://www.arctic.noaa.gov/Report-Card, and

  • NOAA’s State of the Climate: https://www.ncdc.noaa.gov/sotc/.

Other relevant sources of indicator information include

  • NOAA’s State Summaries: stateclimatesummaries.globalchange.gov, and

  • USGCRP’s Climate Science Special Report: https://science2017.globalchange.gov/.18

Climate Resilience Toolkit

In NCA3, authors used case studies to highlight specific examples of work being done by regions, cities, and stakeholders throughout the United States. These case studies formed some of the basis for the development of the U.S. Climate Resilience Toolkit (CRT).

The CRT is a free, open-source website (https://toolkit.climate.gov/) designed to help communities and businesses build resilience to climate-related impacts and extreme events. Its primary target audience is applied professionals—including city planners, resource managers, policy leaders, facility managers, analysts, and consultants—who oversee or help guide the development and implementation of climate adaptation plans. The site is easily understandable and is also accessible to the general public, a secondary target audience.

Published in November 2014, the CRT was developed as an interagency partnership under the auspices of the USGCRP. Hosted and managed by NOAA, it is a web-based framework that aggregates and contextualizes scientific information, tools, and expertise to help people

  1. make and implement climate adaptation plans;

  2. explore how climate conditions are changing in their location and understand how their valued assets are, or may be, impacted;

  3. learn what others are doing to address climate-related challenges similar to the ones they face; and

  4. learn about funding sources that can help in disaster recovery and/or to mitigate future risks.

Case studies (https://toolkit.climate.gov/#case-studies) have also been incorporated as a feature of NCA4, and some of those studies will be incorporated into the CRT in the future.

Steps to Resilience

The CRT’s “Steps to Resilience” is the site’s centerpiece (https://toolkit.climate.gov/#steps). It is a five-step, iterative risk-management framework that integrates a range of different content types into topical, geographical, and purposeful frames of reference.

This framework guides users through a deliberative process whereby they can access, explore, discuss, co-produce, and integrate information to build shared mental models as they address several fundamental questions:

  1. Do climate-related hazards threaten assets we value?

  2. If so, what is the risk, and are we willing to tolerate that level of risk?

  3. If the risk is intolerable, what options exist to reduce or eliminate the risk?

  4. Which options are viable and affordable, and in what priority order might we pursue them?

  5. How will we plan and implement particular actions?

To help users answer these questions, the Toolkit offers plain language narratives—excerpted from the NCAs and other authoritative sources—that summarize ways that U.S. sectors, regions, and built and natural environments are vulnerable to, and have been impacted by, climate and non-climate stressors. These narratives are cross-linked with over 110 real-world case studies, from across the United States and its territories, highlighting people in communities and businesses who have successfully taken action to manage their climate risks. Additionally, the site’s narratives and case studies are cross-linked with science-based decision-support tools to illustrate how people have used those tools to plan and build resilience.

CRT Tools and the Climate Explorer

The CRT’s “Tools” compendium (https://toolkit.climate.gov/tools) has more than 400 decision-support tools offering a wide range of functions, such as helping people identify their vulnerabilities, view past and present climate conditions, download and analyze data, engage and communicate, check applied forecasts, find adaptation planning support, recover and rebuild from a disaster, and visualize climate projections.

The “Climate Explorer” (https://toolkit.climate.gov/#climate-explorer) is the CRT’s featured tool for visualizing climate projections. Maps and graphs are available for 20 decision-relevant variables (such as temperature, precipitation, and heating- and cooling-degree days) for every county in the contiguous United States. Users can compare observed historical data to hindcasts (a method of testing a model for future events by comparing predictions of past events to known data) for the 1950–2006 period, and they can explore the projected rates and magnitudes of change in two future scenarios (RCP4.5 and RCP8.5) from 2006-2100.

Climate Explorer version 2.6, published in May 2018, features these improvements:

  • replaced the Bias Corrected Constructed Analogs (BCCA) with the LOcalized Constructed Analogs (LOCA) projection dataset, to align with the NCA4;
  • added about 90 tidal stations charting both historical observed and future projected annual number of days with high tide flooding;
  • enabled users to visually compare future projections to observed historical maps (1961–1990);
  • added a new module enabling users to select specific thresholds for select locations to produce annual counts of observed threshold exceedance over time; and
  • transitioned the tool’s map library from OpenLayers to the ArcGIS Javascript library to make it interoperable with Esri’s “ArcGIS Living Atlas of the World.”

The CRT evolved and expanded in 2017 to include regional sections, enhancements to link more closely with the Steps to Resilience, and an expanded menu of climate variables offered in the Climate Explorer.

Download CSV
Download JSON
View in GCIS

Table A3.2: Climate Resilience Toolkit Case Study Categories

Climate Threat/Stressors Topics Resilience Steps Regions
  • Sea level rise, storm surge, and coastal flooding
  • Drought
  • Extreme precipitation
  • General climate change
  • Extreme events
  • Increased temperatures
  • El Niño, La Niña, and climate variability
  • Flooding
  • Changes in growing seasons
  • Changing ocean conditions
  • Reduced sea ice, permafrost, and snow
  • Temperature extremes
  • Coasts
  • Built environment
  • Water
  • Ecosystems
  • Health
  • Food
  • Tribal nations
  • Marine
  • Energy
  • Transportation
  1. Explore climate threats
  2. Assess vulnerability and risks
  3. Investigate options
  4. Prioritize actions
  5. Take action
  • Southwest
  • Northeast
  • Southeast
  • Midwest
  • Alaska
  • Northwest
  • Hawai‘i and U.S.-Affiliated Pacific Islands
  • Great Plains
  • International
  • National
Table A3.2. The CRT contains over 140 case studies, which users can quickly filter to locate a story of interest using the menu filters listed above.
Download CSV
Download JSON
View in GCIS

Table A3.3: Climate Resilience Toolkit Decision Support Tools

Topic Tool Function
  • Coasts
  • Built environment
  • Water
  • Ecosystems
  • Health
  • Food
  • Tribal nations
  • Marine
  • Energy
  • Transportation
  • Identify vulnerabilities
  • View past and current conditions
  • Analyze and download data
  • Engage and communicate
  • Find adaptation planning support
  • Check applied forecasts
  • Recover and rebuild
  • Visualize climate projections
Table A3.3: The CRT contains over 400 decision support tools, and users can filter by topic, function, U.S. region, and the Steps to Resilience.

Global Change Information System

Summary

The National Climate Assessment and Development Advisory Committee (NCADAC), which guided the development of NCA3, recommended in 2013 that the NCA process “manage data to maximize utility and transparency.”19 The report also highlighted the importance of “developing a comprehensive web-based system to deploy and manage global change information and present it in a way that can be used by and benefit scientists, the public, and decision-makers.” To achieve these goals, the USGCRP established the Global Change Information System (GCIS).

The GCIS is an open-source centralized database of all materials and data used for USGCRP assessments (https://data.globalchange.gov/). The system acts as an advanced, multifaceted bibliography, maintaining traceable provenance records of scientific information and providing access to the original data and research. The GCIS catalogs the cross-links among research papers, researchers, original data, and more and includes links back to authoritative sources for its information. GCIS serves as a key supporting resource for assessments produced by the USGCRP, providing information about the data underpinning them. In addition, the GCIS guides users to global change research produced by the 13 USGCRP member agencies.

Identifiers

Each item (for example, a report, dataset, or organization) referenced in the GCIS has a unique, persistent identifier. When possible, this includes or is related to third-party identification systems, such as Universally Unique Identifiers (UUIDs), Digital Object Identifiers (DOIs), Open Researcher and Contributor Identifiers (ORCIDs), and International Standard Book Numbers (ISBNs). This enhances interoperability between the GCIS and other information systems. For resources where such persistent identifiers are unknown, GCIS creates its own, and links between resources are assigned using the identifiers so that edits and corrections made to resource names or other properties do not break data linkages.

Provenance and Semantics

GCIS is built to represent the provenance of information contained in government assessments about global environmental change. GCIS includes in this (following the World Wide Web Consortium’s definition of provenance) “information about entities, activities, and people involved in producing a piece of data or thing, which can be used to form assessments about its quality, reliability or trustworthiness.”20 This information is captured by a combination of documentation by the authors and scripts that ingest machine-readable metadata from online catalogs. Resources in GCIS are related both in relational databases, for cases of ownership (for example, a chapter belongs to a report and doesn’t exist independently), and in a database that represents semantically the nature of the relationship between two resources (for example, a report cites a book, a table is derived from a dataset).


Figure A3.3: Traceability and Provenance in GCIS

Traceability and Provenance in GCIS
A diagram shows a complex web of interconnecting lines, demonstrating the detailed data captured in the Global Change Information System that supports each conclusion presented in the National Climate Assessment report. The web shown represents just one chapter of the National Climate Assessment, and an inset zooms in on one figure within that chapter and its component connections, such as figure author and organization, figure component parts, and references.
Figure A3.3: This figure is a graphic representation of traceability and provenance within the Global Change Information System (GCIS). All records within GCIS seek to have each component of this chain tracked and available to any reader. Tracking each of these components allows for any interested member of the public to trace a conclusion back to the supporting data for that conclusion. Source: USGCRP.

SHRINK

NOAA State Climate Summaries

Overview

NOAA produced a set of State Climate Summaries in response to a growing demand for state-level information after the release of NCA3 (stateclimatesummaries.globalchange.gov). These summaries consist of observed and projected climate change information and focus on aspects that are part of NOAA’s mission (mainly, characteristics of the physical climate and coastal issues). These state summaries support various aspects of chapters throughout NCA4 and, deriving from the charge in the Global Change Research Act of 1990, contain information both on historical trends and scientific knowledge about potential future trends.

While the datasets and simulations in these state summaries are not by themselves new (they have been previously published in various sources), these documents represent a targeted synthesis of historical and plausible future climate conditions for each state.

Each summary consists of several high-level Key Messages about how climate change has or is likely to affect that state, as well as a description of the historical climate conditions in the state and of the climate conditions associated with future pathways of GHG emissions. In addition to this consistent information across all the state summaries, each summary contains some degree of state-specific information, making it uniquely valuable to decision-makers across the respective state. All 50 summaries (plus one for Puerto Rico and the U.S. Virgin Islands) underwent an anonymous external review, with at least two expert reviews completed per state.

Historical Climate

The description of historical climate conditions for each state is based on an analysis of core climate data (the data sources are described in the supplementary online material for the summaries). However, to help understand, prioritize, and describe the importance and significance of different climate conditions, additional input was derived from climate experts in each state, some of whom are authors on these state summaries. In particular, input was sought from the NOAA Regional Climate Centers and from the State Climatologists. The historical climate conditions are meant to provide a perspective on what has been happening in each state and what types of extreme events have historically been noteworthy and to provide a context for the assessment of future impacts.

Future Scenarios

Future climate scenarios are intended to provide an internally consistent set of climate conditions that can inform analyses of potential impacts of climate change under certain assumptions about the future pathway of GHG emissions. Here, “consistent” means that the relationships among different climate variables and the spatial patterns of these variables derive directly from the same set of climate model simulations and are, therefore, physically plausible. The future climate scenarios are based on well-established sources of information (see the Scenario Products section of this appendix). No new climate model simulations or downscaled datasets were produced for use in the state summaries.

REFERENCES

  • Bierwagen, B. G., D. M. Theobald, C. R. Pyke, A. Choate, P. Groth, J. V. Thomas, and P. Morefield, 2010: National housing and impervious surface scenarios for integrated climate impact assessments. Proceedings of the National Academy of Sciences of the United States of America, 107 (49), 20887–20892. doi:10.1073/pnas.1002096107. ↩
  • Buizer, J., P. Fleming, S. L. Hays, K. Dow, C. Field, D. Gustafson, A. Luers, and R. H. Moss, 2013: Preparing the Nation for Change: Building a Sustained National Climate Assessment. National Climate Assessment and Development Advisory Committee, Washington, D.C., URL. ↩
  • EPA, 2016: Climate Change Indicators in the United States, 2016. 4th edition. EPA 430-R-16-004. U.S. Environmental Protection Agency, Washington, D.C., 96 pp. URL. ↩
  • EPA, 2016: Climate Change Indicators in the United States, 2016. Fourth Edition. Technical Documentation Overview. URL. ↩
  • EPA, 2017: Updates to the Demographic and Spatial Allocation Models to Produce Integrated Climate and Land Use Scenarios (ICLUS) Version 2. EPA/600/R-16/366F. U.S. Environmental Protection Agency, National Center for Environmental Assessment, Washington, DC, various pp. URL. ↩
  • Groth, P., and L. Moreau Eds., 2013: PROV-Overview: An Overview of the PROV Family of Documents: W3C Working Group Note 30 April 2013. URL. ↩
  • Maurer, E. P., H. G. Hidalgo, T. Das, M. D. Dettinger, and D. R. Cayan, 2010: The utility of daily large-scale climate data in the assessment of climate change impacts on daily streamflow in California. Hydrology and Earth Systems Sciences, 14 (6), 1125–1138. doi:10.5194/hess-14-1125-2010. ↩
  • Melillo, J. M., T. (T. C. . Richmond, and G. W. Yohe, Eds., 2014: Climate Change Impacts in the United States: The Third National Climate Assessment. U.S. Global Change Research Program, Washington, DC, 841 pp. doi:10.7930/J0Z31WJ2. ↩
  • Moss, R. H., J. A. Edmonds, K. A. Hibbard, M. R. Manning, S. K. Rose, D. P. van Vuuren, T. R. Carter, S. Emori, M. Kainuma, T. Kram, G. A. Meehl, J. F. B. Mitchell, N. Nakicenovic, K. Riahi, S. J. Smith, R. J. Stouffer, A. M. Thomson, J. P. Weyant, and T. J. Wilbanks, 2010: The next generation of scenarios for climate change research and assessment. Nature, 463, 747–756. doi:10.1038/nature08823. ↩
  • Nakicenovic, N., J. Alcamo, G. Davis, B. de Vries, J. Fenhann, S. Gaffin, K. Gregory, A. Grübler, T. Y. Jung, T. Kram, E. L. L. Rovere, L. Michaelis, S. Mori, T. Morita, W. Pepper, H. Pitcher, L. Price, K. Riahi, A. Roehrl, H.-H. Rogner, A. Sankovski, M. Schlesinger, P. Shukla, S. Smith, R. Swart, S. van Rooijen, N. Victor, and Zhou Dadi, 2000: IPCC Special Report on Emissions Scenarios. Nakicenovic, N., and R. Swart, Eds. Cambridge University Press, 599 pp. URL. ↩
  • O'Neill, B. C., E. Kriegler, K. Riahi, K. L. Ebi, S. Hallegatte, T. R. Carter, R. Mathur, and D. P. van Vuuren, 2014: A new scenario framework for climate change research: The concept of shared socioeconomic pathways. Climatic Change, 122 (3), 387–400. doi:10.1007/s10584-013-0905-2. ↩
  • Pierce, D. W., D. R. Cayan, and B. L. Thrasher, 2014: Statistical downscaling using Localized Constructed Analogs (LOCA). Journal of Hydrometeorology, 15 (6), 2558–2585. doi:10.1175/jhm-d-14-0082.1. ↩
  • Sweet, W. V., R. E. Kopp, C. P. Weaver, J. Obeysekera, R. M. Horton, E. R. Thieler, and C. Zervas, 2017: Global and Regional Sea Level Rise Scenarios for the United States. NOAA Tech. Rep. NOS CO-OPS 083. National Oceanic and Atmospheric Administration, National Ocean Service, Silver Spring, MD, 75 pp. URL. ↩
  • Taylor, K. E., R. J. Stouffer, and G. A. Meehl, 2012: An overview of CMIP5 and the experiment design. Bulletin of the American Meteorological Society, 93 (4), 485–498. doi:10.1175/BAMS-D-11-00094.1. ↩
  • USGCRP Scenarios and Interpretive Science Coordination Group, 2015: U.S. Global Change Research Program General Decisions Regarding Climate-Related Scenarios for Framing the Fourth National Climate Assessment. URL. ↩
  • USGCRP, 2017: [National Climate Assessment] Indicators. U.S. Global Change Research Program, . URL. ↩
  • USGCRP, 2017: Climate Science Special Report: Fourth National Climate Assessment, Volume I. Wuebbles, D. J., D. W. Fahey, K. A. Hibbard, D. J. Dokken, B. C. Stewart, and T. K. Maycock, Eds. U.S. Global Change Research Program, Washington, DC, USA, 470 pp. doi:10.7930/J0J964J6. ↩
  • van Vuuren, D. P., J. Edmonds, M. Kainuma, K. Riahi, A. Thomson, K. Hibbard, G. C. Hurtt, T. Kram, V. Krey, and J. F. Lamarque, 2011: The representative concentration pathways: An overview. Climatic Change, 109 (1–2), 5–31. doi:10.1007/s10584-011-0148-z. ↩
  • Vose, R. S., D. R. Easterling, K. E. Kunkel, A. N. LeGrande, and M. F. Wehner, 2017: Temperature Changes in the United States. Climate Science Special Report: Fourth National Climate Assessment, Volume I. Wuebbles, D. J., D. W. Fahey, K. A. Hibbard, D. J. Dokken, B. C. Stewart, and T. K. Maycock, Eds., U.S. Global Change Research Program, Washington, DC, USA, 185–206. doi:10.7930/J0N29V45. ↩
  • Wehner, M. F., J. R. Arnold, T. Knutson, K. E. Kunkel, and A. N. LeGrande, 2017: Droughts, Floods, and Wildfires. Climate Science Special Report: Fourth National Climate Assessment, Volume I. Wuebbles, D. J., D. W. Fahey, K. A. Hibbard, D. J. Dokken, B. C. Stewart, and T. K. Maycock, Eds., U.S. Global Change Research Program, Washington, DC, USA, 231–256. doi:10.7930/J0CJ8BNN. ↩

External Link External Link

You are leaving The Fourth National Climate Assessment and will be redirected to a new site in 5 seconds.

USGCRP Globalchange.gov earth logo

13 Logos #1 13 Logos #2

U.S. Global Change Research Program
1800 G Street, NW, Suite 9100, Washington, DC 20006 USA
Tel: +1 202.223.6262 | Fax: +1 202.223.3065

Contact Us • Credits • Privacy Policy • Site Map

Some figures and images are copyright protected.
Permission of the copyright owner must be obtained
before making use of copyrighted material.