We sought an author team that could bring diverse experiences and perspectives to the chapter, including some who have participated in prior national-level assessments within the sector. All are experts in the field of climate adaptation and transportation infrastructure. The team represents geographic expertise in the Northeast, Mid-Atlantic, South, Central, and Western regions, including urban and rural as well as coastal and inland perspectives. Team members come from the public (federal and city government and academia) and private sectors (consulting and engineering), with practitioner and research backgrounds.
The chapter was developed through technical discussions of relevant evidence and expert deliberation by the report authors at several workshops and teleconferences and via email exchanges. The authors considered inputs and comments submitted by the public, the National Academies of Sciences, Engineering, and Medicine, and federal agencies. For additional information on the overall report process, see Appendix 1: Process. The author team also engaged in targeted consultations with transportation experts during multiple listening sessions.
Because the impacts of climate change on transportation assets for the United States and globally have been widely examined elsewhere, including in the Third National Climate Assessment (NCA3),137 this chapter addresses previously identified climate change impacts on transportation assets that persist nationally, with a focus on recent literature that describes newly identified impacts and advances in understanding. Asset vulnerability and impacts are of national importance because there are societal and economic consequences that transcend regional or subregional boundaries when a transportation network fails to perform as designed; a chapter focus is the emerging understanding of those impacts. Further, place-based, societally relevant understanding of transportation system resilience has been strongly informed by numerous recent local and state assessments that capture regionally relevant climate impacts on transportation and collectively inform national level risks and resilience. The chapter synthesizes the transportation communities’ national awareness of and readiness for climate threats that are most relevant in the United States.
Key Message 1: Transportation at Risk
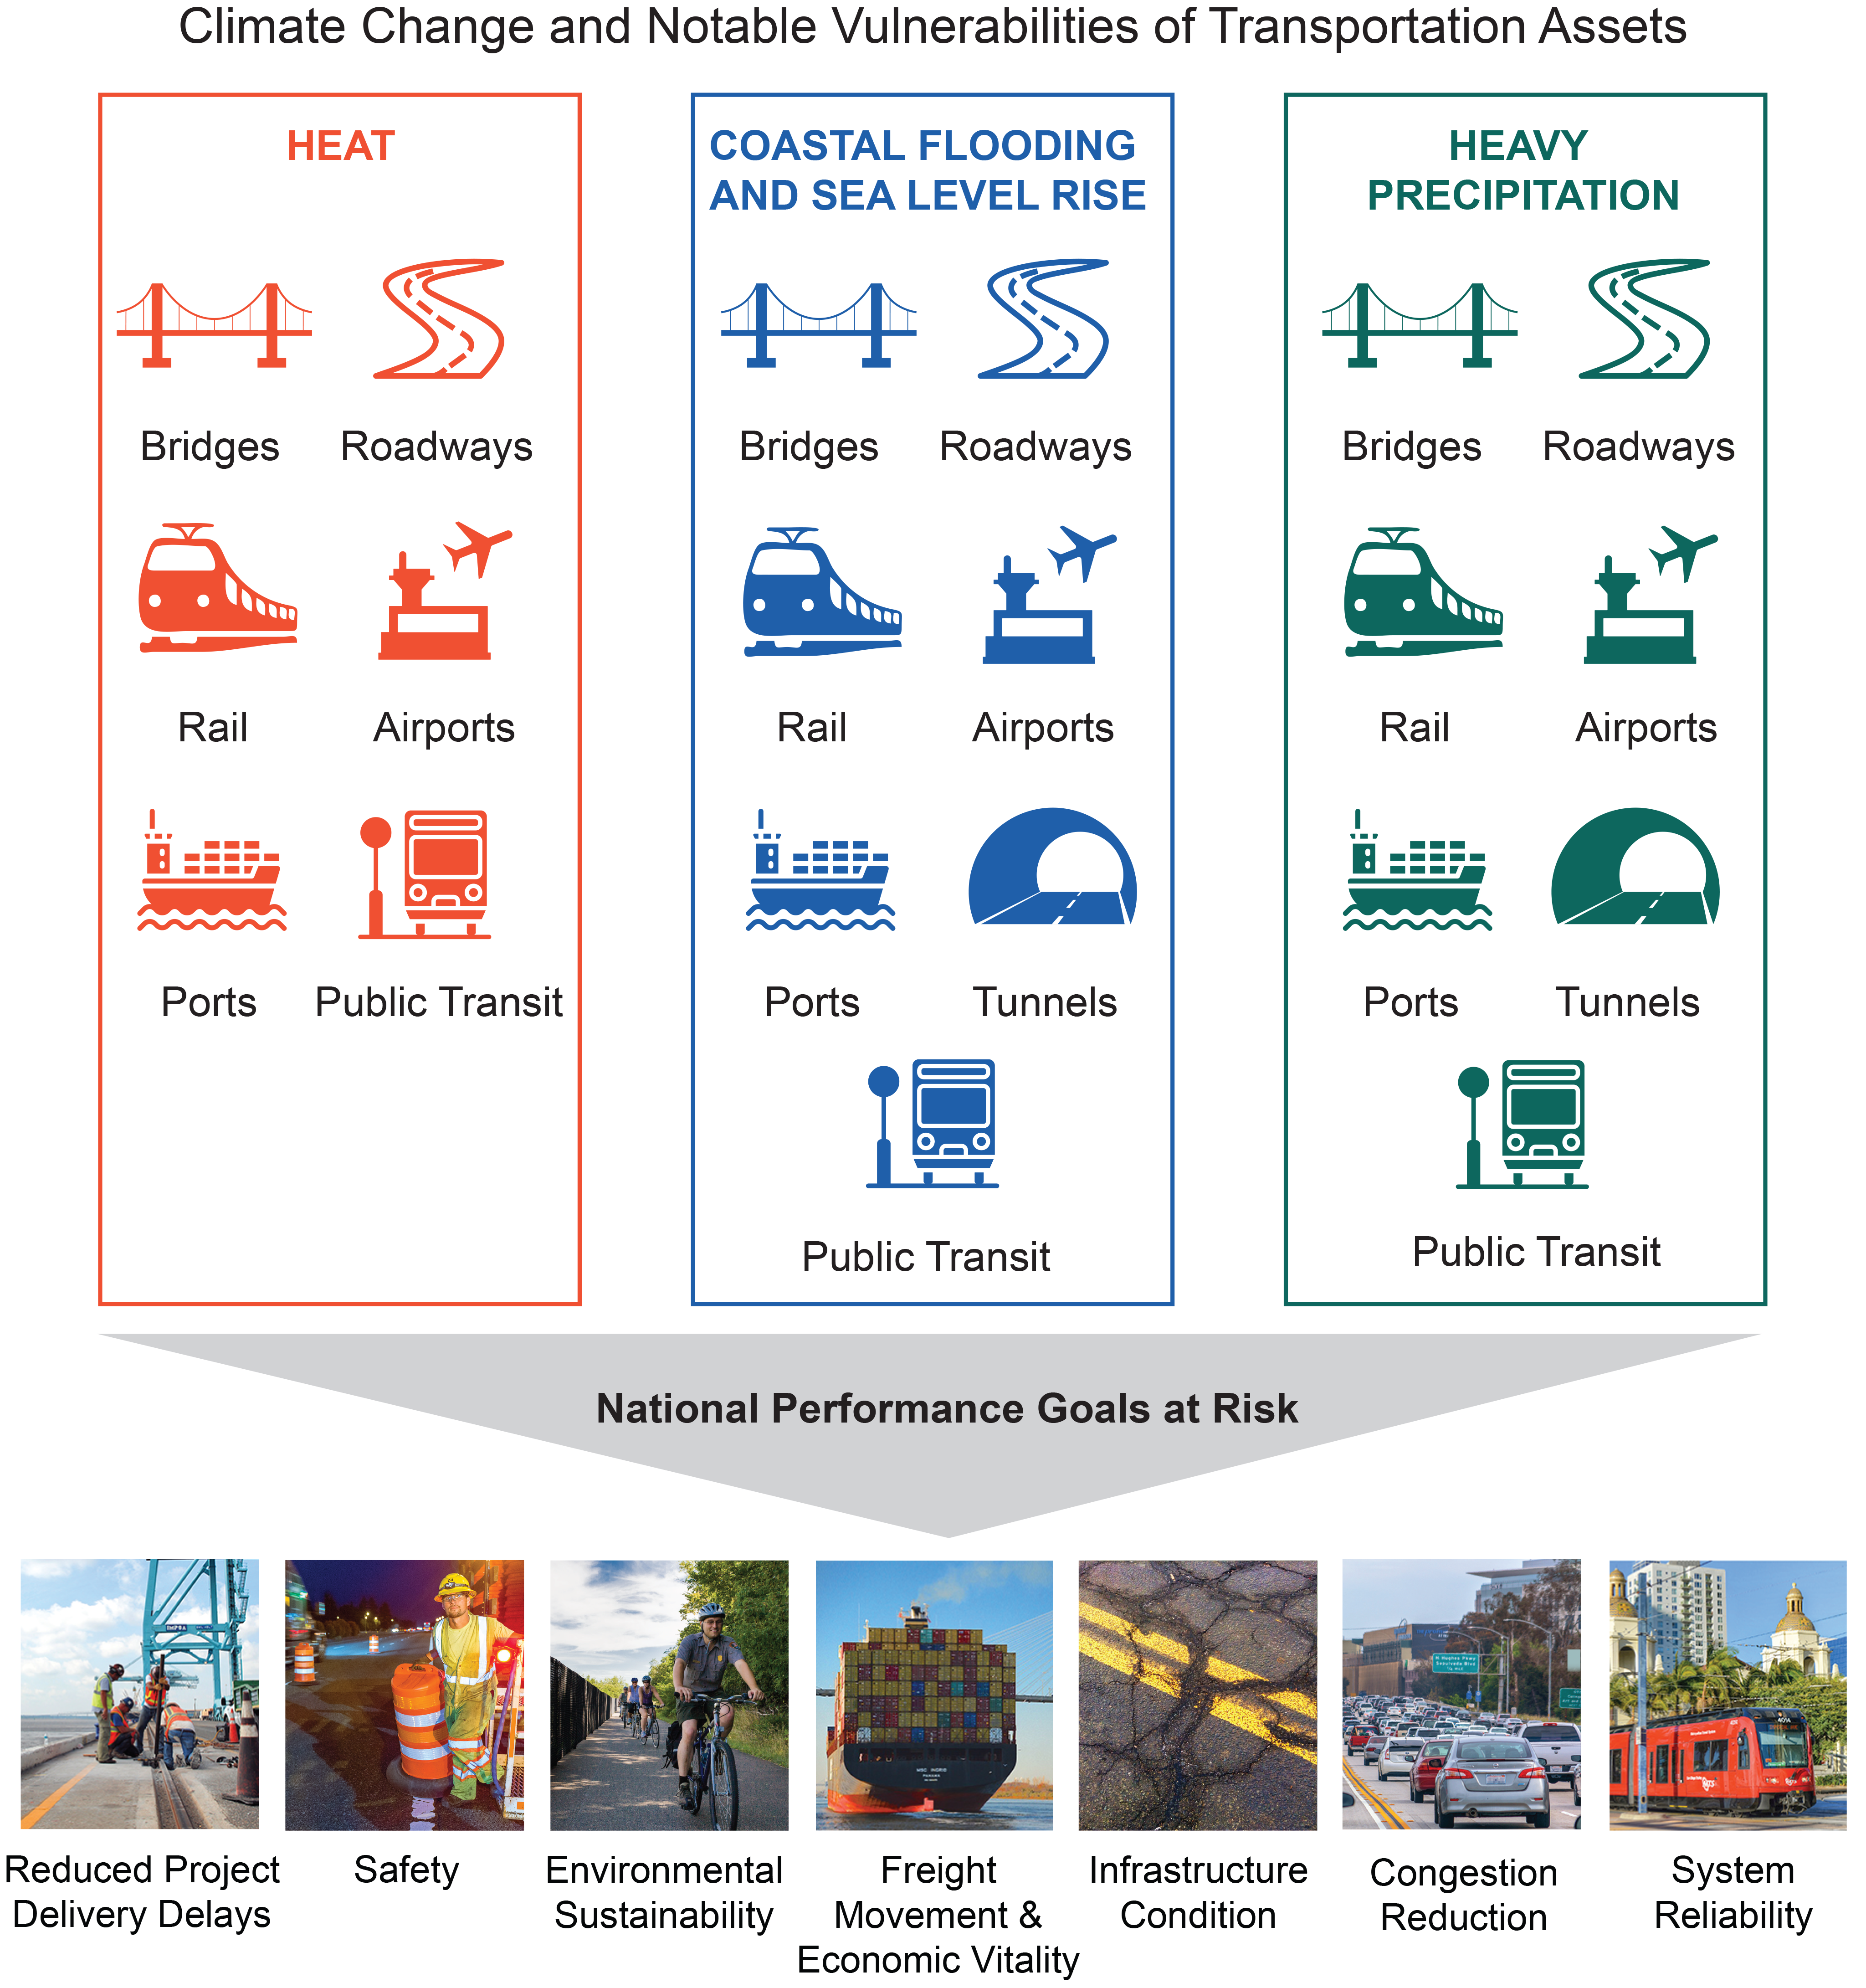
A reliable, safe, and efficient U.S. transportation system is at risk from increases in heavy precipitation, coastal flooding, heat, wildfires, and other extreme events, as well as changes to average temperature (high confidence). Throughout this century, climate change will continue to pose a risk to U.S. transportation infrastructure, with regional differences (high confidence).
Description of evidence base
Global mean sea level has risen since 1900 and is expected to continue to rise.2 High tide flooding is increasing1 and is projected to continue increasing.1 The peak storm surge levels are expected to rise more than the rise in sea level; models show that if the depth of storm flooding today is A and the rise in sea level between now and a future occurrence of an identical storm is B, then the resulting future storm surge depths can be greater than A + B.52 The U.S. roads and bridges in the coastal floodplain49 are vulnerable today, as storms are repeatedly causing damage.50,53,54,138 Sea level rise is also projected to impact ports,57 airports,58 and roads.63,64,65 High tide flooding currently makes some roads impassable due to flooding60,61 and is very likely to increase transportation disruptions in the future.61
In most parts of the United States, heavy precipitation is increasing in frequency and intensity, and more severe precipitation events are anticipated in the future.25 Inland transportation infrastructure is highly vulnerable to intense rainfall and flooding.3,25,66,67,69,139 In the western United States, large wildfires have increased and are likely to increase in the future,70 escalating the vulnerability of transportation infrastructure to severe precipitation events.71,72
The frequency of summer heat waves has increased since the 1960s, and average annual temperatures have increased over the past three decades; these temperature changes are projected to continue to increase in the future.41 Warming temperatures have increased costs81 and reduced the performance of roads,80 bridges,4,5 railways,4,5,6 and air transport.3,74,86 Future temperature increases are projected to reduce infrastructure lifetime78,79,122 and increase road costs.12 Milder winters will likely lengthen the shipping season in northern inland ports,87,88 benefit transportation safety,42,43,44,66,82 and reduce winter maintenance.4,12,45 In Alaska, however, permafrost thawing will damage roads46 and increase the cost of roads (Ch. 26: Alaska).
Major uncertainties
Peer-reviewed literature on climate impacts to some assets is limited. Most literature addresses local- or regional-scale issues. Uncertainty in the ranges of climate change projection leads to challenges to quantifying impacts on transportation assets, which have long lifetimes.
Impacts to transportation infrastructure from climate change will depend on many factors, including population growth, economic demands, policy decisions, and technological changes. How these factors, with their potential compounding effects, as well as the impacts of disruptive or transformative technologies (such as automated vehicles or autonomous aerial vehicles), will contribute to transportation performance in the future is poorly understood.
The relationship among increases in large precipitation events and flood-induced infrastructure damage is uncertain because multiple factors (including land use, topography, and even flood control) impact flooding.140,141,142,143 Hirsch and Ryberg (2012)144 found limited evidence of increasing global mean carbon dioxide concentrations resulting in increasing flooding in any region of the United States. Archfield et al. (2016)145 found that flood changes to date are fragmented and that a climate change signal on flood changes was not yet clear.
Description of confidence and likelihood
There is very high confidence that sea level rise and increases in flooding during coastal storms and astronomical high tides will lead to damage and service reductions with coastal bridges, roads, rails, and ports.
There is high confidence that heavy precipitation events have increased in intensity and frequency since 1901 (with the largest increase seen in the Northeast); this trend is projected to continue.25 There is medium confidence that precipitation increases will lead to surface and rail transit delays in urban areas. There is medium confidence that flood-induced damages to roads and bridges will increase.
Rising temperatures and extreme heat (high confidence) will damage pavement and increase railway and air transit delays. However, the actual magnitude of those impacts will depend on technological advancements and policy decisions about design and operations.
Key Message 2: Impacts to Urban and Rural Transportation
Extreme events that increasingly impact the transportation network are inducing societal and economic consequences, some of which disproportionately affect vulnerable populations (high confidence). In the absence of intervention, future changes in climate will lead to increasing transportation challenges, particularly because of system complexity, aging infrastructure, and dependency across sectors (high confidence).
Description of evidence base
The Key Message is largely supported by observation and empirical evidence that is well documented in the gray (non-peer-reviewed) literature and recent government reports. Because this is an important emerging area of research, the peer-reviewed scientific literature is sparse. Hence, much of the supporting materials for this Key Message are descriptions of impacts of recent events provided by news organizations and government summaries.
Many urban locations have experienced disruptive extreme events that have impacted the transportation network and led to societal and economic consequences. Louisiana experienced historic floods in 2016 that disrupted all modes of transportation and caused adverse impacts on major industries and businesses due to the halt of freight movement and employees’ inability to get to work.146 The 2016 floods that affected Texas from March to June resulted in major business disruption due to the loss of a major transportation corridor.147 In 2017, Hurricane Harvey affected population and freight mobility in Houston, Texas, when 23 ports were closed and over 700 roads were deemed impassable.148 Consequences of extreme events can be magnified when events are cumulative. The 2017 hurricanes impacting the southern Atlantic and Gulf Coasts and Puerto Rico created rising freight costs because freight carriers had to deal with poor traveling conditions, an unreliable fuel stock, and limited exports for the return trip.149,150 Low-income populations have been linked to differences in perceived risks associated with an extreme event, in how they respond, and in their ability to evacuate or relocate.151 Delays in evacuations can potentially lead to significant transportation delays, affecting the timeliness of first responders and evacuations. National- and local-level decision-makers are considering strategies during storm recovery and its aftermath to identify and support vulnerable populations to ensure transportation and access to schools, work, and community services (for example, the 2016 Baton Rouge flood event).
Similar to the urban and suburban scenarios, rural areas across the country have also experienced disruptions and impacts from climate events. Hurricane Irene resulted in the damage or destruction of roads throughout New England, resulting in small towns being isolated throughout the region.152 Similarly, Hurricane Katrina devastated rural community infrastructure across the Gulf Coast, which resulted in extended periods of isolation and population movement.153 Lesser-known events are also causing regular impacts to rural communities, such as flood events in 2014 in Minnesota and in 2017 throughout the Midwest, which impacted towns for months due to damaged road infrastructure.154,155
Although flooding events and hurricanes receive significant attention, other weather-based events cause equal or greater impacts to rural areas. Landslide events have isolated rural communities by reducing them to single-road access.156,157 Extreme heat events combined with drought have resulted in increases in wildfire activity that have impacted rural areas in several regions. The impacts of these wildfire events include damage to infrastructure both within rural communities and to access points to the communities.158
As documented, rural communities incur impacts from climate events that are similar to those experienced in urban and suburban communities. However, rural and isolated areas experience the additional concerns of recovering from extreme events with fewer resources and less capacity.111 This difference often results in rural communities facing extended periods of time with limited access for commercial and residential traffic.
Major uncertainties
Realized societal and economic impacts from transportation disruptions vary by extreme event, depending on the intensity and duration of the storm; pre-storm conditions, including cumulative events; planning mechanisms (such as zoning practices); and so on. In addition, a combination of weather stressors, such as heavy precipitation with notable storm surge, can amplify effects on different assets, compounding the societal and economic consequences. These amplifications are poorly understood but directly affect transportation users. Interdependencies among transportation and other lifeline sectors can also have significant impacts on the degree of consequences experienced. These impacts are also poorly understood.
Description of confidence and likelihood
There is medium to high confidence that the urban setting can amplify heat.159 There is also medium to high confidence that transportation networks are impacted by inland and coastal flooding.70 There is medium confidence that socioeconomic conditions are strongly related to a population’s resilience to extreme events.151
There is high confidence that impacts to the transportation network from extreme events are inducing societal and economic consequences, some of which disproportionately affect vulnerable populations (medium confidence). In the absence of intervention, projected changes in climate will likely lead to increasing transportation challenges as a result of system complexity, aging infrastructure with hundreds of billions of dollars in rehabilitation backlogs,13 and dependency across sectors.
Key Message 3: Vulnerability Assessments
Engineers, planners, and researchers in the transportation field are showing increasing interest and sophistication in understanding the risks that climate hazards pose to transportation assets and services (very high confidence). Transportation practitioner efforts demonstrate the connection between advanced assessment and the implementation of adaptive measures, though many communities still face challenges and barriers to action (high confidence).
Description of evidence base
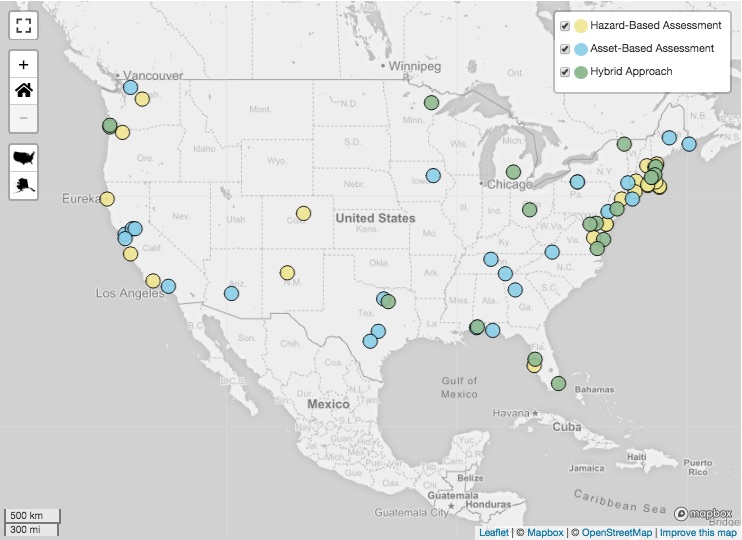
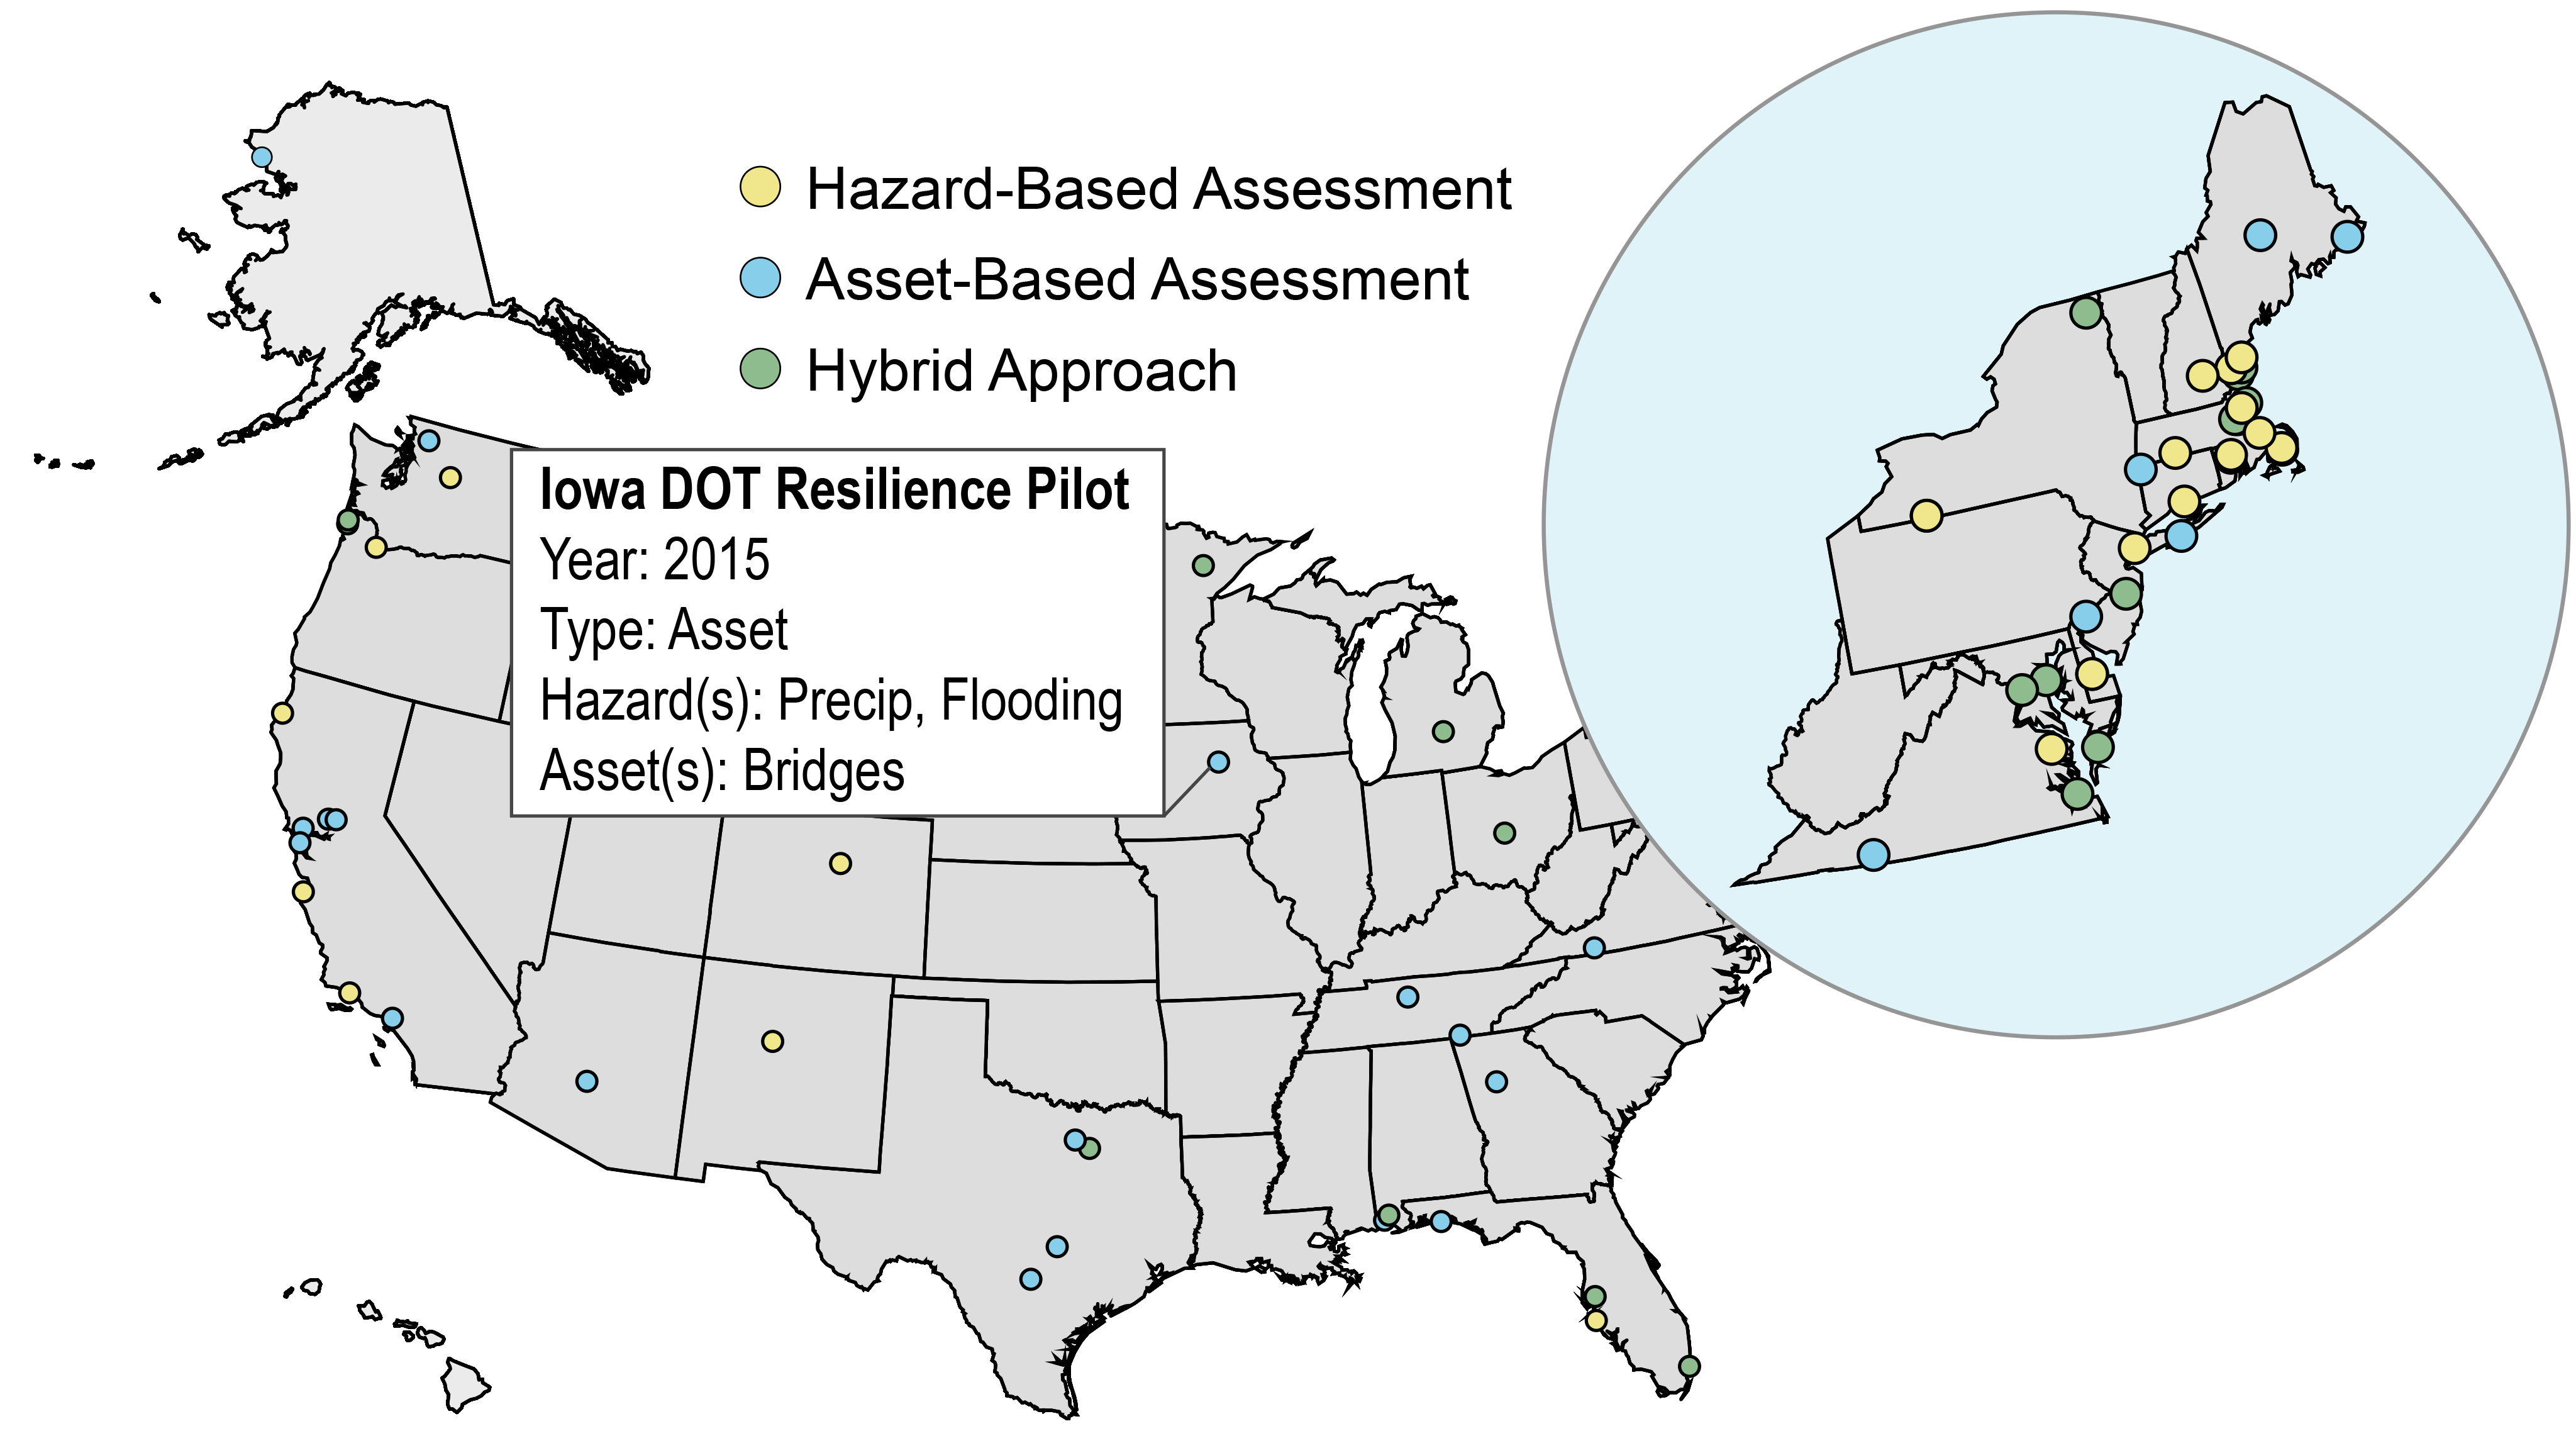
Chapter authors reviewed more than 60 recently published vulnerability assessments (details and links available through the online version of Figure 12.3) conducted by or for states and localities. The research approach involved internet searches, consultations with experts, and leveraging existing syntheses and compilations of transportation-related vulnerability assessments. The authors cast a broad net to ensure that as many assessments as possible were captured in the review. The studies were screened for a variety of metrics (for example, method of assessment, hazard type, asset category, vulnerability assessment type, economic analysis, and adaptation actions), and findings were used to inform the conclusions reached in this section.
Major uncertainties
Most of the literature and the practitioner studies cited for Key Message 3 were gray literature, which is not peer-reviewed but serves the purpose of documenting the state of the practice. This section was not an assessment of the science (that is, the validity of individual study results was not assessed) but surveyed how transportation practitioners are assessing and managing climate impacts. The conclusions are not predicated on selection of or relative benefits of specific modeling or technological advances.
Practitioners’ motivations underlying changes in the state of the practice were derived from information in the studies and from cited literature. The authors of this section did not survey authors of individual vulnerability studies to determine their situation-specific motivations.
Description of confidence and likelihood
There is high confidence regarding the efforts of state and local transportation agencies to understand climate impacts through assessments like those referenced in Figure 12.3. There is medium confidence in the reasons for delay in implementing resilience measures and the motivations for vulnerability assessments. There is no consensus on how emerging transportation technologies will develop in the coming years and how this change will affect climate mitigation, adaptation, and resilience.


