NCA4 Urban
  • ABOUT
    About this Report Guide to this Report Report Credits
  • CHAPTERS

    Front Matter

    • About this Report
    • Guide to the Report
    Summary Findings
    1. Overview

    National Topics

    1. Our Changing Climate
    2. Water
    3. Energy Supply, Delivery & Demand
    4. Land Cover & Land-Use Change
    5. Forests
    6. Ecosystems, Ecosystem Services, & Biodiversity
    7. Coastal Effects
    8. Oceans & Marine Resources
    9. Agriculture & Rural Communities
    10. Built Environment, Urban Systems, & Cities
    11. Transportation

    National Topics (cont.)

    1. Air Quality
    2. Human Health
    3. Tribes & Indigenous Peoples
    4. Climate Effects on U.S. International Interests
    5. Sector Interactions, Multiple Stressors, & Complex Systems

    Regions

    1. Northeast
    2. Southeast
    3. U.S. Caribbean
    4. Midwest
    5. Northern Great Plains
    6. Southern Great Plains
    7. Northwest
    8. Southwest
    9. Alaska
    10. Hawai‘i & U.S.-Affiliated Pacific Islands

    Responses

    1. Reducing Risks Through Adaptation Actions
    2. Reducing Risks Through Emissions Mitigation

    Appendices

    1. Report Development Process
    2. Information in the Fourth National Climate Assessment
    3. Data Tools & Scenario Products
    4. Looking Abroad
    5. Frequently Asked Questions
  • DOWNLOADS
    View All Report Downloads Chapter Executive Summary PDF Full Chapter PDF Chapter Figures (.zip) Chapter Bibliography (RIS) Chapter Presentation Package
CH 11: Urban
×

FOURTH NATIONAL CLIMATE ASSESSMENT

CHAPTER 11: BUILT ENVIRONMENT, URBAN SYSTEMS, AND CITIES

Key Message 1
Impacts on Urban Quality of Life

The opportunities and resources in urban areas are critically important to the health and well-being of people who work, live, and visit there. Climate change can exacerbate existing challenges to urban quality of life, including social inequality, aging and deteriorating infrastructure, and stressed ecosystems. Many cities are engaging in creative problem solving to improve quality of life while simultaneously addressing climate change impacts.

Read More

Key Message 2
Forward-Looking Design for Urban Infrastructure

Damages from extreme weather events demonstrate current urban infrastructure vulnerabilities. With its long service life, urban infrastructure must be able to endure a future climate that is different from the past. Forward-looking design informs investment in reliable infrastructure that can withstand ongoing and future climate risks.

Read More

Key Message 3
Impacts on Urban Goods and Services

Interdependent networks of infrastructure, ecosystems, and social systems provide essential urban goods and services. Damage to such networks from current weather extremes and future climate will adversely affect urban life. Coordinated local, state, and federal efforts can address these interconnected vulnerabilities.

Read More

Key Message 4
Urban Response to Climate Change

Cities across the United States are leading efforts to respond to climate change. Urban adaptation and mitigation actions can affect current and projected impacts of climate change and provide near-term benefits. Challenges to implementing these plans remain. Cities can build on local knowledge and risk management approaches, integrate social equity concerns, and join multicity networks to begin to address these challenges.

Read More

Key Message 1

The opportunities and resources in urban areas are critically important to the health and well-being of people who work, live, and visit there. Climate change can exacerbate existing challenges to urban quality of life, including social inequality, aging and deteriorating infrastructure, and stressed ecosystems. Many cities are engaging in creative problem solving to improve quality of life while simultaneously addressing climate change impacts.

Key Message 2

Damages from extreme weather events demonstrate current urban infrastructure vulnerabilities. With its long service life, urban infrastructure must be able to endure a future climate that is different from the past. Forward-looking design informs investment in reliable infrastructure that can withstand ongoing and future climate risks.

Key Message 3

Interdependent networks of infrastructure, ecosystems, and social systems provide essential urban goods and services. Damage to such networks from current weather extremes and future climate will adversely affect urban life. Coordinated local, state, and federal efforts can address these interconnected vulnerabilities.

Key Message 4

Cities across the United States are leading efforts to respond to climate change. Urban adaptation and mitigation actions can affect current and projected impacts of climate change and provide near-term benefits. Challenges to implementing these plans remain. Cities can build on local knowledge and risk management approaches, integrate social equity concerns, and join multicity networks to begin to address these challenges.

Likelihood

Virtually Certain Extremely Likely Very Likely Likely About as Likely as Not Unlikely Very Unikely Extremely Unlikely Exceptionally Unlikely
99%–100% 95%–100% 90%–100% 66%-100% 33%-66% 0%-33% 0%-10% 0%-5% 0%-1%

Confidence Level

Very High High Medium Low
Strong evidence (established theory, multiple sources, consistent results, well documented and accepted methods, etc.), high consensus Moderate evidence (several sources, some consistency, methods vary and/or documentation limited, etc.), medium consensus Suggestive evidence (a few sources, limited consistency, models incomplete, methods emerging, etc.), competing schools of thought Inconclusive evidence (limited sources, extrapolations, inconsistent findings, poor documentation and/or methods not tested, etc.), disagreement or lack of opinions among experts
 

Documenting Uncertainty: This assessment relies on two metrics to communicate the degree of certainty in Key Findings. See Guide to this Report for more on assessments of likelihood and confidence.

  • SECTIONS
  • Executive Summary
  • Introduction
  • State of the Sector
  • Regional Summary
  • KM 1: Quality of Life
  • KM 2: Infrastructure
  • KM 3: Goods & Services
  • KM 4: Response to Climate Change
  • Traceable Accounts
  • References

EXECUTIVE SUMMARY:
Chapter 11: Built Environment, Urban Systems, and Cities

Urban areas, where the vast majority of Americans live, are engines of economic growth and contain land valued at trillions of dollars. Cities around the United States face a number of challenges to prosperity, such as social inequality, aging and deteriorating infrastructure, and stressed ecosystems. These social, infrastructure, and environmental challenges affect urban exposure and susceptibility to climate change effects.

Urban areas are already experiencing the effects of climate change. Cities differ across regions in the acute and chronic climate stressors they are exposed to and how these stressors interact with local geographic characteristics. Cities are already subject to higher surface temperatures because of the urban heat island effect, which is projected to get stronger. Recent extreme weather events reveal the vulnerability of the built environment (infrastructure such as residential and commercial buildings, transportation, communications, energy, water systems, parks, streets, and landscaping) and its importance to how people live, study, recreate, and work. Heat waves and heavy rainfalls are expected to increase in frequency and intensity. The way city residents respond to such incidents depends on their understanding of risk, their way of life, access to resources, and the communities to which they belong. Infrastructure designed for historical climate trends is vulnerable to future weather extremes and climate change. Investing in forward-looking design can help ensure that infrastructure performs acceptably under changing climate conditions.

Urban areas are linked to local, regional, and global systems. Situations where multiple climate stressors simultaneously affect multiple city sectors, either directly or through system connections, are expected to become more common. When climate stressors affect one sector, cascading effects on other sectors increase risks to residents’ health and well-being. Cities across the Nation are taking action in response to climate change. U.S. cities are at the forefront of reducing greenhouse gas emissions and many have begun adaptation planning. These actions build urban resilience to climate change.


Projected Change in the Number of Very Hot Days

Projected Change in the Number of Very Hot Days
Multiple charts show projected increases in the annual number of very hot days, defined by temperature thresholds specific to each of the five U.S. cities shown. Projected 5th, 50th, and 95th percentile values are shown under the lower RCP4.5 scenario and the higher RCP8.5 scenario for the periods 2016 to 2045, 2036 to 2065, and 2070 to 2099. Increases in the annual number of very hot days are projected for all five cities under both scenarios and over all three time periods. Historical values are given for these same temperature thresholds and indicate that over the period from 1976 to 2005, Phoenix averaged 9.5 days per year with temperatures over 110 degrees Fahrenheit; Fort Collins averaged 5 days per year with temperatures over 90 degrees; Dubuque averaged 8.8 days per year with temperatures over 90 degrees; Pittsburgh averaged 7.2 days per year with temperatures over 90 degrees; and Charleston averaged 9 days per year with temperatures over 95 degrees. The median, end-of-century projected increase under the lower scenario is around 30 days per year (over historical values) in Phoenix, Dubuque, Pittsburgh, and Charleston and is about 15 days per year for Fort Collins. Under the higher scenario, median increases are more than 60 days per year (over historical values) in Phoenix, Dubuque, Pittsburgh, and Charleston and about 35 days per year for Fort Collins.
Projected increases in the number of very hot days (compared to the 1976–2005 average) are shown for each of five U.S. cities under lower (RCP4.5) and higher (RCP8.5) scenarios. Here, very hot days are defined as those on which the daily high temperature exceeds a threshold value specific to each of the five U.S. cities shown. Dots represent the modeled median (50th percentile) values, and the vertical bars show the range of values (5th to 95th percentile) from the models used in the analysis. Modeled historical values are shown for the same temperature thresholds, for the period 1976–2005, in the lower left corner of the figure. These and other U.S. cities are projected to see an increase in the number of very hot days over the rest of this century under both scenarios, affecting people, infrastructure, green spaces, and the economy. Increased air conditioning and energy demands raise utility bills and can lead to power outages and blackouts. Hot days can degrade air and water quality, which in turn can harm human health and decrease quality of life. From Figure 11.2 (Sources: NOAA NCEI, CICS-NC, and LMI).

CHAPTER 11
Built Environment, Urban Systems, and Cities

Introduction

Federal Coordinating Lead Author:
Susan Julius, U.S. Environmental Protection Agency
Chapter Lead:
Keely Maxwell, U.S. Environmental Protection Agency
Chapter Authors:
Anne Grambsch, U.S. Environmental Protection Agency (Retired)
Ann Kosmal, U.S. General Services Administration
Libby Larson, National Aeronautics and Space Administration
Nancy Sonti, U.S. Forest Service
Review Editor:
Jesse Keenan, Harvard University
Technical Contributors:
Julie Blue, Eastern Research Group, Inc.
Kevin Bush, U.S. Department of Housing and Urban Development (through August 2017)
USGCRP Coordinators:
Natalie Bennett, Adaptation and Assessment Analyst
Fredric Lipschultz, Senior Scientist and Regional Coordinator

<b>Maxwell</b>, K., S. Julius, A. Grambsch, A. Kosmal, L. Larson, and N. Sonti, 2018: Built Environment, Urban Systems, and Cities. In <i>Impacts, Risks, and Adaptation in the United States: Fourth National Climate Assessment, Volume II</i> [Reidmiller, D.R., C.W. Avery, D.R. Easterling, K.E. Kunkel, K.L.M. Lewis, T.K. Maycock, and B.C. Stewart (eds.)]. U.S. Global Change Research Program, Washington, DC, USA, pp. 438–478. doi: 10.7930/NCA4.2018.CH11

  • U.S. Climate Resilience Toolkit
  • Scenarios for the National Climate Assessment

Recent extreme weather events reveal the vulnerability of the built environment (infrastructure, such as residential and commercial buildings, transportation, communications, energy, water systems, parks, streets, and landscaping) and its importance to how people live, study, recreate, and work in cities. This chapter builds on previous assessments of urban social vulnerability and climate change impacts on urban systems.1,2,3 It discusses recent science on urban social and ecological systems underlying vulnerability, impacts on urban quality of life and well-being, and urban adaptation. It also reviews the increase in urban adaptation activities, including investment, design, and institutional practices to manage risk. Examples of climate impacts and responses from five cities (Charleston, South Carolina; Dubuque, Iowa; Fort Collins, Colorado; Phoenix, Arizona; and Pittsburgh, Pennsylvania) illustrate the diversity of American cities and the climate risks they face.

State of the Sector


Figure 11.1: Current and Projected U.S. Population

Current and Projected U.S. Population
Three maps of the contiguous United States are shown. The top map shows population by county in 2010, while the bottom two maps show population projections by county for the year 2100 under a lower and a higher Shared Socioeconomic Pathway, or SSP, respectively. Under the lower SSP, urbanization trends do not shift markedly from current patterns. The most significant change is expected in the rural counties of Nebraska, Kansas, Oklahoma, and Texas, where populations in the 10,000s will rise into the 100,000s. Under the higher SSP, population trends observed in 2010 are projected to become more pronounced, with population centers, including Los Angeles and Orange Counties in Southern California and counties surrounding the New York and Philadelphia metropolitan areas, projected to increase to more than 62 million. Populations in Miami-Dade and Cook Counties, as well as counties surrounding the Chicago and the Dallas-Fort Worth metropolitan areas, are projected to increase from their 2010 populations of 10 million to more than 35 million.
Figure 11.1: These maps show current population along with population projections by county for the year 2100. Projected populations are based on Shared Socioeconomic Pathways (SSPs)—a collection of plausible future pathways of socioeconomic development.8 The middle map is based on demography consistent with the SSP2, which follows a middle-of-the-road path where trends do not shift markedly from historical patterns. The bottom map uses demography consistent with SSP5, which follows a more rapid technical progress and resource-intensive development path. Increasing urban populations pose challenges to planners and city managers as they seek to maintain and improve urban environments. Data are unavailable for the U.S. Caribbean, Alaska, and Hawai‘i & U.S.-Affiliated Pacific Islands regions. Source: EPA

SHRINK

Urban areas in the United States, where the vast majority of Americans live, are engines of economic growth and contain land valued at trillions of dollars. In 2015, nearly 275 million people (about 85% of the total U.S. population) lived in metropolitan areas, and 27 million (about 8%) lived in smaller micropolitan areas.4 Metropolitan areas accounted for approximately 91% of U.S. gross domestic product (GDP) in 2015, with over 23% coming from the five largest cities alone.5 Urban land values are estimated at more than two times the 2006 national GDP.6 Urbanization trends are expected to continue (Figure 11.1), and projections suggest that between 425 and 696 million people will live in metropolitan and micropolitan areas combined by 2100.7 All of these factors affect how urban areas respond to climate change.

Cities around the United States face a number of challenges to prosperity, such as social inequality, aging and deteriorating infrastructure, and stressed ecosystems. Urban social inequality is evident in disparities in per capita income, exposure to violence and environmental hazards, and access to food, services, transportation, outdoor space, and walkable neighborhoods.9,10,11,12 Cities are connected by networks of infrastructure, much of which is in need of repair or replacement. Failing to address aging and deteriorating infrastructure is expected to cost the U.S. GDP as much as $3.9 trillion (in 2015 dollars) by 2025.13 Current infrastructure and building design standards do not take future climate trends into account.14 Urbanization affects air, water, and soil quality and increases impervious surface cover (such as cement and asphalt).15,16,17 Urban forests, open space, and waterways provide multiple benefits, but many are under stress because of land-use change, invasive species, and pollution.18 These social, infrastructure, and environmental challenges affect urban exposure and susceptibility to climate change effects.

Urban areas, where the majority of the U.S. population lives and most consumption occurs, are the source of approximately 80% of North American human-caused greenhouse gas (GHG) emissions, despite only occupying 1%–5% of the land. Therefore, changes to urban activities can have a significant impact on national GHG emissions.19 Land use and land-cover change contribute to radiative forcing, and infrastructure design can lock in fossil fuel dependency, so urban development patterns will continue to affect carbon sources and sinks in the future (Ch. 5: Land Changes).19,20,21 Many cities in the United States are working to reduce their GHG emissions and can be key leverage points in mitigation efforts.

Regional Summary


Figure 11.2: Projected Change in the Number of Very Hot Days

Projected Change in the Number of Very Hot Days
Multiple charts show projected increases in the annual number of very hot days, defined by temperature thresholds specific to each of the five U.S. cities shown. Projected 5th, 50th, and 95th percentile values are shown under the lower RCP4.5 scenario and the higher RCP8.5 scenario for the periods 2016 to 2045, 2036 to 2065, and 2070 to 2099. Increases in the annual number of very hot days are projected for all five cities under both scenarios and over all three time periods. Historical values are given for these same temperature thresholds and indicate that over the period from 1976 to 2005, Phoenix averaged 9.5 days per year with temperatures over 110 degrees Fahrenheit; Fort Collins averaged 5 days per year with temperatures over 90 degrees; Dubuque averaged 8.8 days per year with temperatures over 90 degrees; Pittsburgh averaged 7.2 days per year with temperatures over 90 degrees; and Charleston averaged 9 days per year with temperatures over 95 degrees. The median, end-of-century projected increase under the lower scenario is around 30 days per year (over historical values) in Phoenix, Dubuque, Pittsburgh, and Charleston and is about 15 days per year for Fort Collins. Under the higher scenario, median increases are more than 60 days per year (over historical values) in Phoenix, Dubuque, Pittsburgh, and Charleston and about 35 days per year for Fort Collins.
Figure 11.2: Projected increases in the number of very hot days (compared to the 1976–2005 average) are shown for each of five U.S. cities under lower (RCP4.5) and higher (RCP8.5) scenarios. Here, very hot days are defined as those on which the daily high temperature exceeds a threshold value specific to each of the five U.S. cities shown. Dots represent the modeled median (50th percentile) values, and the vertical bars show the range of values (5th to 95th percentile) from the models used in the analysis. Modeled historical values are shown for the same temperature thresholds, for the period 1976–2005, in the lower left corner of the figure. These and other U.S. cities are projected to see an increase in the number of very hot days over the rest of this century under both scenarios, affecting people, infrastructure, green spaces, and the economy. Increased air conditioning and energy demands raise utility bills and can lead to power outages and blackouts. Hot days can degrade air and water quality, which in turn can harm human health and decrease quality of life. Sources: NOAA NCEI, CICS-NC, and LMI.

EXPAND

Urban areas in the United States are already experiencing the effects of climate change. Across regions, U.S. cities differ in the acute and chronic climate stressors they are exposed to and how these stressors interact with local geographic characteristics.1 In coastal areas, the built environment is subject to storm surge, high tide flooding, and saltwater intrusion (Ch. 8: Coastal, KM 1). Wildfires are on the rise in the West, lowering air quality and damaging property in cities near the wildland–urban interface (Ch. 6: Forests, KM 1; Ch. 13: Air Quality, KM 2; Ch. 14: Human Health, KM 1; Ch. 24: Northwest, KM 3; Ch. 25: Southwest, KM 2). In 2017, Los Angeles witnessed the largest wildfire in its history, with over 700 residents ordered to evacuate. The fire began during a heat wave and burned over 7,100 acres.22 Key climate threats in the Northeast, on the other hand, are from precipitation and flooding: between 2007 and 2013, Pittsburgh experienced 11 significant flash flooding events23,24 (Ch. 18: Northeast, KM 3). Heat waves (Figure 11.2) and heavy rainfalls (Figure 11.3) are expected to increase in frequency and intensity (Ch. 2: Climate KM 2 and 5).25,26,27 The way city residents respond to such incidents depends on their understanding of risk, their way of life, access to resources, and the communities to which they belong.28

In other parts of the country, drought conditions coupled with extreme heat increase wildfire risk, and rainfall after wildfires raises flood risks.21 In 2012 and 2013, fires destroyed hundreds of homes in the Fort Collins area of the Northern Great Plains region. In those same years, floods washed out transportation infrastructure and caused $2 billion (in 2013 dollars) in total damages.34,35

Despite these differences, U.S. cities experience some climate impacts in similar ways. For example, prolonged periods of high heat affect urban areas around the country.21 Cities are already subject to higher surface temperatures because of the urban heat island (UHI) effect, which can also affect regional climate.29 The UHI is projected to get stronger with climate change.29 Another commonality is that most cities are subject to more than one climate stressor. Exposure to multiple climate impacts at once affects multiple urban sectors, and the results can be devastating.30 Over a four-day period in 2015, the coastal city of Charleston in the Southeast region experienced extreme rainfall, higher sea levels, and high tide flooding. These impacts combined to cause dam failures, bridge and road closures, power outages, damages to homes and businesses, and a near shutdown of the local economy (Ch. 19: Southeast, KM 2).31,32,33 These kinds of incidents are expected to continue as climate change brings a higher number of intense hurricanes, high tide flooding, and accelerated sea level rise (Ch. 8: Coastal, KM 1).21


Figure 11.3: Projected Change in the Number of Days with Heavy Precipitation

Projected Change in the Number of Days with Heavy Precipitation
Multiple charts show projected increases in the annual number of days with heavy precipitation, defined by precipitation thresholds specific to each of the five U.S. cities shown. Projected 5th, 50th, and 95th percentile values are shown under the lower RCP4.5 scenario and the higher RCP8.5 scenario for the periods 2016 to 2045, 2036 to 2065, and 2070 to 2099. Increases in the annual number of heavy precipitation days are projected for all five cities under both scenarios and over all three time periods. Historical values are given for these same precipitation thresholds and indicate that over the period from 1976 to 2005, Phoenix averaged 0.06 days per year with precipitation over 2 inches; Fort Collins averaged 0.09 days per year with precipitation over 2 inches; Dubuque averaged 0.02 days per year with precipitation over 4 inches; Pittsburgh averaged 0.02 days per year with precipitation over 3 inches; and Charleston averaged 0.11 days per year with precipitation over 4 inches. The median, end-of-century projected increase under the lower scenario is around 75 percent per year (over historical values) in Phoenix, Fort Collins, Dubuque, and Charleston and is about 100 percent per year for Pittsburgh. Under the higher scenario, median increases are around 100 percent per year (over historical values) in Phoenix, Fort Collins, and Pittsburgh and more than 100 percent per year for Dubuque. Charleston’s median increase remains at 75 percent per year.
Figure 11.3: Many U.S. cities are projected to see more days with heavy precipitation, increasing the risk of urban flooding, especially in areas with a lot of paved surfaces. Projections of percent changes in the number of days with heavy precipitation (compared to the 1976–2005 average) are shown for each of five U.S. cities under lower (RCP4.5) and higher (RCP8.5) scenarios. Here, days with heavy precipitation are defined as those on which the amount of total precipitation exceeds a threshold value specific to each city. Dots represent the modeled median (50th percentile) values, and the vertical bars show the range of values (5th to 95th percentile) from the models used in the analysis. Modeled historical values are shown for the same thresholds, for the period 1976–2005, in the lower left corner of the figure. Historical values are given in terms of frequency (days per year) and return period (average number of years between events). Sources: NOAA NCEI, CICS-NC, and LMI.

EXPAND

Another similarity cities share is that when climate stressors affect one city sector, cascading effects on other sectors increase risks to residents’ health and well-being (Ch. 17: Complex Systems). Higher temperatures can increase energy loads, which in turn can lead to structural failures in energy infrastructure, raise energy bills, and increase the occurrence of power outages (Ch. 4: Energy, KM 1). These changes strain household budgets, increase people’s exposure to heat, and limit the delivery of medical and social services. For all cities, the duration of exposure to a climate stressor determines the degree of impacts. In recent years in the Southwest region, California experienced exceptional drought conditions. Urban and rural areas saw forced water reallocations and mandatory water-use reductions. Utilities had to cut back on electricity production from hydropower because of insufficient surface water flows and water in surface reservoirs (Ch. 25: Southwest, KM 1 and 5).36,37,38

Urban areas are linked to local, regional, and global systems.39,40,41 For example, changes in regional food production and global trade affect local food availability.42 Likewise, urban electricity supply often relies on far-off reservoirs, generators, and grids. Situations where multiple climate stressors simultaneously affect multiple city sectors, either directly or through system connections, are expected to become more common.12,43,44

Cities in all regions of the country are undertaking adaptation and mitigation actions. Several cities have climate action plans in place (see Bierbaum et al. 2013 for a review of U.S. urban adaptation plans45). Pittsburgh made commitments to reduce GHG emissions. Fort Collins initiated the Fort Collins ClimateWise Program. Phoenix is taking measures to reduce the UHI effect. These actions build urban resilience to climate change.

Key Message 1

Impacts on Urban Quality of Life

The opportunities and resources in urban areas are critically important to the health and well-being of people who work, live, and visit there. Climate change can exacerbate existing challenges to urban quality of life, including social inequality, aging and deteriorating infrastructure, and stressed ecosystems. Many cities are engaging in creative problem solving to improve quality of life while simultaneously addressing climate change impacts.

Cities are places where people learn, socialize, recreate, work, and live together. Quality of life for urban residents is associated with social and economic diversity, livelihood opportunities, and access to education, nature, recreation, healthcare, arts, and culture. Urban areas can foster economic prosperity and a sense of place. Yet, many cities in the United States face challenges to prosperity, including social inequality, aging and deteriorating infrastructure, and stressed ecosystems (Ch. 18: Northeast, KM 3).13,18,46 These problems are intertwined. Climate change impacts exacerbate existing challenges to urban quality of life and adversely affect urban health and well-being.

Urban populations experiencing socioeconomic inequality or health problems have greater exposure and susceptibility to climate change.12,47 Climate susceptibility varies by neighborhood, housing situation, age, occupation, and daily activities. People without access to housing with sufficient insulation and air conditioning (for example, renters and the homeless) have greater exposure to heat stress. Children playing outside, seniors living alone, construction workers, and athletes are also vulnerable to extreme heat (Figure 11.4).12,48


Figure 11.4: Threats from Extreme Heat

Threats from Extreme Heat
Two thermal infrared images show the amount of heat energy emitted from playground equipment in a park in Phoenix, Arizona, at midday in September 2014. In the first image, the surface temperatures of a slide and the dark rubber flooring beneath it (which are both exposed to direct sunlight) have reached 160 degrees and 180 degrees Fahrenheit, respectively. In the second image, the playground’s steps have reached a temperature of 136 degrees Fahrenheit.
Figure 11.4: These images show surface temperatures of playground equipment in metropolitan Phoenix, Arizona. Children are particularly susceptible to high heat12 and can be exposed through daily activities. (A) A slide and dark rubber surface in the sun (orange/red colors are shown reaching temperatures of 71°C [160°F] and 82°C [180°F], respectively. The blue/green colors are under a shade sail. (B) Playground steps made of black powder-coated metal are shown reaching a temperature of 58°C (136°F) in the direct sunlight. Images use infrared thermography and were taken mid-day on September 15, 2014. Credit: Vanos et al. 2016.49

SHRINK

In addition to temperature extremes, climate change adversely affects urban population health through air and water quality and vector-borne diseases (Ch. 14: Human Health, KM 1). Urban residents feel economic impacts from food price volatility and the costs of insurance, energy, and water.12,50 Climate change also threatens the integrity of personal property, ecosystems, historic landmarks, playgrounds, and cultural sites such as libraries and museums, all of which support an urban sense of place and quality of life (Ch. 24: Northwest, KM 2).51,52,53 For example, historic landmarks in Charleston are at risk from sea level rise.54 Urban ecosystems are further stressed by often unpredictable climate-related changes to tree species ranges, water cycles, and pest regimes.55

Coastal city flooding can result in forced evacuation, adversely affecting family and community stability, as well as mental and physical health (Ch. 14: Human Health, KM 1).12 It also poses significant challenges to inland urban areas receiving these populations.56,57 Many cities are undertaking creative problem solving to address climate change impacts and quality of life. They use approaches from urban design, sustainability, and climate justice.58,59,60 For example, New York City’s Trees for Public Health program targets street tree planting in neighborhoods of greatest need to improve the UHI effect, asthma rates, crime rates, and property values.61

Key Message 2

Forward-Looking Design for Urban Infrastructure

Damages from extreme weather events demonstrate current urban infrastructure vulnerabilities. With its long service life, urban infrastructure must be able to endure a future climate that is different from the past. Forward-looking design informs investment in reliable infrastructure that can withstand ongoing and future climate risks.

Urban infrastructure needs to perform reliably throughout its long service life. Infrastructure designed for historical climate trends is more vulnerable to future weather extremes and climate change. Impacts include changes in building enclosure vapor drive, energy performance, and corrosion of structures.14,62 Above- and below-grade transportation systems are at increased risk from flooding and degradation that reduces expected service life (Ch. 12: Transportation, KM 1). Higher temperatures increase stress on cooling systems to perform as designed. High indoor temperatures reduce thermal comfort and office worker productivity, potentially requiring building closures. Over time, sea level rise and flooding are expected to destroy, or make unusable, properties and public infrastructure in many U.S. coastal cities (Ch. 8: Coastal, KM 1). Investor costs increase when infrastructure is degraded, damaged, or abandoned ahead of its anticipated useful life.63,64

Damages from extreme weather events demonstrate existing infrastructure vulnerabilities. Long-term, gradual risks such as sea level rise further exacerbate these vulnerabilities. Current levels of infrastructure investment in the United States are not enough to cover needed repairs and replacement.13 Infrastructure age and disrepair make failure or interrupted service from extreme weather even more likely.13 Heavy rainfall during Arizona’s 2014 monsoon season shut down freeways and city streets in Phoenix because key pumping stations failed.65 Climate change has already altered the likelihood and intensity of some extreme events, and there is emerging evidence that many types of extreme events will increase in intensity, duration, and frequency in the future.27,66,67,68,69 Projecting specific changes in extreme events in particular places remains a challenge.

Costs are felt nationally as business operations, production inputs, and supply chains are affected.70,71 Higher temperatures reduce labor productivity in construction and other outdoor industries.12,44,72,73 Upgrades to buildings and the electrical grid are needed to handle higher temperatures.74,75,76 Risk portfolios in the housing finance, municipal bond, and insurance industries may need to be adjusted.44,72,77 Forward-looking design and risk management approaches support the achievement of design and investment performance goals.78,79,80,81

Flash Flooding Impacts Urban Infrastructure and Well-Being

Flash Flooding Impacts Urban Infrastructure and Well-Being
A photo shows a stalled car in the middle of a flooded, tree-lined roadway in Pittsburgh, Pennsylvania, in 2011. The flood waters have risen up to the hood of the car. The light from overhead streetlamps reflects off of the water’s surface.
Figure 11.5: Flash flooding overwhelmed drainage systems and swamped roadways in Pittsburgh, Pennsylvania, in …

EXPAND

Incorporating climate projections into infrastructure design, investment and appraisal criteria, and model building codes is uncommon.82,83,84,85,86,87,88,89 Standardized methodologies do not exist,62,90,91,92 and the incorporation of climate projections is not required in the education or licensing of U.S. design, investment, or appraisal professionals.80,93,94,95 Building codes and rating systems tend to be focused on current short-term, extreme weather. Investment and design standards, professional education and licensing, building codes, and zoning that use forward-looking design can protect urban assets and limit investor risk exposure.83,96,97,98

A handful of cities have begun to take a longer-term view toward planning.99,100,101 These cities have developed adaptation plans, resilience guidelines, and risk-informed frameworks. However, they do not yet have a portfolio of completed projects.59,102 Adaptation planning is not always informed by technical analysis of changing hazards, climate vulnerability assessments, and monitoring and control systems.79 U.S. cities can examine methods and learn from completed projects, such as those developed by Engineers Canada and UKCIP Design for Future Climate.62,90 Managing climate risks promotes the integrity, efficiency, and safety of infrastructure to ensure reliable performance over the infrastructure’s service life.14,81

Key Message 3

Impacts on Urban Goods and Services

Interdependent networks of infrastructure, ecosystems, and social systems provide essential urban goods and services. Damage to such networks from current weather extremes and future climate will adversely affect urban life. Coordinated local, state, and federal efforts can address these interconnected vulnerabilities.

The essential goods and services that form the backbone of urban life are increasingly vulnerable to climate change. Cities are hubs of production and consumption of goods, and they are enmeshed in regional-to-global supply chains. They rely on local services and interdependent networks for telecommunications, energy, water, healthcare, transportation, and more (Ch. 4: Energy, KM 1; Ch. 3: Water, KM 1; Ch. 14: Human Health, KM 2; Ch. 12: Transportation, KM 2; Ch. 17: Complex Systems, KM 1). Gradual and abrupt climate changes disrupt the flow of these goods and services.44 For example, the 2012 High Park Fire in Colorado had wide-reaching impacts on air and water quality. The city of Fort Collins experienced air quality that was seven times worse than the daily average (Ch. 13: Air Quality, KM 2).103 Storms washed ash and debris into the Cache la Poudre River, polluting the city’s drinking water source for residents and industries.104 In another example, two inches of rain fell in a single hour in Pittsburgh in August 2011. Four people died in the resulting flash flood. Impervious surfaces and combined sewer systems contribute to urban flash flooding risks (Figure 11.5).105 For similar examples of cascading impacts, see Chapter 17: Complex Systems, Box 17.1 on Hurricane Harvey and Box 17.5 on the 2003 Northeast Blackout. Figure 11.6 describes how heavy rainfalls, which are projected to increase with climate change, can disrupt the flow of goods and services to urban residents through increased runoff and localized flooding.


Figure 11.6: Cascading Consequences of Heavy Rainfall for Urban Systems

Cascading Consequences of Heavy Rainfall for Urban Systems
An illustration shows the cascading impacts of heavy rainfall on urban systems. For example, in cities with combined sewer systems, storm water runoff can flow into pipes containing sewage from homes and industrial wastewater. Intense rainfall can overwhelm the system so that untreated wastewater overflows into nearby rivers and streams. This in turn causes water pollution and increases the risk of waterborne diseases. Intense rainfall can also cause localized street flooding, which in turn disrupts transportation and damages vehicles and buildings.
Figure 11.6: With heavy downpours increasing nationally, urban areas experience costly impacts. (top) In cities with combined sewer systems, storm water runoff flows into pipes containing sewage from homes and industrial wastewater. Intense rainfall can overwhelm the system so untreated wastewater overflows into rivers. Overflows are a water pollution concern and increase risk of exposure to waterborne diseases. (bottom) Intense rainfall can also result in localized flooding. Closed roads and disrupted mass transit prevent residents from going to work or school and first responders from reaching those in need. Home and commercial property owners may need to make costly repairs, and businesses may lose revenue. Source: EPA.

SHRINK

As interconnections among sectors increase, urban areas are more vulnerable to disruptions.106 For example, energy and water systems are closely intertwined (Ch. 3: Water; Ch. 4: Energy; Ch.17: Complex Systems). Both higher water temperatures and extreme weather that causes power outages affect urban drinking water treatment and distribution. Higher air temperatures increase urban energy demand for cooling and water demand for landscaping. Elevated water temperatures affect cooling for electricity production. Higher river temperatures during periods of low flow can require power plants to shut down or curtail power generation to stay within defined regulatory temperature limits. Higher energy loads raise the risk of power outages. Flooding can drown electrical substations. Disruptions to water and power supplies can result in problems—such as unsafe drinking water, limited access to money systems, no functioning gas stations, few available modes of transportation, no air conditioning or heating, and limited ability to communicate with others—that pose risks to urban dwellers.

Climate change also threatens food security in urban areas.107,108 Loss of electricity from extreme weather leads to food spoilage. Transportation disruptions along the supply chain limit food mobility. Heat effects on agricultural labor impact product availability. Changes to the food supply generally lead to price volatility and food shortages, affecting household budgets and nutrition, cultural foodways, and food service profits. Urban populations who already experience food insecurity are likely to be affected the most.

Targeted coordination that addresses interconnected vulnerabilities can build urban resilience to climate change.109,110,111 Coordination may involve municipal offices, public–private partnerships, or state and local agencies. The Charleston Resilience Network, for example, brought together public safety and health services, business organizations, and the state transportation department to discuss their performance during the region’s October 2015 floods and to identify best practices to improve resilience.112

Key Message 4

Urban Response to Climate Change

Cities across the United States are leading efforts to respond to climate change. Urban adaptation and mitigation actions can affect current and projected impacts of climate change and provide near-term benefits. Challenges to implementing these plans remain. Cities can build on local knowledge and risk management approaches, integrate social equity concerns, and join multicity networks to begin to address these challenges.

Cities across the United States are taking action in response to climate change for a number of reasons: recent extreme weather events, available financial resources, motivated leaders, and the goal of achieving co-benefits.113,114,115,116 One strategy being used is to mainstream adaptation and mitigation into land-use, hazard mitigation, development, and capital investment planning.45,115,117 Municipal departments from public works to transportation play roles, as do water and energy utilities, professional societies, school boards, libraries, businesses, emergency responders, museums, healthcare systems, philanthropies, faith-based organizations, nongovernmental organizations, and residents. City governments use a variety of policy mechanisms to achieve adaptation and mitigation goals. They adopt building codes, prioritize green purchasing, enact energy conservation measures, modify zoning, and buy out properties in floodplains. Nongovernmental stakeholders take action through voluntary protocols, rating systems, and public–private partnerships, among other strategies.

U.S. cities are at the forefront of reducing greenhouse gas (GHG) emissions (Ch. 29: Mitigation, KM 1). Urban mitigation actions include acquiring high-performance vehicle fleets and constructing energy efficient buildings. A number of cities are conducting GHG inventories to inform decisions and make commitments to reduce their emissions. Comprehensive urban carbon management involves decisions at many levels of governance.19

Many U.S. cities have also begun adaptation planning. A common approach is to enhance physical protection of urban assets from extreme weather. For example, protection against sea level rise and flooding can involve engineering (such as seawalls and pumps) and ecological solutions (such as wetlands and mangroves) (Ch. 8: Coastal, KM 2).118 Green infrastructure lowers flood risk by reducing impervious surfaces and improving storm water infiltration into the ground.72,119 Green roofs use rooftop vegetation to absorb rainfall. Urban drainage systems can be upgraded to handle increased runoff.72 Climate-resilient building and streetscape design reduces exposure to high temperatures through tree canopy cover and cool roofs with high albedo that reflect sunlight. Ensuring that critical urban infrastructure, such as drinking water systems, continues to provide services through floods or droughts involves a combination of technology, physical protection, and outreach (Ch. 3: Water, KM 3; Ch. 19: Southeast, KM 1).120,121,122

Social and institutional changes are central to urban responses to climate change (Figure 11.7).59,114 Urban development patterns reflect social, economic, and political inequities. As such, decisions about where to prioritize physical protections, install green infrastructure, locate cooling centers, or route public transportation have differential impacts on urban residents.60,123,124,125 If urban responses do not address social inequities and listen to the voices of vulnerable populations, they can inadvertently harm low-income and minority residents.60,123,124


Figure 11.7: Urban Adaptation Strategies and Stakeholders

Urban Adaptation Strategies and Stakeholders
An illustration shows an urban area that has adapted to the impacts of climate change by incorporating greenways, mixed-use buildings, cooling centers, solar panels, and reflective roofing into its infrastructure design. Smaller illustrations along the bottom represent groups involved in adaptation decision-making, including local governments, businesses, schools, and utility providers.
Figure 11.7: Protecting vulnerable people and places from the impacts of climate change involves infrastructure design (for example, green space and highly reflective roofing), along with social and institutional change (such as designating cooling centers). Social equity is supported by widespread participation in adaptation decision-making by non-profit organizations, local businesses, vulnerable populations, school districts, city governments, utility providers, and others. Source: EPA.

SHRINK

Urban actions can reduce climate change impacts on cities.12,126,127,128,129,130 Urban adaptation plans often begin with small steps, such as improving emergency planning or requiring that development be set back from waterways (Ch. 28: Adaptation).59,131 Not all plans address weightier concerns, tradeoffs, behaviors, and values. For example, coastal cities at risk from sea level rise may be constructing storm surge protections, but not discussing the possibility of eventual relocation or retreat (Ch. 8: Coastal, KM 3).59,131 Increasing tree canopy and planting vegetation to manage storm water and provide cooling can increase water use, which may present difficulties for water-strapped cities.132,133

Urban adaptation and mitigation actions can provide near-term benefits to cities, including co-benefits to the local economy and quality of life (Ch. 29: Mitigation, KM 4).3,19,113,134,135,136,137 Tree canopies and greenways increase thermal comfort and improve storm water management. They also enhance air quality, recreational opportunities, and property values (Figure 11.8). Wetlands serve to buffer flooding and are also a source of biodiversity and ecosystem regulation.

Greenway in Dubuque, Iowa

Greenway in Dubuque, Iowa
A photo shows the Bee Branch Creek Greenway in Dubuque, Iowa. Stone walkways, some terraced with grasses and young trees, follow the contour of the creek. Two stone bridges stretch from one side of the greenway to the other, spanning the narrow creek underneath them. City buildings are visible off in the distance.
Figure 11.8: In response to a history of flooding, Dubuque, Iowa, installed the Bee Branch Creek Greenway to …

EXPAND

Urban climate change responses are often constrained by funding, technical resources, existing social inequities, authority, and competing priorities.19,114,119,139,140,141 Coordinating among multiple jurisdictions and agencies is a challenge. Using scarce resources to address future risks is often a lower priority than tackling current problem areas. The absence of locally specific climate data and a standard methodology for estimating urban GHG emissions poses additional obstacles to urban responses.19,72,114 Cities are dependent on state and national policies to modify statewide building codes, manage across landscapes and watersheds, incentivize energy efficiency, and discourage development that puts people and property in harm’s way. Strong leadership and political will are central to addressing these challenges.59,131,142 Many U.S. cities participate in networks such as the U.S. Conference of Mayors, ICLEI, the C40 Cities Climate Leadership Group (C40), and 100 Resilient Cities. Others participate in regional coalitions such as the Southeast Florida Regional Climate Change Compact. Multicity networks support development of urban climate policies and peer-to-peer learning (Ch. 28: Adaptation).59,110,113,117,120,143 Effective urban planning to respond to climate change addresses social inequities and quality of life, uses participatory processes and risk management approaches, builds on local knowledge and values, encourages forward-looking investment, and coordinates across sectors and jurisdictions (Ch. 8: Coastal, KM 3).59,60,115,120,124,140,142,144

TRACEABLE ACCOUNTS

Process Description

Report authors developed this chapter through technical discussions of relevant evidence and expert deliberation and through regular teleconferences, meetings, and email exchanges. For additional information on the overall report process, see App. 1: Process. The author team evaluated scientific evidence from peer-reviewed literature, technical reports, and consultations with professional experts and the public via webinar and teleconferences. The scope of this chapter is urban climate change impacts, vulnerability, and response. It covers the built environment and infrastructure systems in the socioeconomic context of urban areas. This chapter updates findings from the Third National Climate Assessment and advances the understanding of previously identified urban impacts by including emerging literature on urban adaptation and emphasizing how urban social and ecological systems are related to the built environment and infrastructure. The five case-study cities were selected because they represent a geographic diversity of urban impacts from wildfire, sea level rise, heat, and inland flooding. The author team was selected based on their experiences and expertise in the urban sector. They bring a diversity of disciplinary perspectives and have a strong knowledge base for analyzing the complex ways that climate change affects the built environment, infrastructure, and urban systems.


KEY MESSAGES

1 2 3 4

Key Message 1: Impacts on Urban Quality of Life

The opportunities and resources in urban areas are critically important to the health and well-being of people who work, live, and visit there (very high confidence). Climate change can exacerbate existing challenges to urban quality of life, including social inequality, aging and deteriorating infrastructure, and stressed ecosystems (high confidence). Many cities are engaging in creative problem solving to improve quality of life while simultaneously addressing climate change impacts (medium confidence).

Description of evidence base

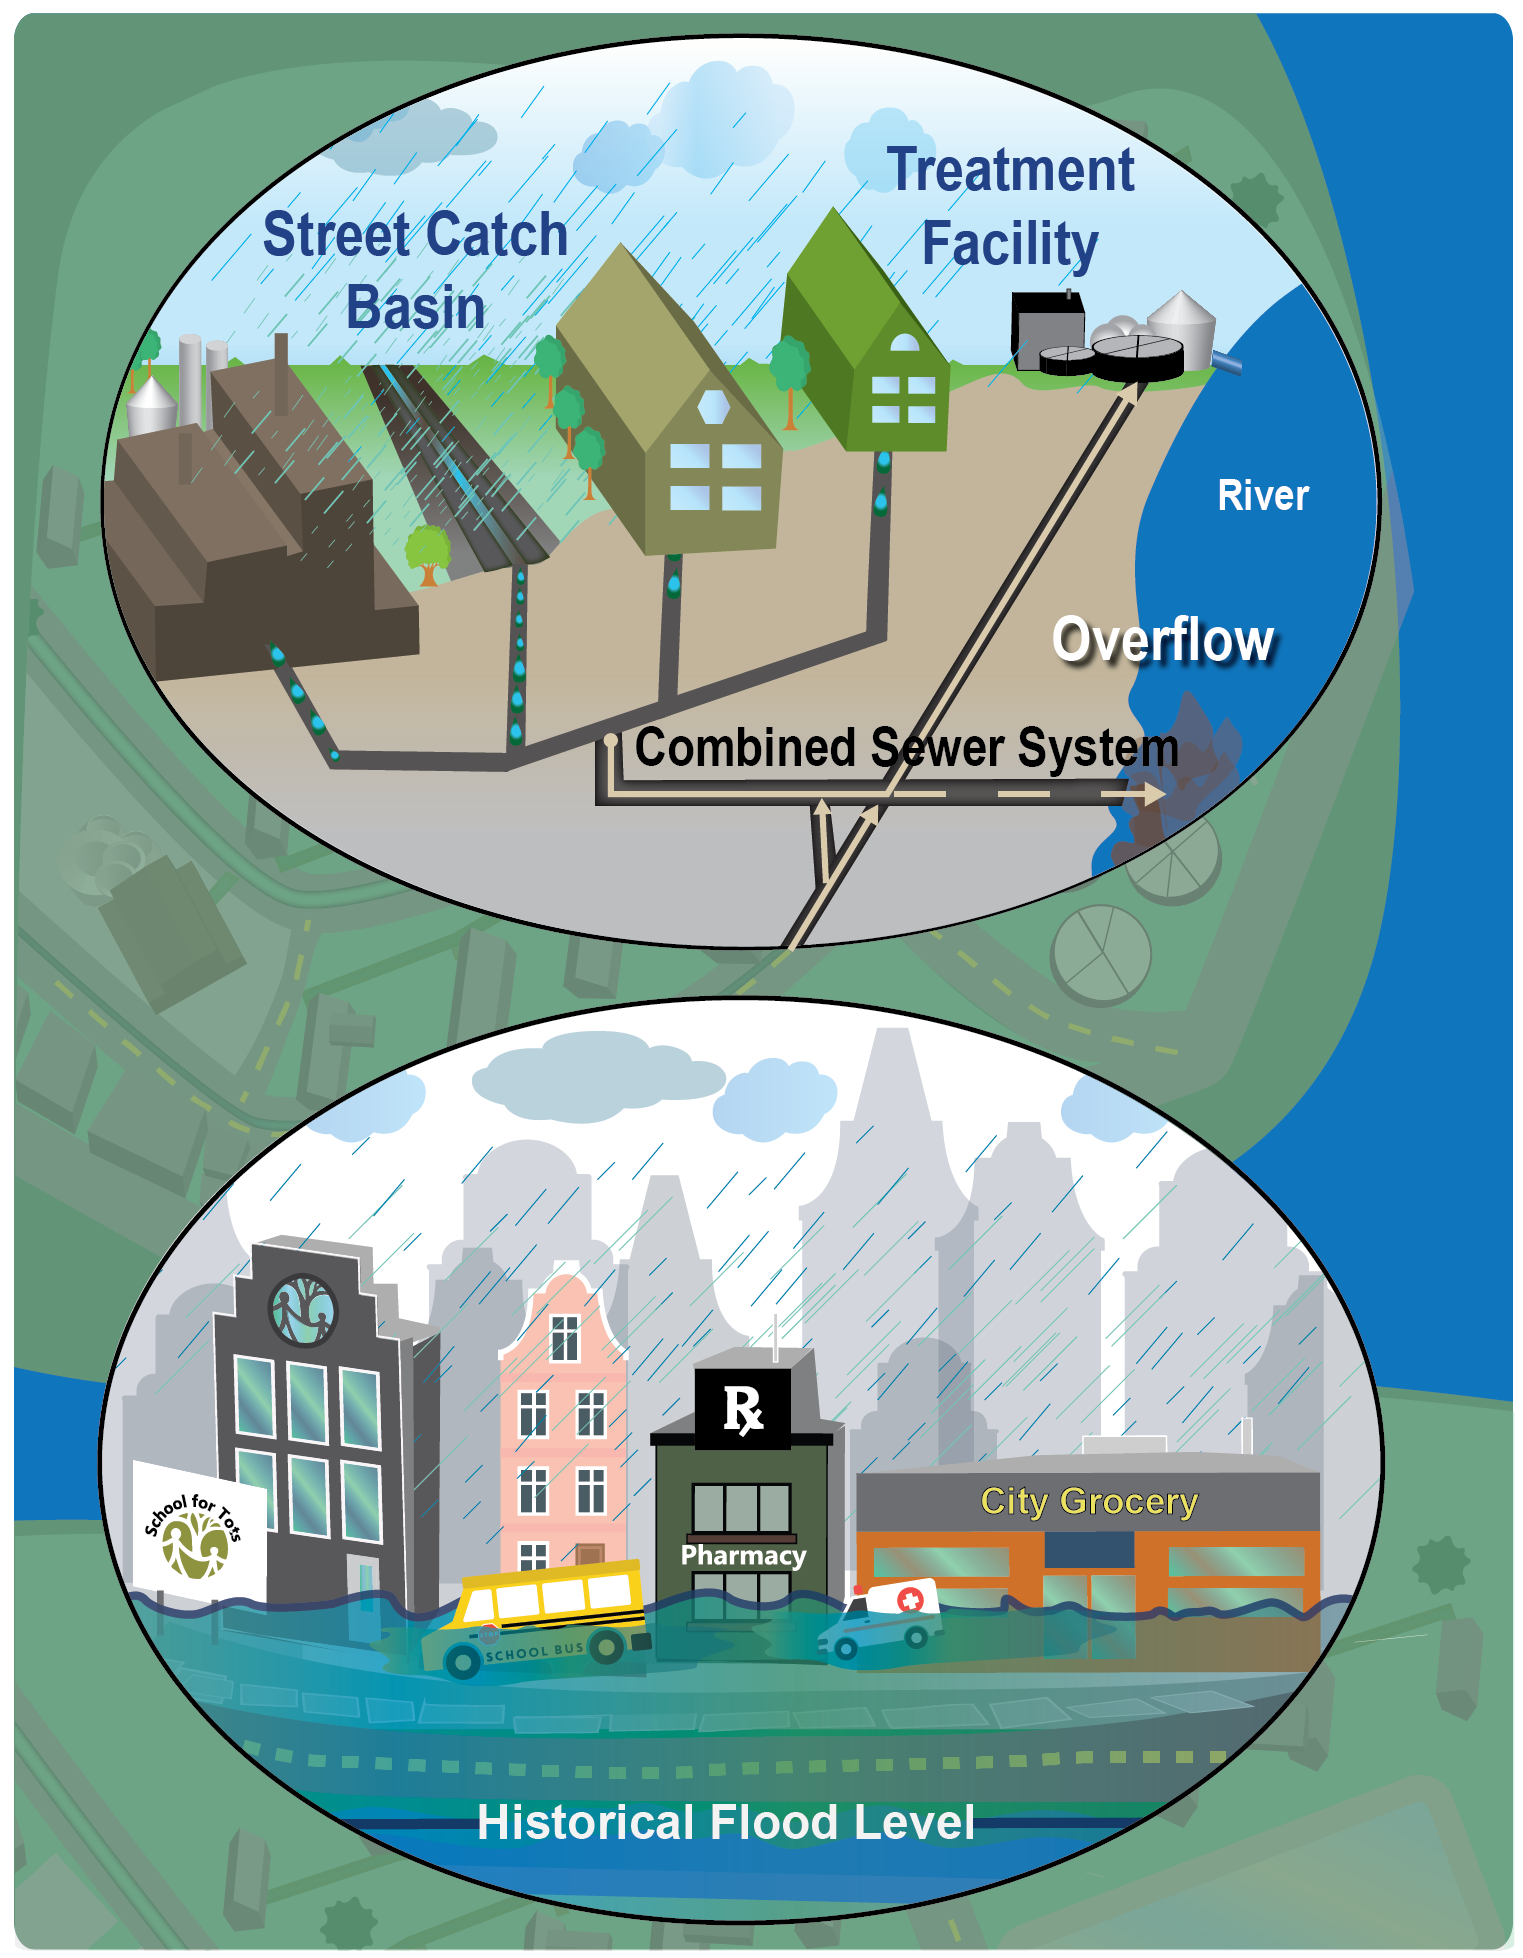
Urban areas provide resources and opportunities for residents’ quality of life.145,146 However, many cities face challenges to prosperity, including aging and deteriorating infrastructure,13 social inequalities,9,46 and lack of economic growth.147,148 These challenges play out differently depending on a city’s geographic location, economic history, urban development pattern, and governance. Studies link urban development with lower air,15 water,16 and soil17 quality; altered microclimates (for example, urban heat islands);149,150 increased risk of certain vector-borne diseases;151 and adverse effects on biodiversity and ecosystem functioning.152,153,154 Exposure to temperature extremes,155 allergens,156 and toxic substances157 and limited access to healthy food10,158,159 and green space11,160,161 create environmental and social vulnerabilities for urban populations. Vulnerabilities are distributed unevenly within cities and reflect social inequalities related to differences in race, class, ethnicity, gender, health, and disability.1 These populations of concern are at a greater risk of exposure to climate change and its impacts.3,46,123

Climate change combines with other trends to increase stress on the health and well-being of urban residents.10,46,155,158 Research demonstrates that climate change can exacerbate many of the vulnerabilities described above. It raises temperatures, alters weather patterns, and increases the frequency and severity of extreme weather events, creating risks to urban ecosystems (such as urban tree cover),162,163,164 infrastructure both above and below grade,165,166,167 historic and cultural sites,51,52,164,168,169,170 and residents’ physical and mental health.171,172,173,174 Coupled with climate change, urban expansion increases the risk of infectious disease175,176 and air quality problems from wildfires.55,177

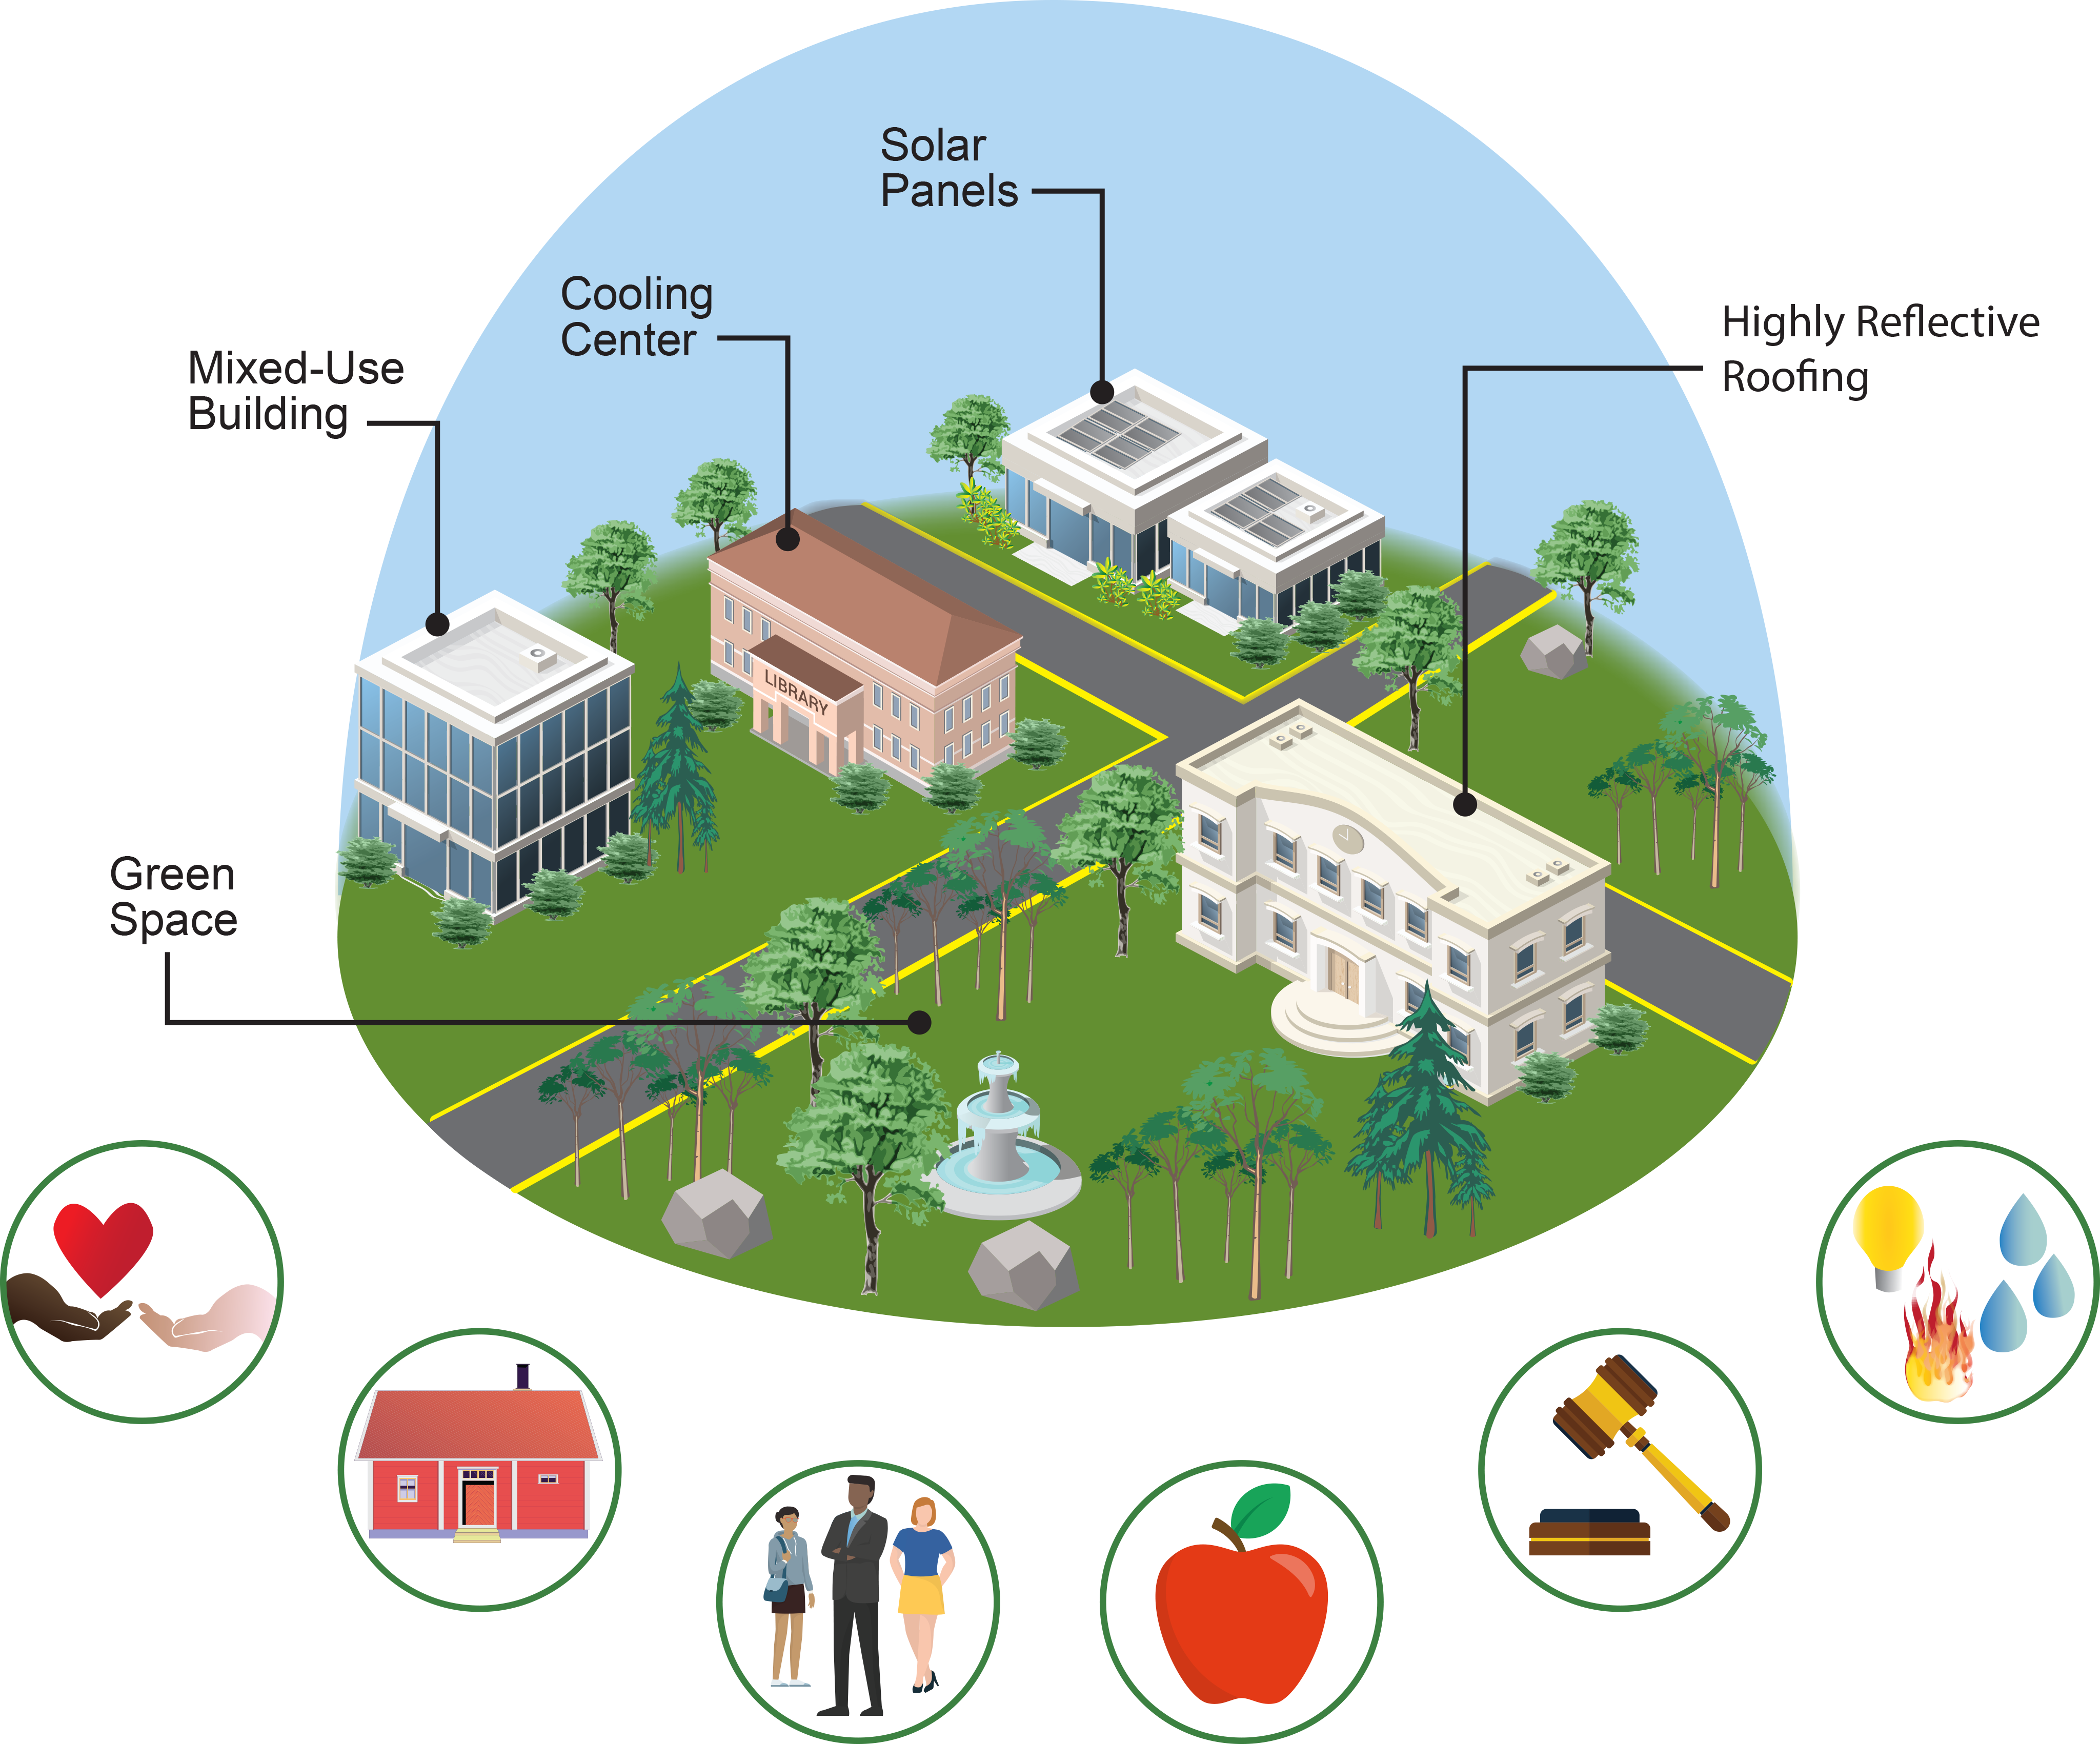
Metropolitan areas often have more resources than rural ones, as reflected in income per capita, employment rates, and workforce education.178,179 Innovative urban problem solving that builds on these resources can take the form of policies and institutional collaborations,58,180 technologies,145,181 eco- and nature-based solutions,182,183 public–private partnerships,59 social network and climate justice initiatives,60,184 “smart” cities,106,145,181 or a combination of approaches. However, cities vary greatly in their capacity to innovate for reasons related to size, staffing, and existing resources.

Major uncertainties

It is difficult to predict future urban trends with certainty. Many factors influence the size and composition of urban populations, development patterns, social networks, cultural resources, and economic growth.180 The degree to which climate change will exacerbate existing urban vulnerabilities depends in part on the frequency and intensity of extreme weather events,145 which are projected with far less certainty than incremental changes in average conditions.81 Moreover, projections are not often made at the city scale.185 Climate change may accelerate urban tree growth, but overall effects on growing conditions depend on a variety of factors.186 These uncertainties make it difficult to predict how climate change and other factors will intersect to affect urban quality of life. Furthermore, quality of life is difficult to measure, although some metrics are available.187

Urban climate vulnerability depends on local social, political, demographic, environmental, and economic characteristics.59,110,145 Urban exposure to climate change depends on geographic factors (such as latitude, elevation, hydrology, distance from the coast).145 Some places may be able to protect quality of life from minor climate stresses but not from extreme, though rare, events.145 The speed and pace of innovative problem solving is difficult to predict, as is its effect on quality of life..59

Description of confidence and likelihood

There is very high confidence that the opportunities and resources available in a particular urban area influence the health and well-being of its residents. There is high confidence that climate change exacerbates challenges to aging and deteriorating infrastructure, degrading urban ecosystems, and urban residents’ health and well-being. There is medium confidence that many cities are engaging in creative problem solving to address the challenges to quality of life posed by climate change. The effectiveness of this response depends on many factors (for example, intensity of extreme weather events, stakeholder collaboration, and internal and external resources available).

Key Message 2: Forward-Looking Design for Urban Infrastructure

Damages from extreme weather events demonstrate current urban infrastructure vulnerabilities (very high confidence). With its long service life, urban infrastructure must be able to endure a future climate that is different from the past (very high confidence). Forward-looking design informs investment in reliable infrastructure that can withstand ongoing and future climate risks (high confidence).

Description of evidence base

There is wide agreement that architects, engineers, and city planners need to consider a range of future climate conditions in urban infrastructure design to guarantee that assets perform for the duration of their expected service lives.14,62,80,81,188,189,190,191,192 Many researchers and professionals from various industries—engineering,80,81,193,194 water resources,195,196 architecture, construction and building science,62,190,197,198,199,200,201,202 transportation,203,204,205 energy,206 and insurance207,208—are actively developing or have proposed strategies to integrate climate change science and infrastructure design. The Government Accountability Office, the State of California, and a variety of professional organizations have recognized the importance of incorporating forward-looking climate information (planning for or anticipating possible future events and conditions) in design standards, building codes, zoning requirements, and professional education and training programs to protect and adapt built systems and structures. This includes the need to develop and adopt design methodologies using risk management principles for uncertainty (see Ch. 28: Adaptation, KM 3 for more discussion)90 and the integration of climate projections, nonstationarity, and extreme value analysis to inform designs that can adapt to a range of future conditions.8,14,80,81,90,188,190,209,210,211,212,213,214,215 Similarly, there is support for incorporating climate change risk considerations into the preparation of financial disclosures.44,96,191,216,217 Reports from multiple sectors highlight the need for licensed design professionals, property industry professionals, and decision-makers to be aware of emerging legal liabilities linked to climate change risks.80,95,208,218,219,220

Numerous studies document substantial economic damages in urban areas following extreme weather events and predict an increase in damages through time as these events occur with greater frequency and intensity.14,165,166,167,205,221 Due to underinvestment in urban infrastructure13,222 and well-documented urban vulnerabilities to the effects of climate change and extreme weather,80,81,223 forward-looking design strategies are critical to the future reliability of urban infrastructure.14,80

Major uncertainties

There are gaps in our understanding of the performance capacity of existing structures exposed to climate change stressors and of the available resources and commitment (at the state, local, tribe, and federal level) to implement forward-looking designs in investments.192,224 The scale and speed with which climate security design principles will be integrated into infrastructure design, investments, and funding sources are difficult to predict, as are the implications for municipal bonds, solvency, and investment transparency.77,83,96,97,98,192 There is also uncertainty regarding how the U.S. legal system will determine the limits of professional liability for climate-related risks for licensed design professionals, attorneys, and investors.95,218,219,220,225

The extent to which key climate stressors will change over the design life of urban systems and structures is uncertain. It depends on the rate of global climate change as well as regional and local factors.150,185,192 Engineering and architectural design is largely concerned with weather extremes,80,81,190,226 which are generally projected with far less certainty than changes in average conditions.81 Action depends on how individual decision-makers weigh the costs and benefits of implementing designs that attempt to account for future climate change. The extent to which the U.S. market is able to innovate to provide these services to the global market is unknown.

Description of confidence and likelihood

There is very high confidence that the integrity of urban infrastructure is and will continue to be threatened by exposure to climate change stressors (for example, more frequent and extreme precipitation events, sea level rise, and heat) and that damages from weather events demonstrate infrastructure vulnerability. Many urban areas have endured high costs from such events, and many of those costs can be attributed to infrastructure failures or damages. There is very high confidence that urban infrastructure will need to endure a future climate that is different from the past in order to fulfill its long service life. There is high confidence that investment in forward-looking design provides a foundation for reliable infrastructure that can withstand ongoing and future climate risks. How much implementing forward-looking design will reduce risks is less clear, since much depends on other factors such as changes in urban population, social inequalities, the broader economy, and rates of climate change.

Key Message 3: Impacts on Urban Goods and Services

Interdependent networks of infrastructure, ecosystems, and social systems provide essential urban goods and services (very high confidence). Damage to such networks from current weather extremes and future climate will adversely affect urban life (medium confidence). Coordinated local, state, and federal efforts can address these interconnected vulnerabilities (medium confidence).

Description of evidence base

Research focusing on urban areas shows that climate change has or is anticipated to have a net negative effect on transportation,43,205,223,227 food,44,107,108 housing,228 the economy,44,228,229,230,231 ecology,3,152 public health,2,3,12,44,231,232 energy,43,44,233,234 water,43,122,228,235 and sports and recreation.2,235,236

Researchers have modeled and documented how negative effects on one system that provides urban goods and services cascade into others that rely on it.3,43,44,109,122,229,231,233,234 Several draw on the example of Superstorm Sandy. These effects scale up to the national economy and across to other sectors, creating longer-term hazards and vulnerabilities.44,99,109,227 The energy–water nexus, defined as the reliance of energy and water systems on each other for functionality, is a good example of documented system interdependency.43,234 Research indicates that direct or high-level climate impacts on a variety of urban sectors (such as transportation, energy, drinking water, storm water) have cascading economic, socioeconomic, and public health consequences.3,12,44,229,231

The literature shows that coordinated resilience planning across sectors and jurisdictions to address interdependencies involves using models and plans,3,43,108,111,227,237,238 finding effective intervention points,109 creating system redundancy,43,237 and motivating behavioral change. Recent reports discuss how interdependencies among energy, water, transportation, and communications services inform adaptation strategies that span sectors.43,227

Major uncertainties

Interconnections among urban systems have been studied less extensively than climate change effects on individual urban sectors, and there are still gaps to be filled.239,240,241 The complexity of urban systems leads to uncertainty and modeling challenges. System models need to account for interconnections, feedback loops, and cascading effects from rural areas, among urban sectors, and within a sector. Creating a comprehensive framework to understand these connections is difficult.239,242 There is a lack of forward-looking models of how projected climate changes will impact interdependent urban systems. Cities do not usually have the range of data needed to fully analyze system connections.102,111 Mixed methods analysis, where professional experience and qualitative data supplement available datasets, may partially compensate for this problem.241 Despite information gaps, urban stakeholders are beginning to address system interconnections in adaptation efforts.59

While it has been demonstrated that climate change affects urban systems, the extent to which climate change will affect a given urban system is difficult to predict. It depends on the unique strengths and vulnerabilities of that system as well as the regional and local climate conditions to which the system is exposed.110,223,243 Modifying factors include spatial layout, age of infrastructure, available resources, and ongoing resilience efforts.43,244 Similarly, critical points of intervention are unique to each urban area. Local-scale analysis of vulnerability and resilience has not been done for most U.S. cities.102,241

The severity of future climate impacts and cascading consequences for urban networks depends on the magnitude of global climate change.223 Urban systems may be able to tolerate some levels of stress with only minor disruptions. Stresses of greater frequency, longer duration, or greater intensity may compromise a system’s ability to function.36,43,109,122,227 Models can reveal changes in the likelihood or frequency of occurrence for a particular type of extreme event (such as a 100-year flood), but they cannot predict when these events will occur or whether they will hit a particular city or town.245

Description of confidence and likelihood

There is very high confidence that urban areas rely on essential goods and services that are vulnerable to climate change because they are part of interdependent networks of infrastructure, ecosystems, and social systems. There is high confidence that extreme weather events have resulted in adverse cascading effects across urban sectors and systems, as there is documentation of a significant number of case studies of urban areas demonstrating these effects. It is projected with medium confidence that network damages from future climate change will disrupt many aspects of urban life, given that the complexity of urban life and the many factors affecting urban resilience to climate change make future disruptions difficult to predict. Similarly, there is medium confidence that addressing interconnected vulnerabilities via coordinated efforts can build urban resilience to climate change.

Key Message 4: Urban Response to Climate Change

Cities across the United States are leading efforts to respond to climate change (high confidence). Urban adaptation and mitigation actions can affect current and projected impacts of climate change and provide near-term benefits (medium confidence). Challenges to implementing these plans remain. Cities can build on local knowledge and risk management approaches, integrate social equity concerns, and join multicity networks to begin to address these challenges (high confidence).

Description of evidence base

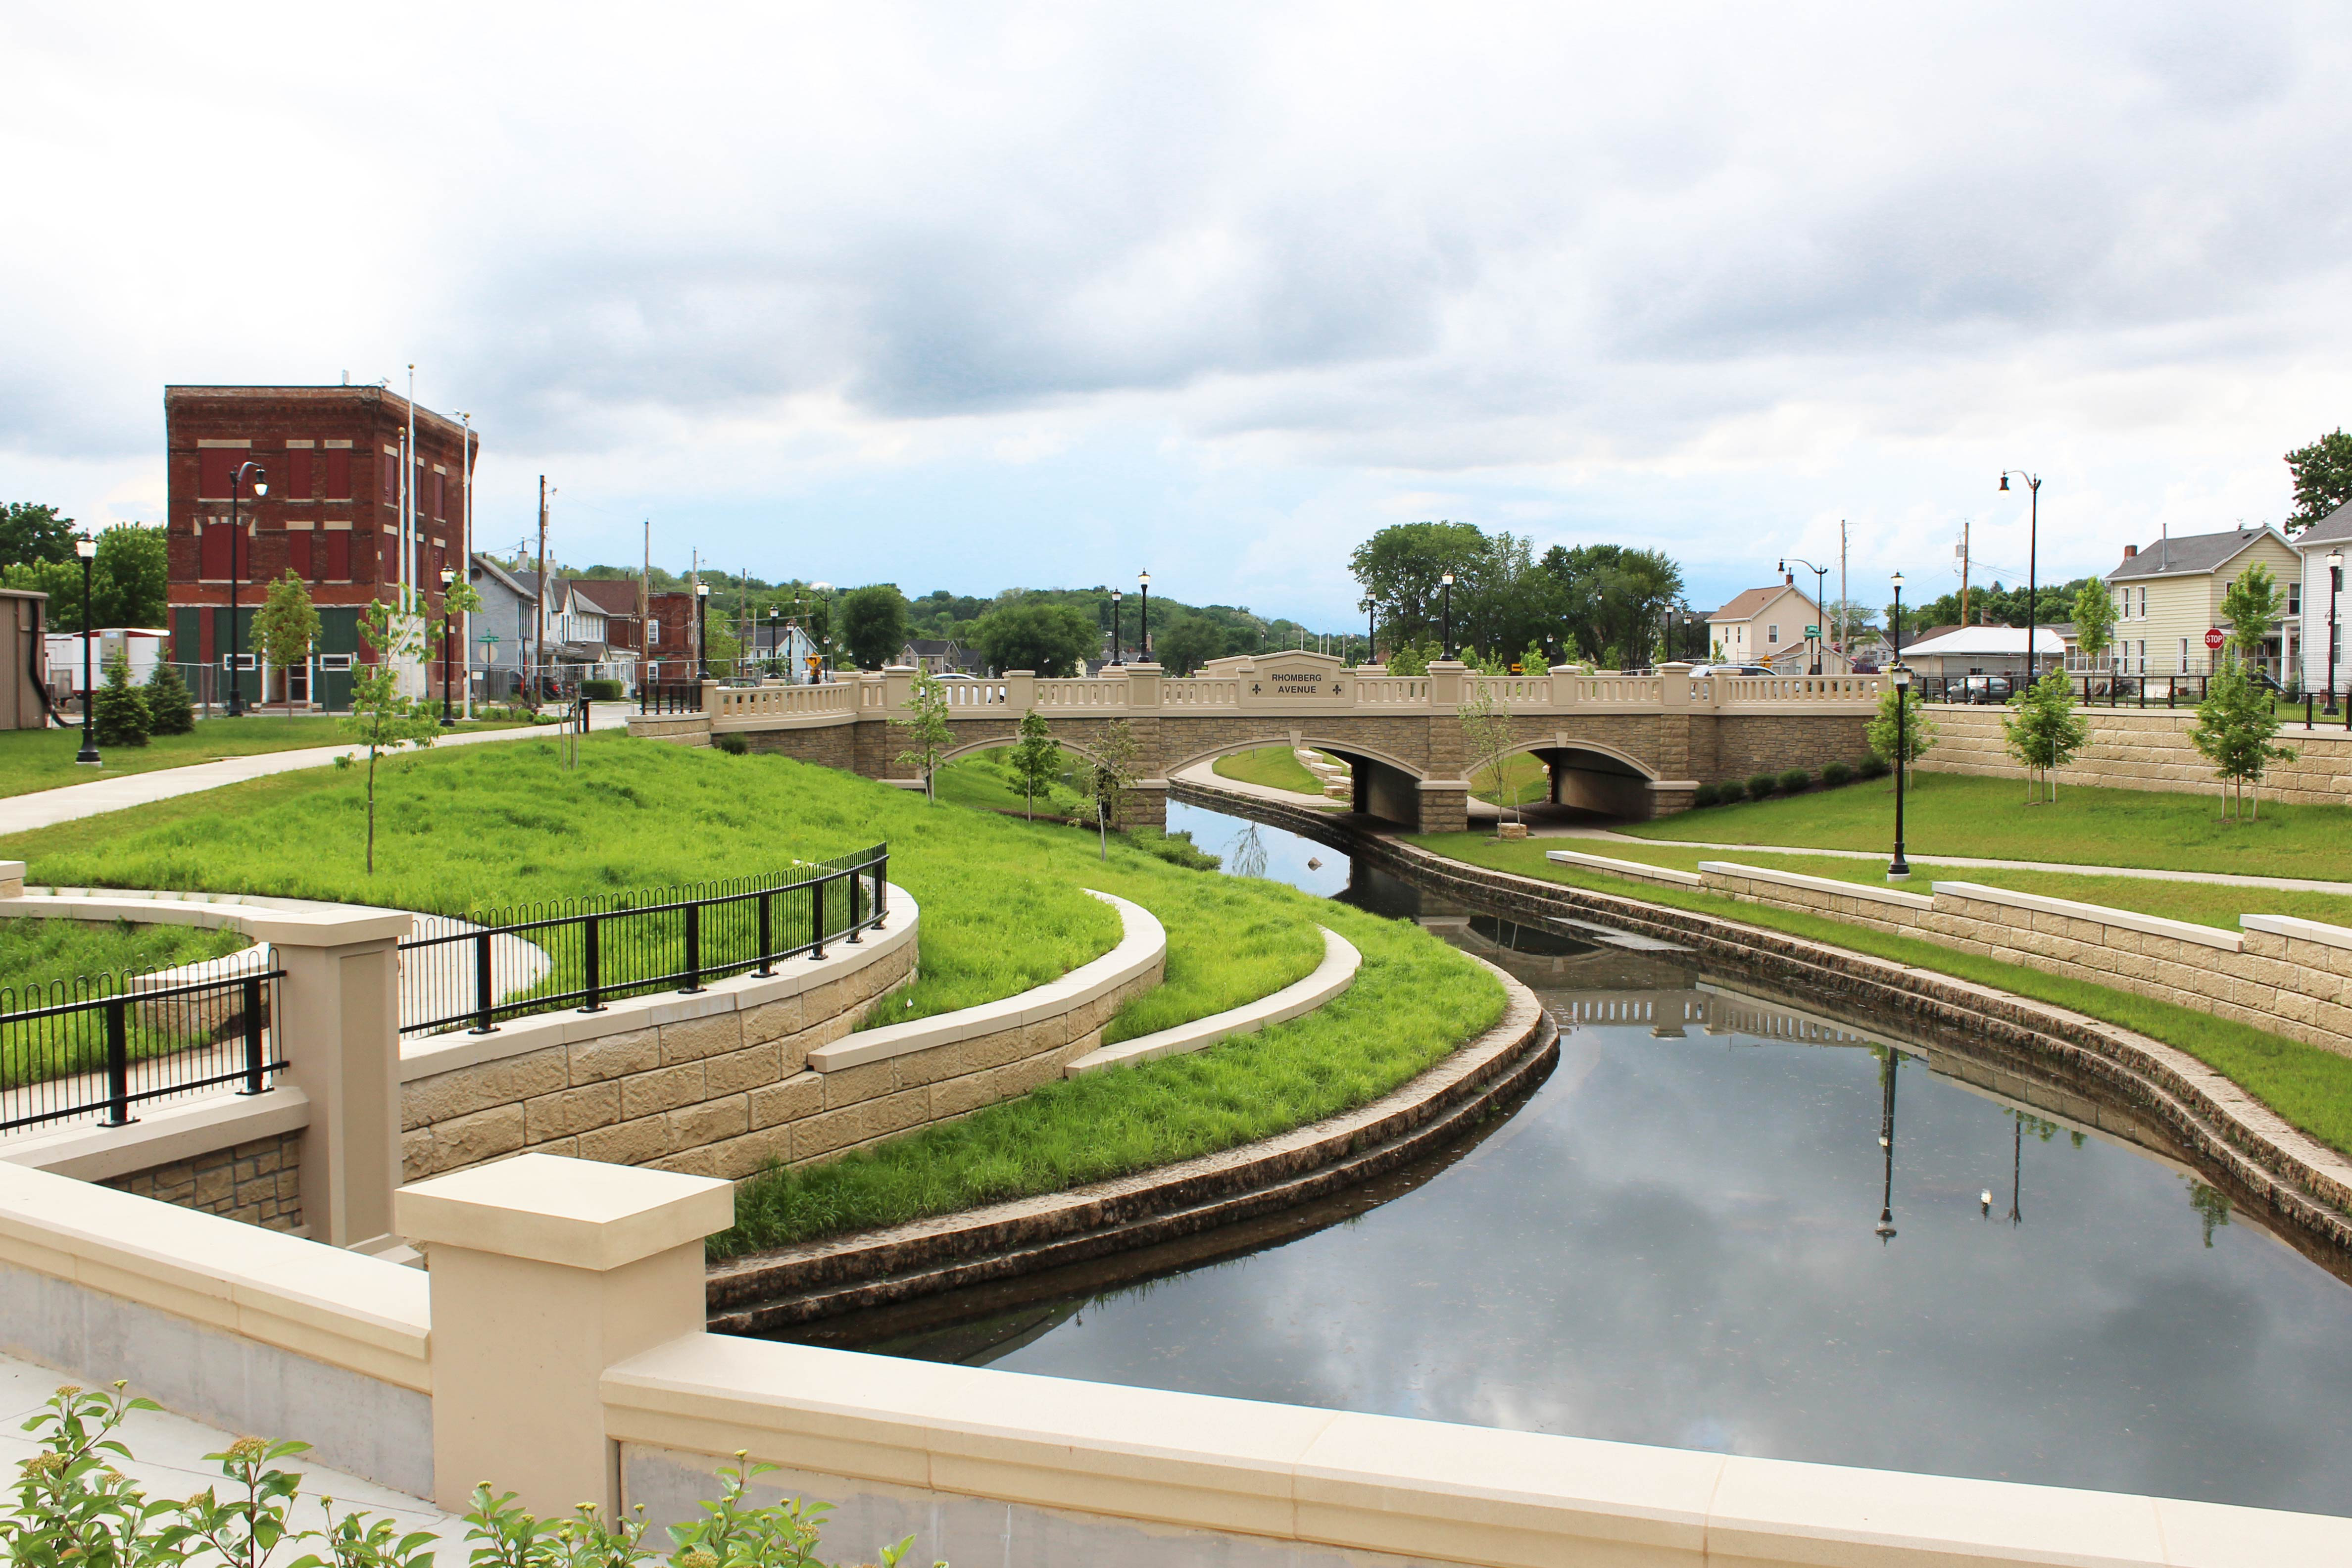
Multiple review studies have documented that cities in all parts of the United States are undertaking adaptation and mitigation actions.45,115,246 Municipal departments, including public works, water systems, and transportation, along with public, private, and civic actors, work to assess vulnerability and reduce risk. Actions include land-use planning, protecting critical infrastructure and ecosystems, installing green infrastructure, and improving emergency preparedness and response.45,114,115,117,247 Many cities are part of multicity networks (for example, the Great Lakes Climate Adaptation Network, ICLEI, and C40 Cities Climate Leadership Group) that provide opportunities for peer-to-peer learning, sharing best practices, and technical assistance.59,114,117,120 Researchers have recognized the benefits of shared motivation and resource pooling across cities59 and of incorporating local knowledge, priorities, and values into adaptation planning.45,248 The private sector, utilities, nongovernmental organizations, libraries, museums, and civic organizations are involved with urban adaptation and mitigation.2,45,59,115,196,249,250 Studies are beginning to analyze the social, economic, and political factors that shape whether and how cities carry out climate change response.114,115,116,131,142

Numerous studies have examined the ways in which adaptation actions reduce the impacts of weather extremes in urban areas. Documented benefits include reductions in urban heat risk48,126,127,128,130,251 and flooding impacts.118,252,253 These actions can provide additional public health and economic benefits.59,254,255,256,257 Studies have also noted that low-regret and incremental urban adaptation are not likely to significantly reduce the impacts of projected climate change.59,131,258 In addition, several studies discuss how urban adaptation can cause adverse consequences related to existing socioeconomic and spatial inequalities and the uneven distribution of urban climate risks.60,123,124,125

Major uncertainties

While urban adaptation actions can reduce the effects of extreme weather, there is uncertainty regarding the effectiveness of these actions against future climate change.115,246 Much of this uncertainty arises from the difficulties inherent in predicting the future impacts of climate change. This uncertainty is compounded by a lack of regional and local data for many cities, by the difficulty of evaluating the effects of climate change on local extremes,150,251 and by the inability of knowing how climate changes intersect with other urban changes.67,185 Moreover, there is a lack of forward-looking models and standardized monitoring strategies to test the costs, co-benefits, and effectiveness of urban response. Adaptation actions that focus solely on physical protection of urban assets are not likely to effectively address social vulnerability.114,123 Urban adaptation effectiveness depends heavily on local characteristics. While cities do learn best practices through multicity networks, one city’s strategy may not be as applicable to other cities.

Research on drivers of and challenges to urban response is in the incipient stage, with divergent results about social and political requirements for effective response.114,116,142 Although cities are leading the way in adaptation and mitigation, many face significant barriers such as resource challenges, which will affect the rate of spread, extent, and duration of urban response.45,145 There is little research on the effectiveness of different incentives for urban response or how to best support action in low-income communities.

Description of confidence and likelihood

There is high confidence that municipal governments and other institutions in many U.S. cities are planning and implementing climate change adaptation and mitigation actions. There is high confidence that urban adaptation and mitigation can provide additional near-term benefits, although the distribution of benefits and harms within cities is uneven. There is medium confidence in the effect these actions have and will have on current and future climate change impacts. If cities take only small actions, they are unlikely to fully protect urban residents from devastating impacts, particularly given projected levels of climate change. There is high confidence that cities face challenges in responding to climate change and that when cities build on local knowledge, use risk management approaches, explicitly address social vulnerability, and participate in multicity networks, their ability to respond to climate change is improved. The degree of improvement depends on other factors that affect urban response outcomes.

REFERENCES

  • Adger, W. N., S. Dessai, M. Goulden, M. Hulme, I. Lorenzoni, D. R. Nelson, L. O. Naess, J. Wolf, and A. Wreford, 2009: Are there social limits to adaptation to climate change? Climatic Change, 93 (3–4), 335–354. doi:10.1007/s10584-008-9520-z. ↩
  • Aerts, J. C. J. H., W. J. W. Botzen, K. Emanuel, N. Lin, H. de Moel, and E. O. Michel-Kerjan, 2014: Evaluating flood resilience strategies for coastal megacities. Science, 344 (6183), 473–475. doi:10.1126/science.1248222. ↩
  • Ahdoot, S., and S. E. Pacheco, 2015: Global climate change and children's health. Pediatrics, 136 (5), e1–e17. doi:10.1542/peds.2015-3233. ↩
  • ALA, 2015: Resolution on the Importance of Sustainable Libraries. American Library Association (ALA), Chicago, IL. URL. ↩
  • Albouy, D., G. Ehrlich, and M. Shin, 2017: Metropolitan land values. The Review of Economics and Statistics, 100 (3), 454–466. doi:10.1162/REST_a_00710. ↩
  • Albouy, D., W. Graf, R. Kellogg, and H. Wolff, 2016: Climate amenities, climate change, and American quality of life. Journal of the Association of Environmental and Resource Economists, 3 (1), 205–246. doi:10.1086/684573. ↩
  • American Institute of Architects, and National Institute of Building Sciences, 2015: Industry Statement on Resilience: Preparing to Thrive: The Building Industry Statement on Resilience. Washington, DC, 24 pp. URL. ↩
  • American Institute of Architects, Where We Stand: Climate Change. ,  accessed June 12. URL. ↩
  • American Society of Civil Engineers (ASCE), 2017: 2017 Infrastructure Report Card:  A Comprehensive Assessment of America's Infrastructure. American Society of Civil Engineers, Washington, DC, 110 pp. URL. ↩
  • Americans for the Arts, 2017: Arts and Economic Prosperity 5: Economic Impact of the Nonprofit Arts & Culture Industry. Americans for the Arts, New York, NY. URL. ↩
  • Anguelovski, I., L. Shi, E. Chu, D. Gallagher, K. Goh, Z. Lamb, K. Reeve, and H. Teicher, 2016: Equity impacts of urban land use planning for climate adaptation: Critical perspectives from the global north and south. Journal of Planning Education and Research, 36 (3), 333–348. doi:10.1177/0739456x16645166. ↩
  • APA Council of Representatives, Resolution on Affirming Psychologists' Role in Addressing Global Climate Change. American Psychological Association (APA), Washington, DC. URL. ↩
  • APEGBC, 2016: Developing Climate Change–Resilient Designs for Highway Infrastructure in British Columbia. APEGBC Professional Practice Guidelines V1.0. Association of Professional Engineers and Geoscientists of British Columbia, Burnaby, BC, 100 pp. URL. ↩
  • Arup, Regional Plan Association, and Siemens, 2013: Toolkit for Resilient Cities: Infrastructure, Technology and Urban Planning. Arup, Regional Plan Association, and Siemens, New York, NY, 65 pp. URL. ↩
  • ASCE, 2016: Failure to Act: Closing the Infrastructure Investment Gap For America's Economic Future. 2017 Infrastructure Report Card. American Society of Civil Engineers, Reston, VA, 29 pp. URL. ↩
  • ASLA, 2008: Statement on Climate Change. American Society of Landscape Architects (ASLA), Washington, DC. URL. ↩
  • Aylett, A., 2015: Institutionalizing the urban governance of climate change adaptation: Results of an international survey. Urban Climate, 14, Part 1, 4–16. doi:10.1016/j.uclim.2015.06.005. ↩
  • Ayyub, B. M., 2014: Risk Analysis in Engineering and Economics. Chapman and Hall/CRC, Boca Raton, FL,. ↩
  • Ayyub, B. M., and G. J. Klir, 2006: Uncertainty Modeling and Analysis in Engineering and the Sciences. Chapman Hall/CRC, Boca Raton, FL,. ↩
  • Ayyub, B. M., and R. N. Wright, 2016: Adaptive climate risk control of sustainability and resilience for infrastructure systems. Journal of Geography & Natural Disasters, 6 (2), e118. doi:10.4172/2167-0587.1000e118. ↩
  • Baldwin, C., and R. King, 2017: What About the People? The Socially Sustainable, Resilient Community and Urban Development. Oxford Brookes University, Oxford, UK, 103 pp. URL. ↩
  • Bartos, M., M. Chester, N. Johnson, B. Gorman, D. Eisenberg, I. Linkov, and M. Bates, 2016: Impacts of rising air temperatures on electric transmission ampacity and peak electricity load in the United States. Environmental Research Letters, 11 (11), 114008. doi:10.1088/1748-9326/11/11/114008. ↩
  • Baumgardner, F. T., J. R. Hinson, and S. D. Panek, 2016: Annual Revision of Gross Domestic Product by Metropolitan Area: Advance Statistics for 2015 and Revised Statistics for 2001–2014 . U.S. Dept. of Commerce, Bureau of Economic Analysis, 37 pp. URL. ↩
  • Beavers, R., A. Babson, and C. Schupp, 2016: Coastal Adaptation Strategies Handbook. NPS 999/134090. U.S. Department of the Interior, National Park Service, Washinton, DC, 140 pp. URL. ↩
  • Bierbaum, R., J. B. Smith, A. Lee, M. Blair, L. Carter, F. S. Chapin, P. Fleming, S. Ruffo, M. Stults, S. McNeeley, E. Wasley, and L. Verduzco, 2013: A comprehensive review of climate adaptation in the United States: More than before, but less than needed. Mitigation and Adaptation Strategies for Global Change, 18 (3), 361–406. doi:10.1007/s11027-012-9423-1. ↩
  • Blue, J., N. Hiremath, C. Gillette, and S. Julius, 2017: Evaluating Urban Resilience to Climate Change: A Multi-Sector Approach. EPA/600/R-16/365F. U.S. EPA, National Center for Environmental Assessment, Washington, DC, 674 pp. URL. ↩
  • Blue, J., R. A. Krop, N. Hiremath, C. Gillette, J. Rooke, C. L. Knutson, and K. Smith, 2015: Drought management in a changing climate: Using cost-benefit analyses to assist drinking water utilities . Web Report #4546. Water Research Foundation, Denver, CO, 167 pp. URL. ↩
  • Brown, M. E., J. M. Antle, P. Backlund, E. R. Carr, W. E. Easterling, M. K. Walsh, C. Ammann, W. Attavanich, C. B. Barrett, M. F. Bellemare, V. Dancheck, C. Funk, K. Grace, J. S. I. Ingram, H. Jiang, H. Maletta, T. Mata, A. Murray, M. Ngugi, D. Ojima, B. O'Neill, and C. Tebaldi, 2015: Climate Change, Global Food Security, and the U.S. Food System. U.S. Global Change Research Program, Washington, DC, 146 pp. doi:10.7930/J0862DC7. ↩
  • Brown, R. D., J. Vanos, N. Kenny, and S. Lenzholzer, 2015: Designing urban parks that ameliorate the effects of climate change. Landscape and Urban Planning, 138, 118–131. doi:10.1016/j.landurbplan.2015.02.006. ↩
  • Bulkeley, H., and R. Tuts, 2013: Understanding urban vulnerability, adaptation and resilience in the context of climate change. Local Environment, 18 (6), 646–662. doi:10.1080/13549839.2013.788479. ↩
  • Bulkeley, H., G. A. S. Edwards, and S. Fuller, 2014: Contesting climate justice in the city: Examining politics and practice in urban climate change experiments. Global Environmental Change-Human and Policy Dimensions, 25, 31–40. doi:10.1016/j.gloenvcha.2014.01.009. ↩
  • Burger, M., and J. Gundlach, 2017: The Status of Climate Change Litigation: A Global Review. U.N. Environment Programme, New York, NY, 40 pp. URL. ↩
  • Business Continuity Institute, 2016: Supply Chain Resilience Report 2016. Business Continuity Institute, Caversham, UK, 39 pp. URL. ↩
  • Butler, W. H., R. E. Deyle, and C. Mutnansky, 2016: Low-regrets incrementalism: Land use planning adaptation to accelerating sea level rise in Florida's coastal communities. Journal of Planning Education and Research, 36 (3), 319–332. doi:10.1177/0739456X16647161. ↩
  • C40 Cities, and Arup, 2015: Climate Action in Megacities 3.0. C40 Cities-Arup Partnership, London, UK, 127 pp. URL. ↩
  • Caldecott, B., and L. Kruitwagen, 2016: Guest Opinion: How Asset Level Data Can Improve the Assessment of Environmental Risk In Credit Analysis. S&P Global Credit Portal. Standard & Poor's. URL. ↩
  • California Assembly, 2016: URL. ↩
  • Canadian Engineering Qualifications Board, 2014: Principles of Climate Change Adaptation for Engineers. Engineers Canada, Ottawa, ON, 37 pp. URL. ↩
  • Carlson, K., and S. McCormick, 2015: American adaptation: Social factors affecting new developments to address climate change. Global Environmental Change, 35, 360–367. doi:10.1016/j.gloenvcha.2015.09.015. ↩
  • Carroll, C. M., J. R. Evans, L. E. Patton, and J. L. Zimolzak, 2012: Climate Change and Insurance. American Bar Association Book Publishing, Chicago, IL,. ↩
  • CBO, 2016: Potential Increases in Hurricane Damage in the United States: Implications for the Federal Budget. Congressional Budget Office (CBO), Washington, DC, 33 pp. URL. ↩
  • Chan, A. Y., and K. G. Hopkins, 2017: Associations between sociodemographics and green infrastructure placement in Portland, Oregon. Journal of Sustainable Water in the Built Environment, 3 (3), 05017002. doi:10.1061/JSWBAY.0000827. ↩
  • Charleston Resilience Network, 2016: Understanding the October 2015 Charleston Floods: A Symposium Report. Charleston Resilience Network, Charleston, SC, 53 pp. URL. ↩
  • Chen, C., M. Doherty, J. Coffee, T. Wong, and J. Hellmann, 2016: Measuring the adaptation gap: A framework for evaluating climate hazards and opportunities in urban areas. Environmental Science & Policy, 66, 403–419. doi:10.1016/j.envsci.2016.05.007. ↩
  • Chui, A. C., A. Gittelson, E. Sebastian, N. Stamler, and S. R. Gaffin, 2018: Urban heat islands and cooler infrastructure - Measuring near-surface temperatures with hand-held infrared cameras. Urban Climate, 24, 51–62. doi:10.1016/j.uclim.2017.12.009. ↩
  • City of Boston, 2017: Climate resiliency guidance and checklist. Boston Planning and Development Agency , Boston, MA, 14 pp. URL. ↩
  • City of Chicago, 2008: City of Chicago Climate Action Plan: Our City. Our Future. 57 pp. URL. ↩
  • City of Dubuque, 2017: Upper Bee Branch Creek Restoration. Dubuque, IA,  accessed August 1. URL. ↩
  • City of Fort Collins, 2015: 2015 Climate Action Plan Framework. Fort Collins, CO, 51 pp. URL. ↩
  • City of New York, 2013: A Stronger, More Resilient New York. New York, NY, 438 pp. URL. ↩
  • City of Pittsburgh, 2016: Resilient Pittsburgh. 100 Resilient Cities and Rockefeller Foundation, Pittsburgh, PA, 59 pp. URL. ↩
  • City of Pittsburgh, 2017: ONE PGH: Pittsburgh's Resilience Strategy. Department of City Planning, Pittsburgh, PA, 117 pp. URL. ↩
  • Clark, G., and G. Clark, 2014: Nations and The Wealth of Cities: A New Phase In Public Policy. Centre for London, London, UK, 66 pp. URL. ↩
  • Clayton, S., C. Manning, K. Krygsman, and M. Speiser, 2017: Mental health and our changing climate: Impacts, implications, and guidance. American Psychological Association and ecoAmerica, Washington, DC, 69 pp. URL. ↩
  • ClimateWise, 2016: Investing for resilience. University of Cambridge Institute for Sustainability Leadership, Cambridge, UK, 37 pp. ↩
  • Conlon, K. C., N. B. Rajkovich, J. L. White-Newsome, L. Larsen, and M. S. O'Neill, 2011: Preventing cold-related morbidity and mortality in a changing climate. Maturitas, 69 (3), 197–202. doi:10.1016/j.maturitas.2011.04.004. ↩
  • Cook, L. M., C. J. Anderson, and C. Samaras, 2017: Framework for incorporating downscaled climate output into existing engineering methods: Application to precipitation frequency curves. Journal of Infrastructure Systems, 23 (4), 04017027. doi:10.1061/(ASCE)IS.1943-555X.0000382. ↩
  • Cortekar, J., S. Bender, M. Brune, and M. Groth, 2016: Why climate change adaptation in cities needs customised and flexible climate services. Climate Services, 4, 42–51. doi:10.1016/j.cliser.2016.11.002. ↩
  • Costa, H., G. Floater, H. Hooyberghs, S. Verbeke, and K. De Ridder, 2016: Climate change, heat stress and labour productivity: A cost methodology for city economies. Centre for Climate Change Economics and Policy Working Paper No. 278 and Grantham Research Institute on Climate Change and the Environment Working Paper No. 248. Centre for Climate Change Economics and Policy and Grantham Research Institute on Climate Change and the Environment, London, UK, 15 pp. URL. ↩
  • Cunningham, J. C., 2015: Measuring wage inequality within and across US metropolitan areas, 2003-2013. Monthly Labor Review., U.S. Bureau of Labor Statistics, p. 15. doi:10.21916/mlr.2015.35. ↩
  • Cutter, S. L., W. Solecki, N. Bragado, J. Carmin, M. Fragkias, M. Ruth, and T. Wilbanks, 2014: Ch. 11: Urban Systems, Infrastructure, and Vulnerability. Climate Change Impacts in the United States: The Third National Climate Assessment. Melillo, J. M., T. (T. C. . Richmond, and G. W. Yohe, Eds., U.S. Global Change Research Program, Washington, DC, 282–296. doi:10.7930/J0F769GR. ↩
  • Dannenberg, A. L., H. Frumkin, and R. J. Jackson, 2011: Making Healthy Places: Designing and Building for Health, Well-Being, and Sustainability. Island Press, Washington, DC,. ↩
  • Dawson, R. J., 2015: Handling interdependencies in climate change risk assessment. Climate, 3 (4), 1079–1096. doi:10.3390/cli3041079. ↩
  • Demuzere, M., K. Orru, O. Heidrich, E. Olazabal, D. Geneletti, H. Orru, A. G. Bhave, N. Mittal, E. Feliu, and M. Faehnle, 2014: Mitigating and adapting to climate change: Multi-functional and multi-scale assessment of green urban infrastructure. Journal of Environmental Management, 146, 107–115. doi:10.1016/j.jenvman.2014.07.025. ↩
  • Department of Defense, 2017: Nonstationary Weather Patterns and Extreme Events: Workshop Report. Strategic Environmental Research and Development Program (SERDP), Environmental Security Technology Certification Program (ESTCP), Alexandria, VA, various pp. URL. ↩
  • Department of the Interior Strategic Sciences Group, 2013: Operational Group Sandy Technical Progress Report. U.S. Department of the Interior, Strategic Sciences Group, RestonVA, 75 pp. URL. ↩
  • Derkzen, M. L., A. J. A. van Teeffelen, and P. H. Verburg, 2017: Green infrastructure for urban climate adaptation: How do residents' views on climate impacts and green infrastructure shape adaptation preferences? Landscape and Urban Planning, 157, 106–130. doi:10.1016/j.landurbplan.2016.05.027. ↩
  • Dinan, T., 2017: Projected increases in hurricane damage in the United States: The role of climate change and coastal development. Ecological Economics, 138, 186–198. doi:10.1016/j.ecolecon.2017.03.034. ↩
  • Dirks, J. A., W. J. Gorrissen, J. H. Hathaway, D. C. Skorski, M. J. Scott, T. C. Pulsipher, M. Huang, Y. Liu, and J. S. Rice, 2015: Impacts of climate change on energy consumption and peak demand in buildings: A detailed regional approach. Energy, 79, 20–32. doi:10.1016/j.energy.2014.08.081. ↩
  • DOE, 2015: An Assessment of Energy Technologies and Research Opportunities: Quadrennial Technology Review. U.S. Department of Energy (DOE), Washington, DC, 489 pp. URL. ↩
  • DOE, 2015: Climate Change and the U.S. Energy Sector: Regional Vulnerabilities and Resilience Solutions . DOE/EPSA-0005. U.S. Department of Energy (DOE), Washington, DC, 189 pp. URL. ↩
  • Doherty, M., K. Klima, and J. J. Hellmann, 2016: Climate change in the urban environment: Advancing, measuring and achieving resiliency. Environmental Science & Policy, 66, 310–313. doi:10.1016/j.envsci.2016.09.001. ↩
  • Donovan, G. H., 2017: Including public-health benefits of trees in urban-forestry decision making. Urban Forestry & Urban Greening, 22, 120–123. doi:10.1016/j.ufug.2017.02.010. ↩
  • Dubowitz, T., S. N. Zenk, B. Ghosh-Dastidar, D. A. Cohen, R. Beckman, G. Hunter, E. D. Steiner, and R. L. Collins, 2015: Healthy food access for urban food desert residents: Examination of the food environment, food purchasing practices, diet and BMI. Public Health Nutrition, 18 (12), 2220–2230. doi:10.1017/S1368980014002742. ↩
  • Easterling, D. R., J. R. Arnold, T. Knutson, K. E. Kunkel, A. N. LeGrande, L. R. Leung, R. S. Vose, D. E. Waliser, and M. F. Wehner, 2017: Precipitation Change in the United States. Climate Science Special Report: Fourth National Climate Assessment, Volume I. Wuebbles, D. J., D. W. Fahey, K. A. Hibbard, D. J. Dokken, B. C. Stewart, and T. K. Maycock, Eds., U.S. Global Change Research Program, Washington, DC, USA, 207–230. doi:10.7930/J0H993CC. ↩
  • Eddins, Q. W., 2015: Also modified title: Rising Vulnerability to Floods Risks Devastating Property Losses in U.S. Cities. CBRE Research, Los Angeles, CA, URL. ↩
  • EIG, 2017: The 2017 Distressed Communities Index: An Analysis of Community Well-Being Across the United States. Economic Innovation Group (EIG), Washington, DC, 50 pp. URL. ↩
  • Ekstrom, J. A., and S. C. Moser, 2014: Identifying and overcoming barriers in urban climate adaptation: Case study findings from the San Francisco Bay Area, California, USA. Urban Climate, 9, 54–74. doi:10.1016/j.uclim.2014.06.002. ↩
  • Elmqvist, T., M. Fragkias, J. Goodness, B. Güneralp, P. J. Marcotullio, R. I. McDonald, S. Parnell, M. Schewenius, M. Sendstad, K. C. Seto, and C. Wilkinson, 2013: Urbanization, Biodiversity and Ecosystem Services: Challenges and Opportunities, A Global Assessment. Springer Netherlands, doi:10.1007/978-94-007-7088-1. ↩
  • EPA, 2017: Multi-model Framework for Quantitative Sectoral Impacts Analysis: A Technical Report for the Fourth National Climate Assessment. EPA 430‐R‐17‐001. U.S. Environmental Protection Agency (EPA), Washington, DC, 271 pp. URL. ↩
  • EPA, 2017: Smart Growth Fixes for Climate Adaptation and Resilience. U.S. Environmental Protection Agency, Washington, DC, 84 pp. URL. ↩
  • EPA, 2017: Updates to the Demographic and Spatial Allocation Models to Produce Integrated Climate and Land Use Scenarios (ICLUS) Version 2. EPA/600/R-16/366F. U.S. Environmental Protection Agency, National Center for Environmental Assessment, Washington, DC, various pp. URL. ↩
  • Ernst, K. M., and B. L. Preston, 2017: Adaptation opportunities and constraints in coupled systems: Evidence from the U.S. energy-water nexus. Environmental Science & Policy, 70, 38–45. doi:10.1016/j.envsci.2017.01.001. ↩
  • Estrada, F., W. J. W. Botzen, and R. S. J. Tol, 2017: A global economic assessment of city policies to reduce climate change impacts. Nature Climate Change, 7 (6), 403–406. doi:10.1038/nclimate3301. ↩
  • Evans, P. C., and P. Fox-Penner, 2014: Resilient and sustainable infrastructure for urban energy systems. Solutions Journal, 5 (5), 48–54. URL. ↩
  • Fankhauser, S., 2017: Adaptation to climate change. Annual Review of Resource Economics, 9 (1), 209–230. doi:10.1146/annurev-resource-100516-033554. ↩
  • Fatorić, S., and E. Seekamp, 2017: Are cultural heritage and resources threatened by climate change? A systematic literature review. Climatic Change, 142 (1), 227–254. doi:10.1007/s10584-017-1929-9. ↩
  • Federal Accounting Standards Advisory Board, 2013: Accounting for Impairment of General Property, Plant, and Equipment Remaining in Use. Federal Financial Accounting Standards 44 . Federal Accounting Standards Advisory Board, Washington, DC, 71 pp. URL. ↩
  • Field, C. B., V. R. Barros, K. J. Mach, M. D. Mastrandrea, M. van Aalst, W. N. Adger, D. J. Arent, J. Barnett, R. Betts, T. E. Bilir, J. Birkmann, J. Carmin, D. D. Chadee, A. J. Challinor, M. Chatterjee, W. Cramer, D. J. Davidson, Y. O. Estrada, J. P. Gattuso, Y. Hijioka, O. Hoegh-Guldberg, H. Q. Huang, G. E. Insarov, R. N. Jones, R. S. Kovats, P. Romero-Lankao, J. N. Larsen, I. J. Losada, J. A. Marengo, R. F. McLean, L. O. Mearns, R. Mechler, J. F. Morton, I. Niang, T. Oki, J. M. Olwoch, M. Opondo, E. S. Poloczanska, H. O. Pörtner, M. H. Redsteer, A. Reisinger, A. Revi, D. N. Schmidt, M. R. Shaw, W. Solecki, D. A. Stone, J. M. R. Stone, K. M. Strzepek, A. G. Suarez, P. Tschakert, R. Valentini, S. Vicuña, A. Villamizar, K. E. Vincent, R. Warren, L. L. White, T. J. Wilbanks, P. P. Wong, and G. W. Yohe, 2014: Technical Summary. Cambridge University Press, Cambridge, United Kingdom and New York, NY, USA, 35-94 pp. ↩
  • Fischbach, J. R., K. Siler-Evans, D. Tierney, M. T. Wilson, L. M. Cook, and L. W. May, 2017: Robust Stormwater Management in the Pittsburgh Region: A Pilot Study. RR0-1673-MCF. RAND Corporation, Santa Monica, CA, 120 pp. URL. ↩
  • Forest Service, 2018: Urban nature for human health and well-being: A research summary for communicating the health benefits of urban trees and green space. FS-1096. U.S. Department of Agriculture, Forest Service, Washington, DC, 24 pp. ↩
  • Freddie Mac, 2016: Freddie Mac April 2016 Insight: Life's a Beach. URL. ↩
  • Gaffin, S. R., C. Rosenzweig, and A. Y. Y. Kong, 2012: Adapting to climate change through urban green infrastructure. Nature Climate Change, 2, 704. doi:10.1038/nclimate1685. ↩
  • Garuma, G. F., J.-P. Blanchet, É. Girard, and M. Leduc, 2018: Urban surface effects on current and future climate. Urban Climate, 24, 121–138. doi:10.1016/j.uclim.2018.02.003. ↩
  • Georgescu, M., P. E. Morefield, B. G. Bierwagen, and C. P. Weaver, 2014: Urban adaptation can roll back warming of emerging megapolitan regions. Proceedings of the National Academy of Sciences of the United States of America, 111 (8), 2909–2914. doi:10.1073/pnas.1322280111. ↩
  • Gerrard, M. B., 2016: Preparing clients for climate change. GP Solo - American Bar Association, 33 (3), 28–31. URL. ↩
  • Gething, B., and K. Puckett, 2010: Design for Climate Change. RIBA Publishing, Newcastle Upon Tyne, UK, URL. ↩
  • Ghosh-Dastidar, B., D. Cohen, G. Hunter, S. N. Zenk, C. Huang, R. Beckman, and T. Dubowitz, 2014: Distance to store, food prices, and obesity in urban food deserts. American Journal of Preventive Medicine, 47 (5), 587–595. doi:10.1016/j.amepre.2014.07.005. ↩
  • Gilchrist, J., T. Haileyesus, M. Murphy, R. D. Comstock, C. Collins, N. McIlvain, and E. Yard, 2010: Heat illness among high school athletes - United States, 2005-2009. Morbidity and Mortality Weekly Report, 59 (32), 1009–1013. URL. ↩
  • Girvetz, E. H., E. P. Maurer, P. B. Duffy, A. Ruesch, B. Thrasher, and C. Zganjar, 2013: Making Climate Data Relevant to Decision Making: The Important Details of Spatial and Temporal Downscaling. World Bank, Washington, DC, 43 pp. URL. ↩
  • Gleick, P. H., 2016: Impacts of California's Ongoing Drought: Hydroelectricity Generation 2015 Update. Pacific Institute, Oakland, CA, 9 pp. URL. ↩
  • Gober, P., R. Quay, and K. L. Larson, 2016: Outdoor water use as an adaptation problem: Insights from North American cities. Water Resources Management, 30 (3), 899–912. doi:10.1007/s11269-015-1205-6. ↩
  • Gomez, J. A., 2016: Climate Change: Improved Federal Coordination Could Facilitate Use of Forward-Looking Climate Information in Design Standards, Building Codes, and Certifications. GAO-17-3. Government Accountability Office, Washington, DC, 40 pp. URL. ↩
  • Grannis, J., V. Arroyo, S. Hoverter, and R. Stumberg, 2014: Preparing for Climate Impacts: Lessons from the Front Lines. Georgetown Climate Center, Washington, DC, 16 pp. URL. ↩
  • Grimm, N. B., S. H. Faeth, N. E. Golubiewski, C. L. Redman, J. Wu, X. Bai, and J. M. Briggs, 2008: Global change and the ecology of cities. Science, 319 (5864), 756–760. doi:10.1126/science.1150195. ↩
  • Groffman, P. M., J. Cavender-Bares, N. D. Bettez, J. M. Grove, S. J. Hall, J. B. Heffernan, S. E. Hobbie, K. L. Larson, J. L. Morse, C. Neill, K. Nelson, J. O'Neil-Dunne, L. Ogden, D. E. Pataki, C. Polsky, R. R. Chowdhury, and M. K. Steele, 2014: Ecological homogenization of urban USA. Frontiers in Ecology and the Environment, 12 (1), 74–81. doi:10.1890/120374. ↩
  • Habeeb, D., J. Vargo, and B. Stone, 2015: Rising heat wave trends in large US cities. Natural Hazards, 76 (3), 1651–1665. doi:10.1007/s11069-014-1563-z. ↩
  • Hanak, E., J. Mount, C. Chappelle, J. Lund, J. Medellín-Azuara, P. Myoyle, and N. E. Seavy, 2015: What If California's Drought Continues? Public Policy Institute of California, San Francisco, CA, 20 pp. URL. ↩
  • Hartley, D., 2013: Urban Decline in Rust-Belt Cities. Economic Commentary 2013-06. Federal Reserve Bank of Cleveland, Cleveland, OH, 6 pp. URL. ↩
  • Hauer, M. E., 2017: Migration induced by sea-level rise could reshape the US population landscape. Nature Climate Change, 7 (5), 321–325. doi:10.1038/nclimate3271. ↩
  • Hayhoe, K., J. Edmonds, R. E. Kopp, A. N. LeGrande, B. M. Sanderson, M. F. Wehner, and D. J. Wuebbles, 2017: Climate Models, Scenarios, and Projections. Climate Science Special Report: Fourth National Climate Assessment, Volume I. Wuebbles, D. J., D. W. Fahey, K. A. Hibbard, D. J. Dokken, B. C. Stewart, and T. K. Maycock, Eds., U.S. Global Change Research Program, Washington, DC, USA, 133–160. doi:10.7930/J0WH2N54. ↩
  • Herring, S. C., N. Christidis, A. Hoell, J. P. Kossin, C. J. Schreck III, and P. A. Stott, 2018: Explaining extreme events of 2016 from a climate perspective. Bulletin of the American Meteorological Society, 99 (1), S1–S157. doi:10.1175/BAMS-ExplainingExtremeEvents2016.1. ↩
  • Hibbard, K. A., F. M. Hoffman, D. Huntzinger, and T. O. West, 2017: Changes in Land Cover and Terrestrial Biogeochemistry. Climate Science Special Report: Fourth National Climate Assessment, Volume I. Wuebbles, D. J., D. W. Fahey, K. A. Hibbard, D. J. Dokken, B. C. Stewart, and T. K. Maycock, Eds., U.S. Global Change Research Program, Washington, DC, USA, 277–302. doi:10.7930/J0416V6X. ↩
  • Holmes, S. H., and C. F. Reinhart, 2011: Climate change risks from a building owner's perspective: Assessing future climate and energy price scenarios. In Building Simulation 2011: 12th Conference of IBPSA, 14-16 November, Sydney, Australia., 2522–2529. URL. ↩
  • Holstege, S., C. McGlade, and E. Gately, 2014: “Pumping stations failed at some freeway stations.” AZ Central URL. ↩
  • Holtz, D., A. Markham, K. Cell, and B. Ekwurzel, 2014: National Landmarks at Risk: How Rising Seas, Floods, and Wildfires Are Threatening the United States' Most Cherished Historic Sites. Union of Concerned Scientists, Cambridge, MA, 72 pp. URL. ↩
  • Houser, T., S. Hsiang, R. Kopp, K. Larsen, M. Delgado, A. Jina, M. Mastrandrea, S. Mohan, R. Muir-Wood, D. J. Rasmussen, J. Rising, and Paul Wilson, 2015: Economic Risks of Climate Change: An American Prospectus. Columbia University Press, New York,. ↩
  • Hsiang, S., R. Kopp, A. Jina, J. Rising, M. Delgado, S. Mohan, D. J. Rasmussen, R. Muir-Wood, P. Wilson, M. Oppenheimer, K. Larsen, and T. Houser, 2017: Estimating economic damage from climate change in the United States. Science, 356 (6345), 1362–1369. doi:10.1126/science.aal4369. ↩
  • HUD, 2014: Climate Change Adaptation Plan. U.S. Department of Housing and Urban Development (HUD), Washington, DC, 70 pp. URL. ↩
  • Hughes, S., 2015: A meta-analysis of urban climate change adaptation planning in the U.S. Urban Climate, 14, Part 1, 17–29. doi:10.1016/j.uclim.2015.06.003. ↩
  • Hunt, A., and P. Watkiss, 2011: Climate change impacts and adaptation in cities: A review of the literature. Climatic Change, 104 (1), 13–49. . ↩
  • Hutley, N., and S. Hartford-Davis, 2016: Climate Change and Director's Duties. The Centre for Policy Development and the Future Business Council, Syndey, Australia, 22 pp. URL. ↩
  • Iacob, O., J. S. Rowan, I. Brown, and C. Ellis, 2014: Evaluating wider benefits of natural flood management strategies: An ecosystem-based adaptation perspective. Hydrology Research, 45 (6), 774–787. doi:10.2166/nh.2014.184. ↩
  • IBM, 2017: Smarter Cities Challenge: The Challenge. IBM, . URL. ↩
  • Investor Group on Climate Change, 2017: Transparency in Transition: A Guide to Investor Disclosure on Climate Change. Investor Group on Climate Change, New South Wales, Australia, 40 pp. URL. ↩
  • Jabareen, Y., 2013: Planning the resilient city: Concepts and strategies for coping with climate change and environmental risk. Cities, 31, 220–229. doi:10.1016/j.cities.2012.05.004. ↩
  • Jennings, V., and C. Johnson Gaither, 2015: Approaching environmental health disparities and green spaces: An ecosystem services perspective. International Journal of Environmental Research and Public Health, 91 (04), 376–383. doi:10.5558/tfc2015-067. ↩
  • Jentsch, M. F., P. A. B. James, L. Bourikas, and A. S. Bahaj, 2013: Transforming existing weather data for worldwide locations to enable energy and building performance simulation under future climates. Renewable Energy, 55, 514–524. doi:10.1016/j.renene.2012.12.049. ↩
  • Johnston, M., 2004: Impacts and adaptation for climate change in urban forests. In Fires, Storms and Pests--Crises in Our Urban Forests (6th Canadian Urban Forest Conference), Oct 20-21, Kelowna, B.C., 14. URL. ↩
  • Kabisch, N., H. Korn, J. Stadler, and A. Bonn, 2017: Nature-based solutions to climate change adaptation in urban areas--Linkages between science, policy and practice. Nature-based solutions to climate change adaptation in urban areas: Linkages between science, policy and practice. Kabisch, N., H. Korn, J. Stadler, and A. Bonn, Eds., Springer International Publishing, Cham, 1–11. doi:10.1007/978-3-319-56091-5_1. ↩
  • Kashem, S. B., B. Wilson, and S. Van Zandt, 2016: Planning for climate adaptation: Evaluating the changing patterns of social vulnerability and adaptation challenges in three coastal cities. Journal of Planning Education and Research, 36 (3), 304–318. doi:10.1177/0739456x16645167. ↩
  • Keenan, J. M., T. Hill, and A. Gumber, 2018: Climate gentrification: From theory to empiricism in Miami-Dade County, Florida. Environmental Research Letters, 13 (5), 054001. doi:10.1088/1748-9326/aabb32. ↩
  • Kenney, W. L., D. H. Craighead, and L. M. Alexander, 2014: Heat waves, aging, and human cardiovascular health. Medicine & Science in Sports & Exercise, 46 (10), 1891–1899. doi:10.1249/mss.0000000000000325. ↩
  • Kenward, A., D. Adams-Smith, and U. Raja, 2013: Wildfires and Air Pollution: The Hidden Health Hazards of Climate Change. Climate Central, Princeton, NJ, 37 pp. URL. ↩
  • Kerns, B. K., J. B. Kim, J. D. Kline, and M. A. Day, 2016: US exposure to multiple landscape stressors and climate change. Regional Environmental Change, 16 (7), 2129–2140. doi:10.1007/s10113-016-0934-2. ↩
  • Kettle, N. P., K. Dow, S. Tuler, T. Webler, J. Whitehead, and K. M. Miller, 2014: Integrating scientific and local knowledge to inform risk-based management approaches for climate adaptation. Climate Risk Management, 4–5, 17–31. doi:10.1016/j.crm.2014.07.001. ↩
  • Kirshen, P., M. Ruth, and W. Anderson, 2008: Interdependencies of urban climate change impacts and adaptation strategies: A case study of Metropolitan Boston USA. Climatic Change, 86 (1), 105–122. doi:10.1007/s10584-007-9252-5. ↩
  • Knopman, D., and R. J. Lempert, 2016: Risk governance framework for decisionmaking. Urban Responses to Climate Change: Framework for Decisionmaking and Supporting Indicators., RAND Corporation, Santa Monica, CA, 11–26. doi:10.7249/RR1144. ↩
  • Koh, J., E. Mazzacurati, and C. Trabacchi, 2017: An Investor Guide to Physical Climate Risk & Resilience: An Introduction. Global Adaptation & Resilience Investment Working Group, 13 pp. URL. ↩
  • Koh, J., E. Mazzacurati, and S. Swann, 2016: Bridging the Adaptation Gap: Approaches to Measurement of Physical Climate Risk and Examples of Investment in Climate Adaptation and Resilience. Global Adaptation & Resilience Investment Working Group, 65 pp. URL. ↩
  • Koski, C., and A. Siulagi, 2016: Environmental harm or natural hazard? Problem identification and adaptation in U.S. municipal climate action plans. Review of Policy Research, 33 (3), 270–290. doi:10.1111/ropr.12173. ↩
  • Kossin, J. P., T. Hall, T. Knutson, K. E. Kunkel, R. J. Trapp, D. E. Waliser, and M. F. Wehner, 2017: Extreme Storms. Climate Science Special Report: Fourth National Climate Assessment, Volume I. Wuebbles, D. J., D. W. Fahey, K. A. Hibbard, D. J. Dokken, B. C. Stewart, and T. K. Maycock, Eds., U.S. Global Change Research Program, Washington, DC, USA, 257–276. doi:10.7930/J07S7KXX. ↩
  • Kotamarthi, R., L. Mearns, K. Hayhoe, C. Castro, and D. Wuebbles, 2016: Use of Climate Information for Decision-Making and Impact Research. U.S. Department of Defense, Strategic Environment Research and Development Program Report, 55 pp. URL. ↩
  • Kwok, A. G., and N. B. Rajkovich, 2010: Addressing climate change in comfort standards. Building and Environment, 45 (1), 18–22. doi:10.1016/j.buildenv.2009.02.005. ↩
  • LaDeau, S. L., P. T. Leisnham, D. Biehler, and D. Bodner, 2013: Higher mosquito production in low-income neighborhoods of Baltimore and Washington, DC: Understanding ecological drivers and mosquito-borne disease risk in temperate cities. International Journal of Environmental Research and Public Health, 10 (4), 1505–1526. doi:10.3390/ijerph10041505. ↩
  • Lane, K., K. Charles-Guzman, K. Wheeler, Z. Abid, N. Graber, and T. Matte, 2013: Health effects of coastal storms and flooding in urban areas: A review and vulnerability assessment. Journal of Environmental and Public Health, 2013, 913064. doi:10.1155/2013/913064. ↩
  • Larson, K., D. White, P. Gober, and A. Wutich, 2015: Decision-making under uncertainty for water sustainability and urban climate change adaptation. Sustainability, 7 (11), 14761–14784. URL. ↩
  • Leisnham, P. T., and S. A. Juliano, 2012: Impacts of climate, land use, and biological invasion on the ecology of immature Aedes mosquitoes: Implications for La Crosse emergence. EcoHealth, 9 (2), 217–228. doi:10.1007/s10393-012-0773-7. ↩
  • Little, R. G., 2002: Controlling cascading failure: Understanding the vulnerabilities of interconnected infrastructures. Journal of Urban Technology, 9 (1), 109–123. doi:10.1080/106307302317379855. ↩
  • Liu, Z., M. C. Wimberly, A. Lamsal, T. L. Sohl, and T. J. Hawbaker, 2015: Climate change and wildfire risk in an expanding wildland–urban interface: A case study from the Colorado Front Range Corridor. Landscape Ecology, 30 (10), 1943–1957. doi:10.1007/s10980-015-0222-4. ↩
  • Lloyd's of London, 2017: Stranded Assets: The transition to a low carbon economy. Overview for the insurance industry. Lloyd's, London, UK, 33 pp. URL. ↩
  • Lombardo, F. T., and B. M. Ayyub, 2015: Analysis of Washington, DC, wind and temperature extremes with examination of climate change for engineering applications. ASCE-ASME Journal of Risk and Uncertainty in Engineering Systems, Part A: Civil Engineering, 1 (1), 04014005. doi:10.1061/AJRUA6.0000812. ↩
  • Lovell, S. T., and J. R. Taylor, 2013: Supplying urban ecosystem services through multifunctional green infrastructure in the United States. Landscape Ecology, 28 (8), 1447–1463. doi:10.1007/s10980-013-9912-y. ↩
  • Mann, B., U. Passe, S. Rabideau, and E. S. Takle, 2012: Future context for thermal comfort: Impact of a changing climate on energy demand and human thermal comfort. In 7th Windsor Conference: The changing context of comfort in an unpredictable world, 12-15 April 2012, Windsor, UK. URL. ↩
  • Manore, C. A., R. S. Ostfeld, F. B. Agusto, H. Gaff, and S. L. LaDeau, 2017: Defining the risk of zika and chikungunya virus transmission in human population centers of the eastern United States. PLOS Neglected Tropical Diseases, 11 (1), e0005255. doi:10.1371/journal.pntd.0005255. ↩
  • Marjanac, S., L. Patton, and J. Thornton, 2017: Acts of God, human influence and litigation. Nature Geoscience, 10, 616–619. doi:10.1038/ngeo3019. ↩
  • Markham, A., E. Osipova, K. Lafrenz Samuels, and A. Caldas, 2016: World Heritage and Tourism in a Changing Climate. UNESCO and UNEP, Nairobi, Kenya; Paris, France, 104 pp. URL. ↩
  • Mayors' Climate Protection Center, 2015: U.S. Mayors' Report on a Decade of Global Climate Leadership: Selected Mayor Profiles. The United States Conference of Mayors, Washington, DC, 42 pp. URL. ↩
  • Mazzacurati, E., D. V. Mallard, Joshua Turner, N. Steinberg, and C. Shaw, 2017: Physical Climate Risk in Equity Portfolios . Four Twenty Seven for Deutsche Asset Management, Berkeley, CA, 28 pp. URL. ↩
  • McCarty, J., and N. Kaza, 2015: Urban form and air quality in the United States. Landscape and Urban Planning, 139, 168–179. doi:10.1016/j.landurbplan.2015.03.008. ↩
  • McCormick, K., S. Anderberg, L. Coenen, and L. Neij, 2013: Advancing sustainable urban transformation. Journal of Cleaner Production, 50, 1–11. doi:10.1016/j.jclepro.2013.01.003. ↩
  • McGrane, S. J., 2016: Impacts of urbanisation on hydrological and water quality dynamics, and urban water management: A review. Hydrological Sciences Journal, 61 (13), 2295–2311. doi:10.1080/02626667.2015.1128084. ↩
  • McLeod, R. S., C. J. Hopfe, and Y. Rezgui, 2012: A proposed method for generating high resolution current and future climate data for Passivhaus design. Energy and Buildings, 55, 481–493. doi:10.1016/j.enbuild.2012.08.045. ↩
  • Melton, P., 2013: Designing for the next century's weather. Environmental Building News, 22 (10), 1–10. . ↩
  • Merritt, E., 2012: A Rising Tide: The Changing Landscape of Risk. Center for the Future of Museums, Arlington, VA. URL. ↩
  • Meyer, M., M. Flood, J. Keller, J. Lennon, G. McVoy, C. Dorney, K. Leonard, R. Hyman, and J. Smith, 2014: Strategic Issues Facing Transportation, Volume 2: Climate Change, Extreme Weather Events, and the Highway System: Practitioner's Guide and Research Report. National Academies Press, Washington, DC, doi:10.17226/22473. ↩
  • Milan, B. F., and F. Creutzig, 2015: Reducing urban heat wave risk in the 21st century. Current Opinion in Environmental Sustainability, 14, 221–231. doi:10.1016/j.cosust.2015.08.002. ↩
  • Miller, K. A., A. F. Hamlet, D. S. Kenney, and K. T. Redmond, Eds., 2016: Water Policy and Planning in a Variable and Changing Climate: Insights from the Western United States. CRC Press, Boca Raton, FL, 434 pp. ↩
  • Mills, E., and R. B. Jones, 2016: An insurance perspective on U.S. electric grid disruption costs. The Geneva Papers on Risk and Insurance - Issues and Practice, 41 (4), 555–586. doi:10.1057/gpp.2016.9. ↩
  • Mishra, V., A. R. Ganguly, B. Nijssen, and D. P. Lettenmaier, 2015: Changes in observed climate extremes in global urban areas. Environmental Research Letters, 10 (2), 024005. doi:10.1088/1748-9326/10/2/024005. ↩
  • Moore, T. L., J. S. Gulliver, L. Stack, and M. H. Simpson, 2016: Stormwater management and climate change: Vulnerability and capacity for adaptation in urban and suburban contexts. Climatic Change, 138 (3–4), 491–504. doi:10.1007/s10584-016-1766-2. ↩
  • Moser, S. C., J. Coffee, and A. Seville, 2017: Rising to the Challenge, together: A Review and Critical Assessment of the State of the US Climate Adaptation Field. Kresge Foundation, Troy, MI, 105 pp. URL. ↩
  • MTA, 2017: MTA Climate Adaptation Task Force Resiliency Report. Metropolitan Transit Authority (MTA), New York, NY, 33 pp. URL. ↩
  • Multihazard Mitigation Council, 2017: Natural Hazard Mitigation Saves: 2017 Interim Report - An Independent Study. National Institute of Building Sciences, Washington, DC, 340 pp. URL. ↩
  • National Academies of Sciences, E., and Medicine, 2012: Airport Climate Adaptation and Resilience. National Academies Press, Washington, DC, doi:10.17226/22773. ↩
  • National Academies of Sciences, E., and Medicine, 2016: Attribution of Extreme Weather Events in the Context of Climate Change. National Academies Press, Washington, DC, doi:10.17226/21852. ↩
  • National Academies of Sciences, E., and Medicine, 2016: Transportation Resilience: Adaptation to Climate Change. National Academies Press, Washington, DC, 100 pp. doi:10.17226/24648 . ↩
  • Neumann, J. E., J. Price, P. Chinowsky, L. Wright, L. Ludwig, R. Streeter, R. Jones, J. B. Smith, W. Perkins, L. Jantarasami, and J. Martinich, 2015: Climate change risks to US infrastructure: Impacts on roads, bridges, coastal development, and urban drainage. Climatic Change, 131 (1), 97–109. doi:10.1007/s10584-013-1037-4. ↩
  • Newport Restoration Foundation, 2016: Keeping 74 Bridge Street Above Water: Lessons from the City of Newport and the Point Neighborhood on Protecting Historic Structures and Neighborhoods from the Impacts of Climate Change [exhibition booklet]. Newport, RI, 39 pp. URL. ↩
  • NOAA NWS, 2015: Historic Flooding - October 1-5, 2015 [story map]. NOAA National Weather Service, North Charleston, SC,  accessed 17 April. URL. ↩
  • NOAA, 2015: Storm Events Database: Drought in San Joaquin Valley, California. National Oceanic and Atmospheric Administration (NOAA), National Centers for Environmental Information, Asheville, NC,  accessed April 17. URL. ↩
  • Nowak, D. J., and E. J. Greenfield, 2012: Tree and impervious cover change in US cities. Urban Forestry & Urban Greening, 11 (1), 21–30. doi:10.1016/j.ufug.2011.11.005. ↩
  • Nowak, D. J., N. Appleton, A. Ellis, and E. Greenfield, 2017: Residential building energy conservation and avoided power plant emissions by urban and community trees in the United States. Urban Forestry & Urban Greening, 21, 158–165. doi:10.1016/j.ufug.2016.12.004. ↩
  • Nowak, D. J., S. Hirabayashi, A. Bodine, and E. Greenfield, 2014: Tree and forest effects on air quality and human health in the United States. Environmental Pollution, 193, 119–129. doi:10.1016/j.envpol.2014.05.028. ↩
  • NWS, 2016: The Historic South Carolina Floods of October 1–5, 2015. Service Assessment. NOAA National Weather Service (NWS), Silver Spring, MD, various pp. URL. ↩
  • NYC Parks, 2017: Why Plant Trees? New York City Parks, New York,  accessed 15 September. URL. ↩
  • Okuji, K., M. Wertz, K. Kurtz, and L. Jones, 2017: Environmental Risks: Evaluating the impact of climate change on US state and local issuers. Technical Report No. 1071949. Moody's Investor Service, New York, NY, 21 pp. URL. ↩
  • Olsen, J. R., Ed., 2015: Adapting Infrastructure and Civil Engineering Practice to a Changing Climate. Reston, VA, 93 pp. doi:10.1061/9780784479193. ↩
  • Pavao-Zuckerman, M. A., 2008: The nature of urban soils and their role in ecological restoration in cities. Restoration Ecology, 16, 642–649. doi:10.1111/j.1526-100X.2008.00486.x. ↩
  • Peng, L., M. G. Stewart, and R. E. Melchers, 2017: Corrosion and capacity prediction of marine steel infrastructure under a changing environment. Structure and Infrastructure Engineering, 13 (8), 988–1001. doi:10.1080/15732479.2016.1229798. ↩
  • Piacentini, R., 2017: When Leaders Won't Lead: Taking Action on Climate Change. ,  accessed June 16, 2017. URL. ↩
  • Pincetl, S., M. Chester, and D. Eisenman, 2016: Urban heat stress vulnerability in the US Southwest: The role of sociotechnical systems. Sustainability, 8 (9) doi:10.3390/su8090842. ↩
  • Pregnolato, M., A. Ford, C. Robson, V. Glenis, S. Barr, and R. Dawson, 2016: Assessing urban strategies for reducing the impacts of extreme weather on infrastructure networks. Royal Society Open Science, 3 (5) doi:10.1098/rsos.160023. ↩
  • Pretzsch, H., P. Biber, E. Uhl, J. Dahlhausen, G. Schütze, D. Perkins, T. Rötzer, J. Caldentey, T. Koike, T. van Con, A. Chavanne, B. du Toit, K. Foster, and B. Lefer, 2017: Climate change accelerates growth of urban trees in metropolises worldwide. Scientific Reports, 7 (1), 15403. doi:10.1038/s41598-017-14831-w. ↩
  • Radbideau, S. L., U. Passe, and E. S. Takle, 2012: Exploring alternatives to the “typical meteorological year” for incorporating climate change into building design. ASHRAE Transactions, 118, 384–391. URL. ↩
  • Ranson, M., T. Tarquinio, and A. Lew, 2016: Modeling the Impact of Climate Change on Extreme Weather Losses. National Center for Environmental Economics (NCEE), U.S. Environmental Protection Agency, Washington, DC,. ↩
  • Rashidi, K., and A. Patt, 2018: Subsistence over symbolism: The role of transnational municipal networks on cities' climate policy innovation and adoption. Mitigation and Adaptation Strategies for Global Change, 23 (4), 507–523. doi:10.1007/s11027-017-9747-y. ↩
  • Ray, P. A., and C. M. Brown, 2015: Confronting Climate Uncertainty in Water Resources Planning and Project Design: The Decision Tree Framework. World Bank Group, Washington, DC, 125 pp. doi:10.1596/978-1-4648-0477-9. ↩
  • Revi, A., D. E. Satterthwaite, F. Aragón-Durand, J. Corfee-Morlot, R. B. R. Kiunsi, M. Pelling, D. C. Roberts, and W. Solecki, 2014: Urban areas. Climate Change 2014: Impacts, Adaptation, and Vulnerability. Part A: Global and Sectoral Aspects. Contribution of Working Group II to the Fifth Assessment Report of the Intergovernmental Panel of Climate Change. Field, C. B., V. R. Barros, D. J. Dokken, K. J. Mach, M. D. Mastrandrea, T. E. Bilir, M. Chatterjee, K. L. Ebi, Y. O. Estrada, R. C. Genova, B. Girma, E. S. Kissel, A. N. Levy, S. MacCracken, P. R. Mastrandrea, and L. L. White, Eds., Cambridge University Press, Cambridge, United Kingdom and New York, NY, USA, 535–612. ↩
  • Reyna, J. L., and M. V. Chester, 2017: Energy efficiency to reduce residential electricity and natural gas use under climate change. Nature Communications, 8, 14916. doi:10.1038/ncomms14916. ↩
  • Robert, A., and M. Kummert, 2012: Designing net-zero energy buildings for the future climate, not for the past. Building and Environment, 55, 150–158. doi:10.1016/j.buildenv.2011.12.014. ↩
  • Rockman, M., M. Morgan, S. Ziaja, G. Hambrecht, and A. Meadow, 2016: Cultural Resources Climate Change Strategy. Cultural Resources, Partnerships, and Science and Climate Change Response Program, National Park Service, Washington, DC, URL. ↩
  • Romero-Lankao, P., K. R. Gurney, K. C. Seto, M. Chester, R. M. Duren, S. Hughes, L. R. Hutyra, P. Marcotullio, L. Baker, N. B. Grimm, C. Kennedy, E. Larson, S. Pincetl, D. Runfola, L. Sanchez, G. Shrestha, J. Feddema, A. Sarzynski, J. Sperling, and E. Stokes, 2014: A critical knowledge pathway to low-carbon, sustainable futures: Integrated understanding of urbanization, urban areas, and carbon. Earth's Future, 2 (10), 515–532. doi:10.1002/2014ef000258. ↩
  • Romero-Lankao, P., T. McPhearson, and D. J. Davidson, 2017: The food-energy-water nexus and urban complexity. Nature Climate Change, 7, 233–235. doi:10.1038/nclimate3260. ↩
  • Rosenzweig, C., N. W. Arnell, K. L. Ebi, H. Lotze-Campen, F. Raes, C. Rapley, M. S. Smith, W. Cramer, K. Frieler, C. P. O. Reyer, J. Schewe, D. van Vuuren, and L. Warszawski, 2017: Assessing inter-sectoral climate change risks: The role of ISIMIP. Environmental Research Letters, 12 (1), 010301. doi:10.1088/1748-9326/12/1/010301. ↩
  • Rosenzweig, C., W. Solecki, P. Romero-Lankao, S. Mehrotra, S. Dhakal, T. Bowman, and S. Ali Ibrahim, 2015: ARC3.2 Summary for City Leaders. Urban Climate Change Research Network, Columbia University, New York, URL. ↩
  • Sampson, R. J., 2017: Urban sustainability in an age of enduring inequalities: Advancing theory and ecometrics for the 21st-century city. Proceedings of the National Academy of Sciences of the United States of America, 114 (34), 8957–8962. doi:10.1073/pnas.1614433114. ↩
  • Serna, J., 2017: “La Tuna Fire, city's biggest by acreage, now 80% contained, officials say.” Los Angeles Times URL. ↩
  • Seto, K. C., W. D. Solecki, and C. A. Griffith, Eds., 2016: Routledge Handbook on Urbanization and Global Environmental Change. Routledge, London, 582 pp. ↩
  • Sheehan, W. J. . R., Pitud A. ;. Wood, Robert A. .. Rivard, Don; Chinratanapisit, Sasawan, and M. S. ; C. Perzanowski Ginger L. .. Seltzer, James M. .. Matsui, Elizbeth C. .. Phipatanakul, Wanda, 2010: Pest and allergen exposure and abatement in inner-city asthma: A Work Group Report of the American Academy of Allergy, Asthma & Immunology Indoor Allergy/Air Pollution Committee. Journal of Allergy and Clinical Immunology, 125 (3), 575–581. doi:10.1016/j.jaci.2010.01.023. ↩
  • Shi, L. D., E. Chu, I. Anguelovski, A. Aylett, J. Debats, K. Goh, T. Schenk, K. C. Seto, D. Dodman, D. Roberts, J. T. Roberts, and S. D. VanDeveer, 2016: Roadmap towards justice in urban climate adaptation research. Nature Climate Change, 6 (2), 131–137. doi:10.1038/nclimate2841. ↩
  • Shi, L., E. Chu, and J. Debats, 2015: Explaining progress in climate adaptation planning across 156 U.S. municipalities. Journal of the American Planning Association, 81 (3), 191–202. doi:10.1080/01944363.2015.1074526. ↩
  • Simonovic, S. P., A. Schardong, D. Sandink, and R. Srivastav, 2016: A web-based tool for the development of Intensity Duration Frequency curves under changing climate. Environmental Modelling & Software, 81, 136–153. doi:10.1016/j.envsoft.2016.03.016. ↩
  • Solecki, W., C. Rosenzweig, V. Gornitz, R. Horton, D. C. Major, L. Partrick, and R. Zimmerman, 2014: Climate change and infrastructure adaptation in coastal New York City. Climate Change and the Coast: Building Resilient Communities., CRC Press, Boca Raton, FL, 125–146. ↩
  • Spanger-Siegfried, E., M. Fitzpatrick, and K. Dahl, 2014: Encroaching Tides: How Sea Level Rise and Tidal Flooding Threaten U.S. East and Gulf Coast Communities over the Next 30 Years. Union of Concerned Scientists, Cambridge, MA, 64 pp. URL. ↩
  • Staebler, P., 2017: The 50% FEMA rule appraisal. The Appraisal Journal, Fall, 261–273. URL. ↩
  • Stanke, C., M. Kerac, C. Prudhomme, J. Medlock, and V. Murray, 2013: Health effects of drought: A systematic review of the evidence. PLoS Currents: Disasters, doi:10.1371/currents.dis.7a2cee9e980f91ad7697b570bcc4b004. ↩
  • Stone, B. J., J. Vargo, P. Liu, D. Habeeb, A. DeLucia, M. Trail, Y. Hu, and A. Russell, 2014: Avoided heat-related mortality through climate adaptation strategies in three US cities. PLoS ONE, 9 (6), e100852. doi:10.1371/journal.pone.0100852. ↩
  • Stratus Consulting and Denver Water, 2015: Embracing uncertainty: A case study examination of how climate change is shifting water utility planning. Prepared for the Water Utility Climate Alliance (WUCA), the American Water Works Association (AWWA), the Water Research Foundation (WRF), and the Association of Metropolitan Water Agencies (AMWA) by Stratus Consulting Inc., Boulder, CO (Karen Raucher and Robert Raucher) and Denver Water, Denver, CO (Laurna Kaatz). Stratus Consulting, Boulder, CO, various pp. URL. ↩
  • Stults, M., and S. Meerow, 2017: Professional Societies and Climate Change. The Kresge Foundation, Troy, MI, 36 pp. URL. ↩
  • Sustainable Accounting Standards Board (SASB), 2017: SASB Conceptual Framework [web site]. URL. ↩
  • Szlavecz, K., P. S. Warren, and S. T. A. Pickett, 2011: Biodiversity in the urban landscape. The Human Population: Its Influence on Biological Diversity. Cincotta, R. P., and L. J. Gorenflo, Eds., Springer-Verlag, Berlin, 75–98. ↩
  • Task Force on Climate-Related Financial Disclosures, 2016: Implementing the Recommendations of the Task Force on Climate-Related Financial Disclosures. Financial Stability Board, New York, NY, 82 pp. URL. ↩
  • Taylor, L., and D. F. Hochuli, 2015: Creating better cities: How biodiversity and ecosystem functioning enhance urban residents' wellbeing. Urban Ecosystems, 18 (3), 747–762. doi:10.1007/s11252-014-0427-3. ↩
  • TCFD, 2017: Final Report: Recommendations of the Task Force on Climate-Related Financial Disclosures. Task Force on Climate-Related Financial Disclosures (TCFD), Basel, Switzerland, 66 pp. URL. ↩
  • Torres, D., and M. Maletjane, 2015: Information and communication technologies for climate change adaptation in cities. International Telecommunication Union (ITU), Focus Group on Smart Sustainable Cities – Working Group 2, 33 pp. URL. ↩
  • Toth, A., S. Rendall, and F. Reitsma, 2016: Resilient food systems: A qualitative tool for measuring food resilience. Urban Ecosystems, 19 (1), 19–43. doi:10.1007/s11252-015-0489-x. ↩
  • U.S. Census Bureau American FactFinder, 2017: Annual Estimates of the Resident Population: April 1, 2010 to July 1, 2016. U.S. Census Bureau, Population Division, Washington, DC. URL. ↩
  • U.S. Census Bureau, 2016: Measuring America: Our Changing Landscape [Infographic]. U.S. Census Bureau, Washington, DC. URL. ↩
  • U.S. Federal Government, 2016: U.S. Climate Resilience Toolkit: Environment and Natural Resources [web page]. U.S. Global Change Research Program, Washington, DC. URL. ↩
  • Uejio, C. K., O. V. Wilhelmi, J. S. Golden, D. M. Mills, S. P. Gulino, and J. P. Samenow, 2011: Intra-urban societal vulnerability to extreme heat: The role of heat exposure and the built environment, socioeconomics, and neighborhood stability. Health & Place, 17 (2), 498–507. doi:10.1016/j.healthplace.2010.12.005. ↩
  • UN-Habitat, 2016: Urbanization and Development: Emerging Futures. World Cities report 2016. HS/038/16E. United Nations Human Settlements Programme (UN-Habitat) , Nairobi, Kenya, 247 pp. URL. ↩
  • UNDP, 2011: Paving the Way for Climate-Resilient Infrastructure: Guidance for Practitioners and Planners. United Nations Development Programme (UNDP), New York, NY, 126 pp. URL. ↩
  • Urban Climate Change Research Network, 2015: Climate Change and Cities. Second Assessment Report of the Urban Climate Change Research Network. Summary for City Leaders. Columbia University, New York, NY, URL. ↩
  • US EPA, 2015: Systems Measures of Water Distribution System Resilience. EPA/600/R-14/383, Washington, DC,. ↩
  • USDA ERS, 2017: Rural Employment and Unemployment. USDA, Economic Research Service (ERS), Washington, DC. URL. ↩
  • USGCRP, 2016: The Impacts of Climate Change on Human Health in the United States: A Scientific Assessment. U.S. Global Change Research Program, Washington, DC, 312 pp. doi:10.7930/J0R49NQX. ↩
  • USGCRP, 2017: Climate Science Special Report: Fourth National Climate Assessment, Volume I. Wuebbles, D. J., D. W. Fahey, K. A. Hibbard, D. J. Dokken, B. C. Stewart, and T. K. Maycock, Eds. U.S. Global Change Research Program, Washington, DC, USA, 470 pp. doi:10.7930/J0J964J6. ↩
  • USGCRP, 2018: Second State of the Carbon Cycle Report (SOCCR2): A Sustained Assessment Report. U.S. Global Change Research Program, Washington, DC, 877 pp. URL. ↩
  • Vanos, J. K., A. Middel, G. R. McKercher, E. R. Kuras, and B. L. Ruddell, 2016: Hot playgrounds and children's health: A multiscale analysis of surface temperatures in Arizona, USA. Landscape and Urban Planning, 146, 29–42. doi:10.1016/j.landurbplan.2015.10.007. ↩
  • Venkateswaran, K., K. MacClune, S. Gladfelter, and M. Szönyi, 2015: Risk nexus: What can be learned from the Columbia and Charleston floods 2015? Zurich Insurance Group, Zurich, Switzerland, 45 pp. URL. ↩
  • Vogel, J. M., M. O'Grady, and S. Renfrow, 2015: A Climate Change Vulnerability Assessment Report for the National Renewable Energy Laboratory: May 23, 2014-June 5, 2015. NREL/SR-3500-64174. National Renewal Energy Laboratory, Golden, CO, 42 pp. URL. ↩
  • Vogel, J., K. M. Carney, J. B. Smith, C. Herrick, M. Stults, M. O'Grady, A. S. Juliana, H. Hosterman, and L. Giangola, 2016: Climate Adaptation — The State of Practice in U.S. Communities. Kresge Foundation, Detroit, URL. ↩
  • Vose, R. S., D. R. Easterling, K. E. Kunkel, A. N. LeGrande, and M. F. Wehner, 2017: Temperature Changes in the United States. Climate Science Special Report: Fourth National Climate Assessment, Volume I. Wuebbles, D. J., D. W. Fahey, K. A. Hibbard, D. J. Dokken, B. C. Stewart, and T. K. Maycock, Eds., U.S. Global Change Research Program, Washington, DC, USA, 185–206. doi:10.7930/J0N29V45. ↩
  • Walker, R. E., C. R. Keane, and J. G. Burke, 2010: Disparities and access to healthy food in the United States: A review of food deserts literature. Health & Place, 16, 876–884. doi:10.1016/j.healthplace.2010.04.013. ↩
  • Warziniack, T., and M. Thompson, 2013: Wildfire risk and optimal investments in watershed protection. Western Economics Forum, 12 (2), 19–28. URL. ↩
  • Watson, A., A. Gaspard, and A. Lebreton, 2016: Food, Climate Change, and the City. FNH-IUFN-UNEP Policy Perspectives Paper. United Nations Environment Programme, Nairobi, Kenya, 20 pp. URL. ↩
  • Wehner, M. F., J. R. Arnold, T. Knutson, K. E. Kunkel, and A. N. LeGrande, 2017: Droughts, Floods, and Wildfires. Climate Science Special Report: Fourth National Climate Assessment, Volume I. Wuebbles, D. J., D. W. Fahey, K. A. Hibbard, D. J. Dokken, B. C. Stewart, and T. K. Maycock, Eds., U.S. Global Change Research Program, Washington, DC, USA, 231–256. doi:10.7930/J0CJ8BNN. ↩
  • Wilbanks, T. J., and S. Fernandez, Eds., 2014: Climate Change and Infrastructure, Urban Systems, and Vulnerabilities. Island Press, Washington, DC, 108 pp. URL. ↩
  • Willis, H. H., and K. Loa, 2015: Measuring the Resilience of Energy Distribution Systems. RAND Corporation, Santa Monica, CA,. ↩
  • Wolch, J. R., J. Byrne, and J. P. Newell, 2014: Urban green space, public health, and environmental justice: The challenge of making cities “just green enough.” Landscape and Urban Planning, 125, 234–244. doi:10.1016/j.landurbplan.2014.01.017. ↩
  • Woodward, M., Z. Kapelan, and B. Gouldby, 2014: Adaptive flood risk management under climate change uncertainty using real options and optimization. Risk Analysis, 34 (1), 75–92. doi:10.1111/risa.12088. ↩
  • World Federation of Engineering Organizations (WFEO) Committee on Engineering and the Environment, 2015: Model Code of Practice: Principles of Climate Change Adaptation for Engineers. Paris, France,. ↩
  • Wright, K., K. Whitehouse, and J. Curti, 2017: Voluntary Resilience Standards: An Assessment of the Emerging Market for Resilience in the Built Environment. Meister Consultants Group, Boston, MA, 31 pp. URL. ↩
  • Wright, R. N., B. M. Ayyub, and F. T. Lombardo, 2013: Bridging the gap between climate change science and structural engineering practice. Structure Magazine, September, 29–32. URL. ↩
  • Younger, M., H. R. Morrow-Almeida, S. M. Vindigni, and A. L. Dannenberg, 2008: The built environment, climate change, and health: Opportunities for co-benefits. American Journal of Preventive Medicine, 35 (5), 517–526. doi:10.1016/j.amepre.2008.08.017. ↩
  • Zamuda, C., B. Mignone, D. Bilello, K. Hallett, C. Lee, J. Macknick, R. Newmark, and D. Steinberg, 2013: U.S. Energy Sector Vulnerabilities to Climate Change and Extreme Weather. U.S. Department of Energy, Office of Policy and International Affairs, various pp. URL. ↩
  • Zhao, L., X. Lee, R. B. Smith, and K. Oleson, 2014: Strong contributions of local background climate to urban heat islands. Nature, 511 (7508), 216–219. doi:10.1038/nature13462. ↩

External Link External Link

You are leaving The Fourth National Climate Assessment and will be redirected to a new site in 5 seconds.

USGCRP Globalchange.gov earth logo

13 Logos #1 13 Logos #2

U.S. Global Change Research Program
1800 G Street, NW, Suite 9100, Washington, DC 20006 USA
Tel: +1 202.223.6262 | Fax: +1 202.223.3065

Contact Us • Credits • Privacy Policy • Site Map

Some figures and images are copyright protected.
Permission of the copyright owner must be obtained
before making use of copyrighted material.