NCA4 Water
  • ABOUT
    About this Report Guide to this Report Report Credits
  • CHAPTERS

    Front Matter

    • About this Report
    • Guide to the Report
    Summary Findings
    1. Overview

    National Topics

    1. Our Changing Climate
    2. Water
    3. Energy Supply, Delivery & Demand
    4. Land Cover & Land-Use Change
    5. Forests
    6. Ecosystems, Ecosystem Services, & Biodiversity
    7. Coastal Effects
    8. Oceans & Marine Resources
    9. Agriculture & Rural Communities
    10. Built Environment, Urban Systems, & Cities
    11. Transportation

    National Topics (cont.)

    1. Air Quality
    2. Human Health
    3. Tribes & Indigenous Peoples
    4. Climate Effects on U.S. International Interests
    5. Sector Interactions, Multiple Stressors, & Complex Systems

    Regions

    1. Northeast
    2. Southeast
    3. U.S. Caribbean
    4. Midwest
    5. Northern Great Plains
    6. Southern Great Plains
    7. Northwest
    8. Southwest
    9. Alaska
    10. Hawai‘i & U.S.-Affiliated Pacific Islands

    Responses

    1. Reducing Risks Through Adaptation Actions
    2. Reducing Risks Through Emissions Mitigation

    Appendices

    1. Report Development Process
    2. Information in the Fourth National Climate Assessment
    3. Data Tools & Scenario Products
    4. Looking Abroad
    5. Frequently Asked Questions
  • DOWNLOADS
    View All Report Downloads Chapter Executive Summary PDF Full Chapter PDF Chapter Figures (.zip) Chapter Bibliography (RIS) Chapter Presentation Package
CH 3: Water
×

FOURTH NATIONAL CLIMATE ASSESSMENT

CHAPTER 3: WATER

Key Message 1
Changes in Water Quantity and Quality

Significant changes in water quantity and quality are evident across the country. These changes, which are expected to persist, present an ongoing risk to coupled human and natural systems and related ecosystem services. Variable precipitation and rising temperature are intensifying droughts, increasing heavy downpours, and reducing snowpack. Reduced snow-to-rain ratios are leading to significant differences between the timing of water supply and demand. Groundwater depletion is exacerbating drought risk. Surface water quality is declining as water temperature increases and more frequent high-intensity rainfall events mobilize pollutants such as sediments and nutrients.

Read More

Key Message 2
Deteriorating Water Infrastructure at Risk

Deteriorating water infrastructure compounds the climate risk faced by society. Extreme precipitation events are projected to increase in a warming climate and may lead to more severe floods and greater risk of infrastructure failure in some regions. Infrastructure design, operation, financing principles, and regulatory standards typically do not account for a changing climate. Current risk management does not typically consider the impact of compound extremes (co-occurrence of multiple events) and the risk of cascading infrastructure failure.

Read More

Key Message 3
Water Management in a Changing Future

Water management strategies designed in view of an evolving future we can only partially anticipate will help prepare the Nation for water- and climate-related risks of the future. Current water management and planning principles typically do not address risk that changes over time, leaving society exposed to more risk than anticipated. While there are examples of promising approaches to manage climate risk, the gap between research and implementation, especially in view of regulatory and institutional constraints, remains a challenge.

Read More

Key Message 1

Significant changes in water quantity and quality are evident across the country. These changes, which are expected to persist, present an ongoing risk to coupled human and natural systems and related ecosystem services. Variable precipitation and rising temperature are intensifying droughts, increasing heavy downpours, and reducing snowpack. Reduced snow-to-rain ratios are leading to significant differences between the timing of water supply and demand. Groundwater depletion is exacerbating drought risk. Surface water quality is declining as water temperature increases and more frequent high-intensity rainfall events mobilize pollutants such as sediments and nutrients.

Key Message 2

Deteriorating water infrastructure compounds the climate risk faced by society. Extreme precipitation events are projected to increase in a warming climate and may lead to more severe floods and greater risk of infrastructure failure in some regions. Infrastructure design, operation, financing principles, and regulatory standards typically do not account for a changing climate. Current risk management does not typically consider the impact of compound extremes (co-occurrence of multiple events) and the risk of cascading infrastructure failure.

Key Message 3

Water management strategies designed in view of an evolving future we can only partially anticipate will help prepare the Nation for water- and climate-related risks of the future. Current water management and planning principles typically do not address risk that changes over time, leaving society exposed to more risk than anticipated. While there are examples of promising approaches to manage climate risk, the gap between research and implementation, especially in view of regulatory and institutional constraints, remains a challenge.

Likelihood

Virtually Certain Extremely Likely Very Likely Likely About as Likely as Not Unlikely Very Unikely Extremely Unlikely Exceptionally Unlikely
99%–100% 95%–100% 90%–100% 66%-100% 33%-66% 0%-33% 0%-10% 0%-5% 0%-1%

Confidence Level

Very High High Medium Low
Strong evidence (established theory, multiple sources, consistent results, well documented and accepted methods, etc.), high consensus Moderate evidence (several sources, some consistency, methods vary and/or documentation limited, etc.), medium consensus Suggestive evidence (a few sources, limited consistency, models incomplete, methods emerging, etc.), competing schools of thought Inconclusive evidence (limited sources, extrapolations, inconsistent findings, poor documentation and/or methods not tested, etc.), disagreement or lack of opinions among experts
 

Documenting Uncertainty: This assessment relies on two metrics to communicate the degree of certainty in Key Findings. See Guide to this Report for more on assessments of likelihood and confidence.

  • SECTIONS
  • Executive Summary
  • State of the Sector
  • Regional Summary
  • KM 1: Water Quantity & Quality
  • KM 2: Water Infrastructure
  • KM 3: Water Management
  • Traceable Accounts
  • References

EXECUTIVE SUMMARY:
Chapter 3: Water

Executive Summary

Ensuring a reliable supply of clean freshwater to individuals, communities, and ecosystems, together with effective management of floods and droughts, is the foundation of human and ecological health. The water sector is also central to the economy and contributes significantly to the resilience of many other sectors, including agriculture, energy, urban environments, and industry.

Water systems face considerable risk, even without anticipated future climate changes. Limited surface water storage, as well as a limited ability to make use of long-term drought forecasts and to trade water across uses and basins, has led to a significant depletion of aquifers in many regions in the United States.1 Across the Nation, much of the critical water and wastewater infrastructure is nearing the end of its useful life. To date, no comprehensive assessment exists of the climate-related vulnerability of U.S. water infrastructure (including dams, levees, aqueducts, sewers, and water and wastewater distribution and treatment systems), the potential resulting damages, or the cost of reconstruction and recovery. Paleoclimate information (reconstructions of past climate derived from ice cores or tree rings) shows that over the last 500 years, North America has experienced pronounced wet/dry regime shifts that sometimes persisted for decades.2 Because such protracted exposures to extreme floods or droughts in different parts of the country are extraordinary compared to events experienced in the 20th century, they are not yet incorporated in water management principles and practice. Anticipated future climate change will exacerbate this risk in many regions.

A central challenge to water planning and management is learning to plan for plausible future climate conditions that are wider in range than those experienced in the 20th century. Doing so requires approaches that evaluate plans over many possible futures instead of just one, incorporate real-time monitoring and forecast products to better manage extremes when they occur, and update policies and engineering principles with the best available geoscience-based understanding of planetary change. While this represents a break from historical practice, recent examples of adaptation responses undertaken by large water management agencies, including major metropolitan water utilities and the U.S. Army Corps of Engineers, are promising.


Depletion of Groundwater in Major U.S. Regional Aquifers

Depletion of Groundwater in Major U.S. Regional Aquifers
Two maps show groundwater depletion rates (in units of cubic kilometers per year) in units of cubic kilometers per year, for major aquifers in the contiguous United States. One map shows depletion rates for the period 1900 to 2000, and the other shows depletion rates for the period 2001 to 2008. For the period 1900 to 2000, groundwater supplies have declined across central California, the Desert Southwest, the Gulf Coastal Plain, the Atlantic Coastal Plain, the Upper Midwest, the Lower Mississippi Valley, and the High Plains Aquifer. Of these, the High Plains Aquifer has depleted at the highest rate—roughly 2 to 4 cubic kilometers per year. For the period 2001 to 2008, rates of decline have slowed in the Desert Southwest, while rates of decline in the High Plains Aquifer and across the Lower Mississippi Valley have accelerated to 7 to 11 cubic kilometers per year.
(left) Groundwater supplies have been decreasing in the major regional aquifers of the United States over the last century (1900–2000). (right) This decline has accelerated recently (2001–2008) due to persistent droughts in many regions and the lack of adequate surface water storage to meet demands. This decline in groundwater compromises the ability to meet water needs during future droughts and impacts the functioning of groundwater dependent ecosystems (e.g., Kløve et al. 20143). The values shown are net volumetric rates of groundwater depletion (km3 per year) averaged over each aquifer. Subareas of an aquifer may deplete at faster rates or may be actually recovering. Hatching in the figure represents where the High Plains Aquifer overlies the deep, confined Dakota Aquifer. From Figure 3.2 (Source: adapted from Konikow 2015.4 Reprinted from Groundwater with permission of the National Groundwater Association. © 2015).

CHAPTER 3
Water

State of the Sector

Federal Coordinating Lead Authors:
Thomas Johnson, U.S. Environmental Protection Agency
Peter Colohan, National Oceanic and Atmospheric Administration
Chapter Lead:
Upmanu Lall, Columbia University
Chapter Authors:
Amir AghaKouchak, University of California, Irvine
Sankar Arumugam, North Carolina State University
Casey Brown, University of Massachusetts
Gregory McCabe, U.S. Geological Survey
Roger Pulwarty, National Oceanic and Atmospheric Administration
Review Editor:
Minxue He, California Department of Water Resources
USGCRP Coordinators:
Kristin Lewis, Senior Scientist
Allyza Lustig, Program Coordinator

<b>Lall</b>, U., T. Johnson, P. Colohan, A. Aghakouchak, C. Brown, G. McCabe, R. Pulwarty, and A. Sankarasubramanian, 2018: Water. In <i>Impacts, Risks, and Adaptation in the United States: Fourth National Climate Assessment, Volume II</i> [Reidmiller, D.R., C.W. Avery, D.R. Easterling, K.E. Kunkel, K.L.M. Lewis, T.K. Maycock, and B.C. Stewart (eds.)]. U.S. Global Change Research Program, Washington, DC, USA, pp. 145–173. doi: 10.7930/NCA4.2018.CH3

  • U.S. Climate Resilience Toolkit
  • Climate Science Special Report
  • Scenarios for the National Climate Assessment
  • Climate & Health Assessment

Water security in the United States is increasingly in jeopardy. Ensuring a reliable supply of clean freshwater to communities, agriculture, and ecosystems, together with effective management of floods and droughts, is the foundation of human and ecological health. The water sector is also central to the economy, contributing significantly to the resilience of many other sectors, including agriculture (Ch. 10: Ag & Rural, KM 2 and 4), energy (Ch. 4: Energy), urban environments (Ch. 11: Urban), and industry. The health and productivity of natural aquatic and wetland ecosystems are also closely linked to the water sector (Ch. 7: Ecosystems, KM 1).

Changes in the frequency and intensity of climate extremes relative to the 20th century5,6 and deteriorating water infrastructure are contributing to declining community and ecosystem resilience. Climate change is a major driver of changes in the frequency, duration, and geographic distribution of severe storms, floods, and droughts (Ch. 2: Climate). In addition, paleoclimate information (reconstructions of past climate derived from ice cores or tree rings) shows that over the last 500 years, North America has experienced pronounced wet/dry regime shifts that sometimes persisted for decades.2 These shifts led to protracted exposures to extreme floods or droughts in different parts of the country that are extraordinary compared to events experienced in the 20th century. Operational principles for engineering, design, insurance programs, water quality regulations, and water allocation generally have not factored in these longer-term perspectives on historical climate variability or projections of future climate change.7,8 While there has been much discussion on the need for climate adaptation, the design and implementation of processes that consider near- and long-term information on a changing climate are still nascent.9,10,11

Water systems face considerable risk even without anticipated future climate changes. Gains in water-use efficiency over the last 30 years have resulted in total U.S. water consumption staying relatively constant.12 Gains in efficiency are most evident in urban centers.13 However, limited surface water storage and a limited ability to make use of long-term drought forecasts and to trade water across uses and basins have led to the significant depletion of aquifers in many regions of the United States.1 Aging and deteriorating dams and levees14 also represent an increasing hazard when exposed to extreme or, in some cases, even moderate rainfall. Several recent heavy rainfall events have led to dam, levee, or critical infrastructure failures, including the Oroville emergency spillway in California in 2017,15 Missouri River levees in 2017, 50 dams in South Carolina in October 201516 and 25 more dams in the state in October 2016,17 and New Orleans levees in 2005 and 2015.18 The national exposure to this risk has not yet been fully assessed.

Regional Summary

Every region of the United States is affected by water sector sensitivities to weather- and climate-related events (see Figure 3.1). Recent examples are summarized below:

  • Northern and Southern Great Plains: Future changes in precipitation and the potential for more extreme rainfall events will exacerbate water-related challenges in the Northern Great Plains (Ch. 22: N. Great Plains, KM 1). Extreme precipitation and rising sea levels associated with climate change make the built environment in the Southern Great Plains increasingly vulnerable to disruption, particularly as infrastructure ages and deteriorates (Ch. 23: S. Great Plains, KM 2). Flooding on the Mississippi and Missouri Rivers in May 2011 caused an estimated $5.7 billion in damages (in 2018 dollars).19 One year later, drought conditions in 2012 led to record low flows on the Mississippi, disrupting river navigation and agriculture and resulting in widespread harvest failures for corn, sorghum, soybean, and other crops (e.g., Ziska et al. 2016).20 The nationwide total damage from the 2012 drought is estimated at $33 billion (in 2018 dollars).19

  • Northeast and Southeast: Much of the water infrastructure in the Northeast is nearing the end of its planned life expectancy. Disruptions to infrastructure are already occurring and will likely become more common with a changing climate (Ch. 18: Northeast, KM 3). Hurricane Irene (2011) and Superstorm Sandy (2012) highlighted the inadequacy of deteriorating urban infrastructure, including combined sewers, for managing current and future storm events.19 In the Southeast, the combined effects of extreme rainfall events and rising sea level are increasing flood frequencies, making coastal and low-lying regions highly vulnerable to climate change impacts (Ch. 8: Coastal, KM 1; Ch. 19: Southeast, KM 2). In South Carolina in 2015, locally extreme rainfall exceeding 20 inches over 3 days19 caused widespread damage, including the failure of 49 state-regulated dams, one federally regulated dam, two sections of the levee adjacent to the Columbia Canal, and many unregulated dams.16 In Louisiana in 2016, a severe large-scale storm with record atmospheric moisture dropped nearly 20 inches of rain in 72 hours, triggering widespread flooding that damaged at least 60,000 homes and led to 13 deaths.21

  • Midwest: Storm water management systems and other critical infrastructure in the Midwest are already experiencing impacts from changing precipitation patterns and elevated flood risks (Ch. 21: Midwest, KM 5). In addition, harmful algal blooms (HABs) in western Lake Erie have been steadily increasing over the past decade.22 Warmer temperatures and heavy precipitation associated with climate change contribute to the development of HABs.23,24 Harmful algal blooms can introduce cyanobacteria into recreational and drinking water sources, resulting in restrictions on access and use. In 2014 in Toledo, Ohio, half a million people were warned to avoid drinking the water due to toxins overwhelming a water treatment plant in Lake Erie’s western basin as a result of a harmful bloom. Conditions that encourage cyanobacteria growth, such as higher water temperatures, increased runoff, and nutrient-rich habitats, are projected to increase in the Midwest (Ch. 21: Midwest).

  • Northwest and Alaska: Pacific salmon populations in the Northwest are being affected by climate stressors, including low snowpack (such as in 2015), decreasing summer streamflow,25,26 habitat loss through increasing storm intensity and flooding,27,28 physiological and behavioral sensitivity, and increasing mortality due to warmer stream and ocean temperatures.29 Salmon are a cultural and ecological keystone species in this region. Salmon loss is a particular threat to the cultural identities and economies of Indigenous communities (Ch. 24: Northwest, KM 2; Ch. 15: Tribes). In Alaska, residents, communities, and their infrastructure also continue to be affected by flooding and erosion of coastal and river areas, resulting from changes in sea ice (Ch. 26: Alaska, KM 2).

  • Southwest: Water supplies for people and nature in the Southwest are decreasing during droughts due in part to human-caused climate change. Intensifying droughts, increasing heavy downpours, and reduced snowpack are combining with increasing water demands from a growing population, deteriorating infrastructure, and groundwater depletion to reduce the future reliability of water supplies (Ch. 25: Southwest, KM 1). The 2011–2016 California drought was characterized by low precipitation combined with record high temperatures, leading to significant socioeconomic and environmental impacts.30,31 Drought risk is being exacerbated by increasing human water use and the depletion of groundwater that serves as a buffer against water scarcity.30 Rising air temperatures may increase the chance of droughts in the western United States.31,32 Compounding the impacts of drought in February 2017, heavy, persistent rainfall across northern and central California led to substantial property and infrastructure damage from record flooding, landslides, and erosion.

  • U.S. Caribbean, Hawaiʻi and U.S.-Affiliated Pacific Islands: Dependable and safe water supplies for the communities and ecosystems of the U.S. Caribbean, Hawaiʻi, and the U.S.-Affiliated Pacific Islands are threatened by rising temperatures, sea level rise, saltwater intrusion, and increased risk of extreme drought and flooding (Ch. 20: U.S. Caribbean, KM 1; Ch. 27: Hawaiʻi & Pacific Islands, KM 1). The U.S. Caribbean is experiencing an increasing frequency of extreme events that threaten life, property, and the economy (Ch. 20: U.S. Caribbean, KM 5). On September 20, 2017, Hurricane Maria struck the U.S. Virgin Islands as a Category 5 storm and then Puerto Rico as a Category 4 storm—just two weeks after Hurricane Irma had struck the Caribbean islands. The storms left devastation in their wake, with the power distribution severely damaged and drinking water and wastewater treatment plants rendered inoperable.33 Maria’s extreme rainfall, up to 37 inches in 48 hours in some places,34 also caused widespread flooding and mudslides across the islands.


Figure 3.1: Billion-Dollar Weather and Climate Disaster Events in the United States

Billion-Dollar Weather and Climate Disaster Events in the United States
Two graphs summarize the incidence and cost of water-related billion-dollar weather and climate disaster events in the United States from 1980 to 2017. On the left, a bar graph displays the combined total number of tropical cyclones, floods, and droughts each year that caused at least one billion dollars in damages. On the right, a line graph shows the combined total cost of the events per year. 2005 and 2017 are standout years. In 2005, five water-related billion-dollar disasters, including Hurricane Katrina, affected the Nation and caused more than 200 billion dollars in damages. In 2017, six events—including Hurricanes Harvey, Irma, and Maria—occurred, costing the Nation roughly 275 billion dollars in damages.
Figure 3.1: The figure shows (a) the total number of water-related billion-dollar disaster events (tropical cyclones, flooding, and droughts combined) each year in the United States and (b) the associated costs (in 2017 dollars, adjusted for inflation). Source: adapted from NOAA NCEI 2018.19

SHRINK

Key Message 1

Changes in Water Quantity and Quality

Significant changes in water quantity and quality are evident across the country. These changes, which are expected to persist, present an ongoing risk to coupled human and natural systems and related ecosystem services. Variable precipitation and rising temperature are intensifying droughts, increasing heavy downpours, and reducing snowpack. Reduced snow-to-rain ratios are leading to significant differences between the timing of water supply and demand. Groundwater depletion is exacerbating drought risk. Surface water quality is declining as water temperature increases and more frequent high-intensity rainfall events mobilize pollutants such as sediments and nutrients.

Climate change effects on hydrology, floods, and drought for the United States are discussed in the Climate Science Special Report35,36 and the Third National Climate Assessment.6 Increasing air temperatures have substantially reduced the fraction of winter precipitation falling as snow, particularly over the western United States.37,38,39,40,41,42 Warming has resulted in a shift in the timing of snowmelt runoff to earlier in the year.39,43,44,45,46,47 Glaciers continue to melt in Alaska25,48 and the western United States (Ch. 1: Overview, Figure 1.2d).49,50 Shifts in the hydrological regime due to glacier melting will alter stream water volume, water temperature, runoff timing, and aquatic ecosystems in these regions. As temperatures continue to rise, there is a risk of decreased and highly variable water supplies for human use and ecosystem maintenance.32,51

Additionally, heavy precipitation events in most parts of the United States have increased in both intensity and frequency since 1901 and are projected to continue to increase over this century under both a lower and higher scenario (RCP4.5 and RCP8.5; see Easterling et al. 2017, Key Finding 235). There are, however, important regional and seasonal differences in projected changes in total precipitation.

Higher temperatures also result in increased human use of water, particularly through increased water demand for agriculture arising from increased evapotranspiration (Ch. 10: Ag & Rural, KM 1).52,53 In some regions of the United States, water supplies are already stressed by increasing consumption.12 Continued warming will add to the stress on water supplies and adversely impact water supply reliability in parts of the United States. Over the last 30 years, improvements in water-use efficiency have offset the increasing water needs from population growth, and national water use has remained constant.12 However, without efforts to increase water-use efficiency in rural and urban areas, increased future demand due to warming could exceed future supply in some locations.13

In the United States, groundwater provides more than 40% of the water used for agriculture (irrigation and livestock) and domestic water supplies (Ch. 25: Southwest; Ch. 10: Ag & Rural, KM 1).1,12 Groundwater use for irrigation has increased substantially since about 1900 and in some areas has exceeded natural aquifer recharge rates.54 For example, in the High Plains Aquifer, the largest freshwater aquifer in the contiguous United States that supports an important agricultural region,55 the rate of groundwater withdrawal for irrigation is nearly 10 times the rate of natural recharge, resulting in large groundwater depletions (see Figure 3.2).56,57,58,59 Groundwater pumping for irrigation is a substantial driver of long-term trends in groundwater levels in the central United States.60,61 In many parts of the United States, groundwater is being depleted due to increased pumping during droughts and concentrated demands in urban areas.1 Increasing air temperatures, insufficient precipitation, and associated increases in irrigation requirements will likely result in greater groundwater depletion in the coming decades.62 The lack of coordinated management of surface water and groundwater storage limits the Nation’s ability to address climate variability. Management of surface water and groundwater storage and water quality are not coordinated across different agencies, leading to inefficient response to changing climate.

Changes in climate and hydrology have direct and cascading effects on water quality.63,64 Anticipated effects include warming water temperatures in all U.S. regions, which affect ecosystem health (Ch. 7: Ecosystems), and locally variable changes in precipitation and runoff, which affect pollutant transport into and within water bodies.6,65 These changes pose challenges related to the cost and implications of water treatment, and they present a risk to water supplies, public health, and aquatic ecosystems. Increases in high flow events can increase the delivery of sediment,66,67,68 nutrients,69,70,71,72 and microbial pathogens23,73 to streams, lakes, and estuaries; decreases in low flow volume (such as in the summer) and during periods of drought can impact aquatic life through exposure to high water temperatures and reduced dissolved oxygen.74,75,76 The risk of harmful algal blooms could increase due to an expanded seasonal window of warm water temperatures and the potential for episodic increases in nutrient loading.23,24,77 In coastal areas, saltwater intrusion into coastal rivers and aquifers can be exacerbated by sea level rise (or relative sea level rise related to vertical land movement) (Ch. 1: Overview, Figure 1.4), storm surges, and altered freshwater runoff. Saltwater intrusion could threaten drinking water supplies, infrastructure,78 and coastal and estuarine ecosystems (Ch. 8: Coastal).79,80 Indirect impacts on water quality are also possible in response to an increased frequency of forest pest/disease outbreaks, wildfire, and other terrestrial ecosystem changes; land-use changes (for example, agricultural and urban) and water management infrastructure also interact with climate change to impact water quality.


Figure 3.2: Depletion of Groundwater in Major U.S. Regional Aquifers

Depletion of Groundwater in Major U.S. Regional Aquifers
Two maps show groundwater depletion rates (in units of cubic kilometers per year) in units of cubic kilometers per year, for major aquifers in the contiguous United States. One map shows depletion rates for the period 1900 to 2000, and the other shows depletion rates for the period 2001 to 2008. For the period 1900 to 2000, groundwater supplies have declined across central California, the Desert Southwest, the Gulf Coastal Plain, the Atlantic Coastal Plain, the Upper Midwest, the Lower Mississippi Valley, and the High Plains Aquifer. Of these, the High Plains Aquifer has depleted at the highest rate—roughly 2 to 4 cubic kilometers per year. For the period 2001 to 2008, rates of decline have slowed in the Desert Southwest, while rates of decline in the High Plains Aquifer and across the Lower Mississippi Valley have accelerated to 7 to 11 cubic kilometers per year.
Figure 3.2: (left) Groundwater supplies have been decreasing in the major regional aquifers of the United States over the last century (1900–2000). (right) This decline has accelerated recently (2001–2008) due to persistent droughts in many regions and the lack of adequate surface water storage to meet demands. This decline in groundwater compromises the ability to meet water needs during future droughts and impacts the functioning of groundwater dependent ecosystems (e.g., Kløve et al. 20143). The values shown are net volumetric rates of groundwater depletion (km3 per year) averaged over each aquifer. Subareas of an aquifer may deplete at faster rates or may be actually recovering. Hatching in the figure represents where the High Plains Aquifer overlies the deep, confined Dakota Aquifer. Source: adapted from Konikow 2015.4 Reprinted from Groundwater with permission of the National Groundwater Association. © 2015.

SHRINK

Key Message 2

Deteriorating Water Infrastructure at Risk

Deteriorating water infrastructure compounds the climate risk faced by society. Extreme precipitation events are projected to increase in a warming climate and may lead to more severe floods and greater risk of infrastructure failure in some regions. Infrastructure design, operation, financing principles, and regulatory standards typically do not account for a changing climate. Current risk management does not typically consider the impact of compound extremes (co-occurrence of multiple events) and the risk of cascading infrastructure failure.

Across the Nation, much of the critical water infrastructure is aging and, in some cases, deteriorating or nearing the end of its design life, presenting an increased risk of failure . Estimated reconstruction and maintenance costs aggregated across dams, levees, aqueducts, sewers, and water and wastewater treatment systems total in the trillions of dollars based on a variety of different sources.14,81,82,83,84,85,86,87 Capital improvement needs for public water systems (which provide safe drinking water) have been estimated at $384 billion for projects necessary from 2011 through 2030.88 Similarly, capital investment needs for publicly owned wastewater conveyance and treatment facilities, combined sewer overflow correction, and storm water management to address water quality or water quality-related public health problems have been estimated at $271 billion over a 20-year period.89 More than 15,000 dams in the United States are listed as high risk85 due to the potential losses that may result if they failed.

Extreme precipitation events are projected to increase in a warming climate and may lead to more severe floods and greater risk of infrastructure failure in some regions.90 Long-lasting droughts and warm spells can also compromise earth dams and levees as a result of the ground cracking due to drying, a reduction of soil strength, erosion, and subsidence (sinking of land).91,92 To date, however, there is no comprehensive assessment of the climate-related vulnerability of U.S. water infrastructure, and climate risks to existing infrastructure systems remain unquantified. Tools, case studies, and other information are available that can be adopted into design standards and operational guidelines to account for future climate and/or integrate climate projections into infrastructure design (e.g., EPA 2016, Ragno et al. 2018;90,93 see also Key Message 3). However, there are no common design standards or operational guidelines that address how infrastructure should be designed and operated in the face of changing climate risk or that even target the range of climate variability seen over the last 500 years.

Procedures for the design, estimation of probability of failure, and risk assessment of infrastructure rely on 10–100 years of past data about flood and rainfall intensity, frequency, and duration (e.g., Vahedifard et al. 201715). This approach assumes that the frequency and severity of extremes do not change significantly over time.94 However, numerous studies suggest that the severity and frequency of climatic extremes, such as precipitation and heat waves, have, in fact, been changing.5,14,25,95,96,97,98,99 These changes present a regionally variable risk of increased frequency and severity of floods and drought.6,36 In addition, tree ring reconstructions of climate over the past 500 years for the United States illustrate a much wider range of climate variability than does the instrumental record (which begins around 1900).100,101,102 This historical variability includes wet and dry periods with statistics very different from those of the 20th century. Infrastructure design that uses recent historical data may thus underrepresent the risk seen from the paleo record, even without considering future climate change. Statistical methods have been developed for climate risk and frequency analysis that incorporate observed and/or projected changes in extremes.90,94,103,104,105 However, these procedures have not yet been incorporated in infrastructure design codes and operational guidelines.

Compound extreme events—the combination of two or more hazard events or climate variables over space and/or time that leads to an extreme impact—have a multiplying effect on the risk to society, the environment, and built infrastructure.106 Recent examples include the 2016 Louisiana flood, which resulted in simultaneous flooding across a large area (Ch. 19: Southeast, KM 2 and Table 19.1);21 Superstorm Sandy in 2012, when extreme rainfall coincided with near high tides;107 and other events combining storm surge and extreme precipitation, such as Hurricane Isaac in 2012 and Hurricane Matthew in 2016. Traditional infrastructure design approaches and risk assessment frameworks often consider these drivers in isolation. For example, current coastal flood risk assessment methods consider changes in terrestrial flooding and ocean flooding separately,108,109,110,111,112 leading to an underestimation or overestimation of risk in coastal areas.112 Compound extremes can also increase the risk of cascading infrastructure failure since some infrastructure systems rely on others, and the failure of one system can lead to the failure of interconnected systems, such as water–energy infrastructure (Ch. 4: Energy; Ch. 17: Complex Systems).113

Key Message 3

Water Management in a Changing Future

Water management strategies designed in view of an evolving future we can only partially anticipate will help prepare the Nation for water- and climate-related risks of the future. Current water management and planning principles typically do not address risk that changes over time, leaving society exposed to more risk than anticipated. While there are examples of promising approaches to manage climate risk, the gap between research and implementation, especially in view of regulatory and institutional constraints, remains a challenge.

The susceptibility of society to the harmful effects of hydrologic variability and the implications of climate variability and change necessitate a reassessment of the water planning and management principles developed in the 20th century. Significant changes in many key hydrologic design variables (including the quantity and quality of water) and hydrologic extremes are being experienced around the Nation. Paleoclimate analyses and climate projections suggest persistent droughts and wet periods over the continental United States that are longer, cover more area, and are more intense than what was experienced in the 20th century. An evolving future, which can only be partially anticipated, adds to this risk. Furthermore, while hydroclimatic extremes are projected to increase in frequency, accurate predictions of changes in extremes at a particular location are not yet possible. Instead, climate projections provide a glimpse of possible future conditions and help to scope the plausible range of changes.

A central challenge to water planning and management is learning to plan for plausible future climate conditions that are wider in range than those experienced in the past (see Figure 3.3) (see also Ch. 28: Adaptation, KM 5). Doing so requires approaches that evaluate plans over many possible futures instead of just one, incorporate real-time monitoring and forecast products to better manage extremes when they occur, and update policies and engineering principles with the best available geoscience-based understanding of global change. The challenge is both scientific, in terms of developing and evaluating these approaches, and institutional–political, in terms of updating the regulatory–legal and institutional structures that constrain innovation in water management, planning, and infrastructure design.


Figure 3.3: Colorado River Basin Supply and Use

Colorado River Basin Supply and Use
Two line graphs show water supply and demand (in millions of acre-feet) for the Colorado River Basin. The left graph shows historical supply and use across the basin. The right graph shows projected supply and demand through 2060. While the Colorado River Basin’s water supply over the historical period has shown variability, water use across the basin has trended upward for most of the historical period. Since the mid-1990s, there has been an imbalance of supply and demand. This imbalance is expected to continue in the future. By 2060, the water supply, which is projected to range from 13 to 18 million acre-feet, could significantly lag demand, which is projected to range from 17 to 21 million acre-feet.
Figure 3.3: The figure shows the Colorado River Basin historical water supply and use, along with projected water supply and demand. The figure illustrates a challenge faced by water managers in many U.S. locations—a potential imbalance between future supply and demand but with considerable long-term variability that is not well understood for the future. For the projections, the dark lines are the median values and the shading represents the 10th to 90th percentile range. Source: adapted from U.S. Bureau of Reclamation 2012.114

SHRINK

One approach is to focus on better managing variability, which is likely the dominant source of operational uncertainty for many water systems.115 An example of this approach is incorporating monitoring of current conditions and forecasts of near-term future conditions (days to weeks to seasons) in lieu of stationary operating rules based on historical expectations. Forecasts of near-term hydrologic conditions can provide the basis for adaptive reservoir operations, but they require flexible operating rules. New York City, for example, altered existing operational guidelines to implement adaptive reservoir operations based on current hydrologic conditions to better meet new concerns for ecological flow requirements in addition to water supply goals.116 In another example, the International Joint Commission adopted a new operating plan for Upper Great Lakes water levels; the plan is based on the ability to provide acceptable performance, as defined by stakeholders, over thousands of possible future climates.117 The plan includes forecast-based operations and a funded adaptive management process linking observatories and information systems to water-release decisions to address unanticipated change.118 In addition, updating operations and optimizing for changing conditions as they occur provide additional operating flexibility for water supply, flood risk reduction, and hydropower reservoirs.119,120,121 Finally, financial instruments and water trading provide avenues for managing the effects of variability on water competition, especially between urban water supply and agricultural water use.122,123,124

Better management of variability does not eliminate the need for long-term planning that responds to plausible climate changes (see Figure 3.3). Major water utilities provide examples of planning that focus on identifying and managing vulnerabilities to a wide range of uncertain future conditions, rather than evaluating performance for a single future.125 For example, Tampa Bay Water employed 1,000 realizations of future demand and future supply to evaluate their preparedness for future conditions.126 Alternatively, Denver Water used a small set of carefully selected future climate and socioeconomic development scenarios to explore possible future vulnerabilities.125 The World Bank published a set of specific guidelines for implementing such robustness-based approaches in water investment evaluation.127 As described in Key Message 2, the nature of hydrologic extremes and their rarity complicate the detection of meaningful trends in flood risk,128 while traditional trend detection methods may lead to missed trends and underpreparation.129 In response to these challenges, the U.S. Army Corps of Engineers is exploring robustness to a wide range of trends and expected regret as metrics for evaluating flood management strategies,130,131 including the increased incorporation of natural infrastructure.132

Actions taken by communities and the managers of water systems of all sizes can help prepare the Nation for the water-related risks of climate variability and change. The risks associated with a changing climate are compounded by inadequate attention to the state of water infrastructure and insufficient maintenance. Developing new water management and planning approaches may require updating the regulatory, legal, and institutional structures that constrain innovation in water management, community planning, and infrastructure design.133,134 Furthermore, adequate maintenance and sufficient funding to monitor, maintain, and adapt water policy and infrastructure would help overcome many of these challenges. Continued collaboration on transboundary watershed coordination and agreements on both surface water and groundwater with Canada and Mexico are among the actions that could facilitate more sustainable binational water management practices.

Developing and implementing new approaches pose special challenges for smaller, rural, and other communities with limited financial and technical resources. The development and adoption of new approaches can be facilitated by assessments that compare the effectiveness of new management and planning approaches across regions; greater exchange of emerging expertise among water managers; and better conveyance of the underlying climate and water science to communities, managers, and other decision-makers.135,136

TRACEABLE ACCOUNTS

Process Description

Chapter authors were selected based on criteria, agreed on by the chapter lead and coordinating lead authors, that included a primary expertise in water sciences and management, knowledge of climate science and assessment of climate change impacts on water resources, and knowledge of climate change adaptation theory and practice in the water sector.

The chapter was developed through technical discussions and expert deliberation among chapter authors, federal coordinating lead authors, and staff from the U.S. Global Change Research Program (USGCRP). Future climate change impacts on hydrology, floods, and drought for the United States have been discussed in the Third National Climate Assessment6 and in the USGCRP’s Climate Science Special Report.35,36 Accordingly, emphasis here is on vulnerability and the risk to water infrastructure and management presented by climate variability and change, including interactions with existing patterns of water use and development and other factors affecting climate risk. The scope of the chapter is limited to inland freshwater systems; ocean and coastal systems are discussed in their respective chapters in this report.


KEY MESSAGES

1 2 3

Key Message 1: Changes in Water Quantity and Quality

Significant changes in water quantity and quality are evident across the country. These changes, which are expected to persist, present an ongoing risk to coupled human and natural systems and related ecosystem services (high confidence). Variable precipitation and rising temperature are intensifying droughts (high confidence), increasing heavy downpours (high confidence), and reducing snowpack (medium confidence). Reduced snow-to-rain ratios are leading to significant differences between the timing of water supply and demand (medium confidence). Groundwater depletion is exacerbating drought risk (high confidence). Surface water quality is declining as water temperature increases (high confidence) and more frequent high-intensity rainfall events mobilize pollutants such as sediments and nutrients (medium confidence).

Description of evidence base

Increasing air temperatures have substantially reduced the fraction of winter precipitation occurring as snow, particularly over the western United States,37,38,39,40,41,42,137 and warming has resulted in a shift in the timing of snowmelt runoff to earlier in the year.39,43,44,45,46

As reported in the Climate Science Special Report and summarized in Chapter 2: Climate, average annual temperature over the contiguous United States has increased by 1.2°F (0.7°C) for the period 1986–2016 relative to 1901–1960, and by 1.8°F (1.0°C) based on a linear regression for the period 1895–2016. Surface and satellite data are consistent in their depiction of rapid warming since 1979. Paleo-temperature evidence shows that recent decades are the warmest of the past 1,500 years. Additionally, contiguous U.S. average annual temperature is projected to rise. Increases of about 2.5°F (1.4°C) are projected for the next few decades in all emission scenarios, implying that recent record-setting years may be common in the near future. Much larger rises are projected by late century: 2.8°–7.3°F (1.6°–4.1°C) in a lower scenario (RCP4.5) and 5.8°–11.9°F (3.2°–6.6°C) in a higher scenario (RCP8.5).

Annual precipitation has decreased in much of the West, Southwest, and Southeast and increased in most of the Northern and Southern Great Plains, Midwest, and Northeast. There are important regional differences in trends, with the largest increases occurring in the northeastern United States. In particular, mesoscale convective systems (organized clusters of thunderstorms)—the main mechanism for warm season precipitation in the central part of the United States—have increased in occurrence and precipitation amounts since 1979 (see Easterling et al. 2017, Key Finding 135).

Heavy precipitation events in most parts of the United States have increased in both intensity and frequency since 1901 (see Easterling et al. 2017, Key Finding 235) and are projected to continue to increase over this century. There are, however, important regional and seasonal differences in projected changes in total precipitation: the northern United States, including Alaska, is projected to receive more precipitation in the winter and spring, and parts of the southwestern United States are projected to receive less precipitation in the winter and spring (see Easterling et al. 2017, Key Finding 335).

Projections indicate large declines in snowpack in the western United States and shifts to more precipitation falling as rain rather than snow in the cold season in many parts of the central and eastern United States (see Easterling et al. 2017, Key Finding 435).

The human effect on recent major U.S. droughts is complicated. Little evidence is found for a human influence on observed precipitation deficits, but much evidence is found for a human influence on surface soil moisture deficits due to increased evapotranspiration caused by higher temperatures (see Wehner et al. 2017, Key Finding 236).

Future decreases in surface (top 10 cm) soil moisture from anthropogenic forcing over most of the United States are likely as the climate warms under higher scenarios (see Wehner et al. 2017, Key Finding 336). Substantial reductions in western U.S. winter and spring snowpack are projected as the climate warms. Earlier spring melt and reduced snow water equivalent have been formally attributed to human-induced warming and will very likely be exacerbated as the climate continues to warm. Under higher scenarios, and assuming no change to current water resources management, chronic, long-duration hydrological drought is increasingly possible by the end of this century (see Wehner et al. 2017, Key Finding 436).

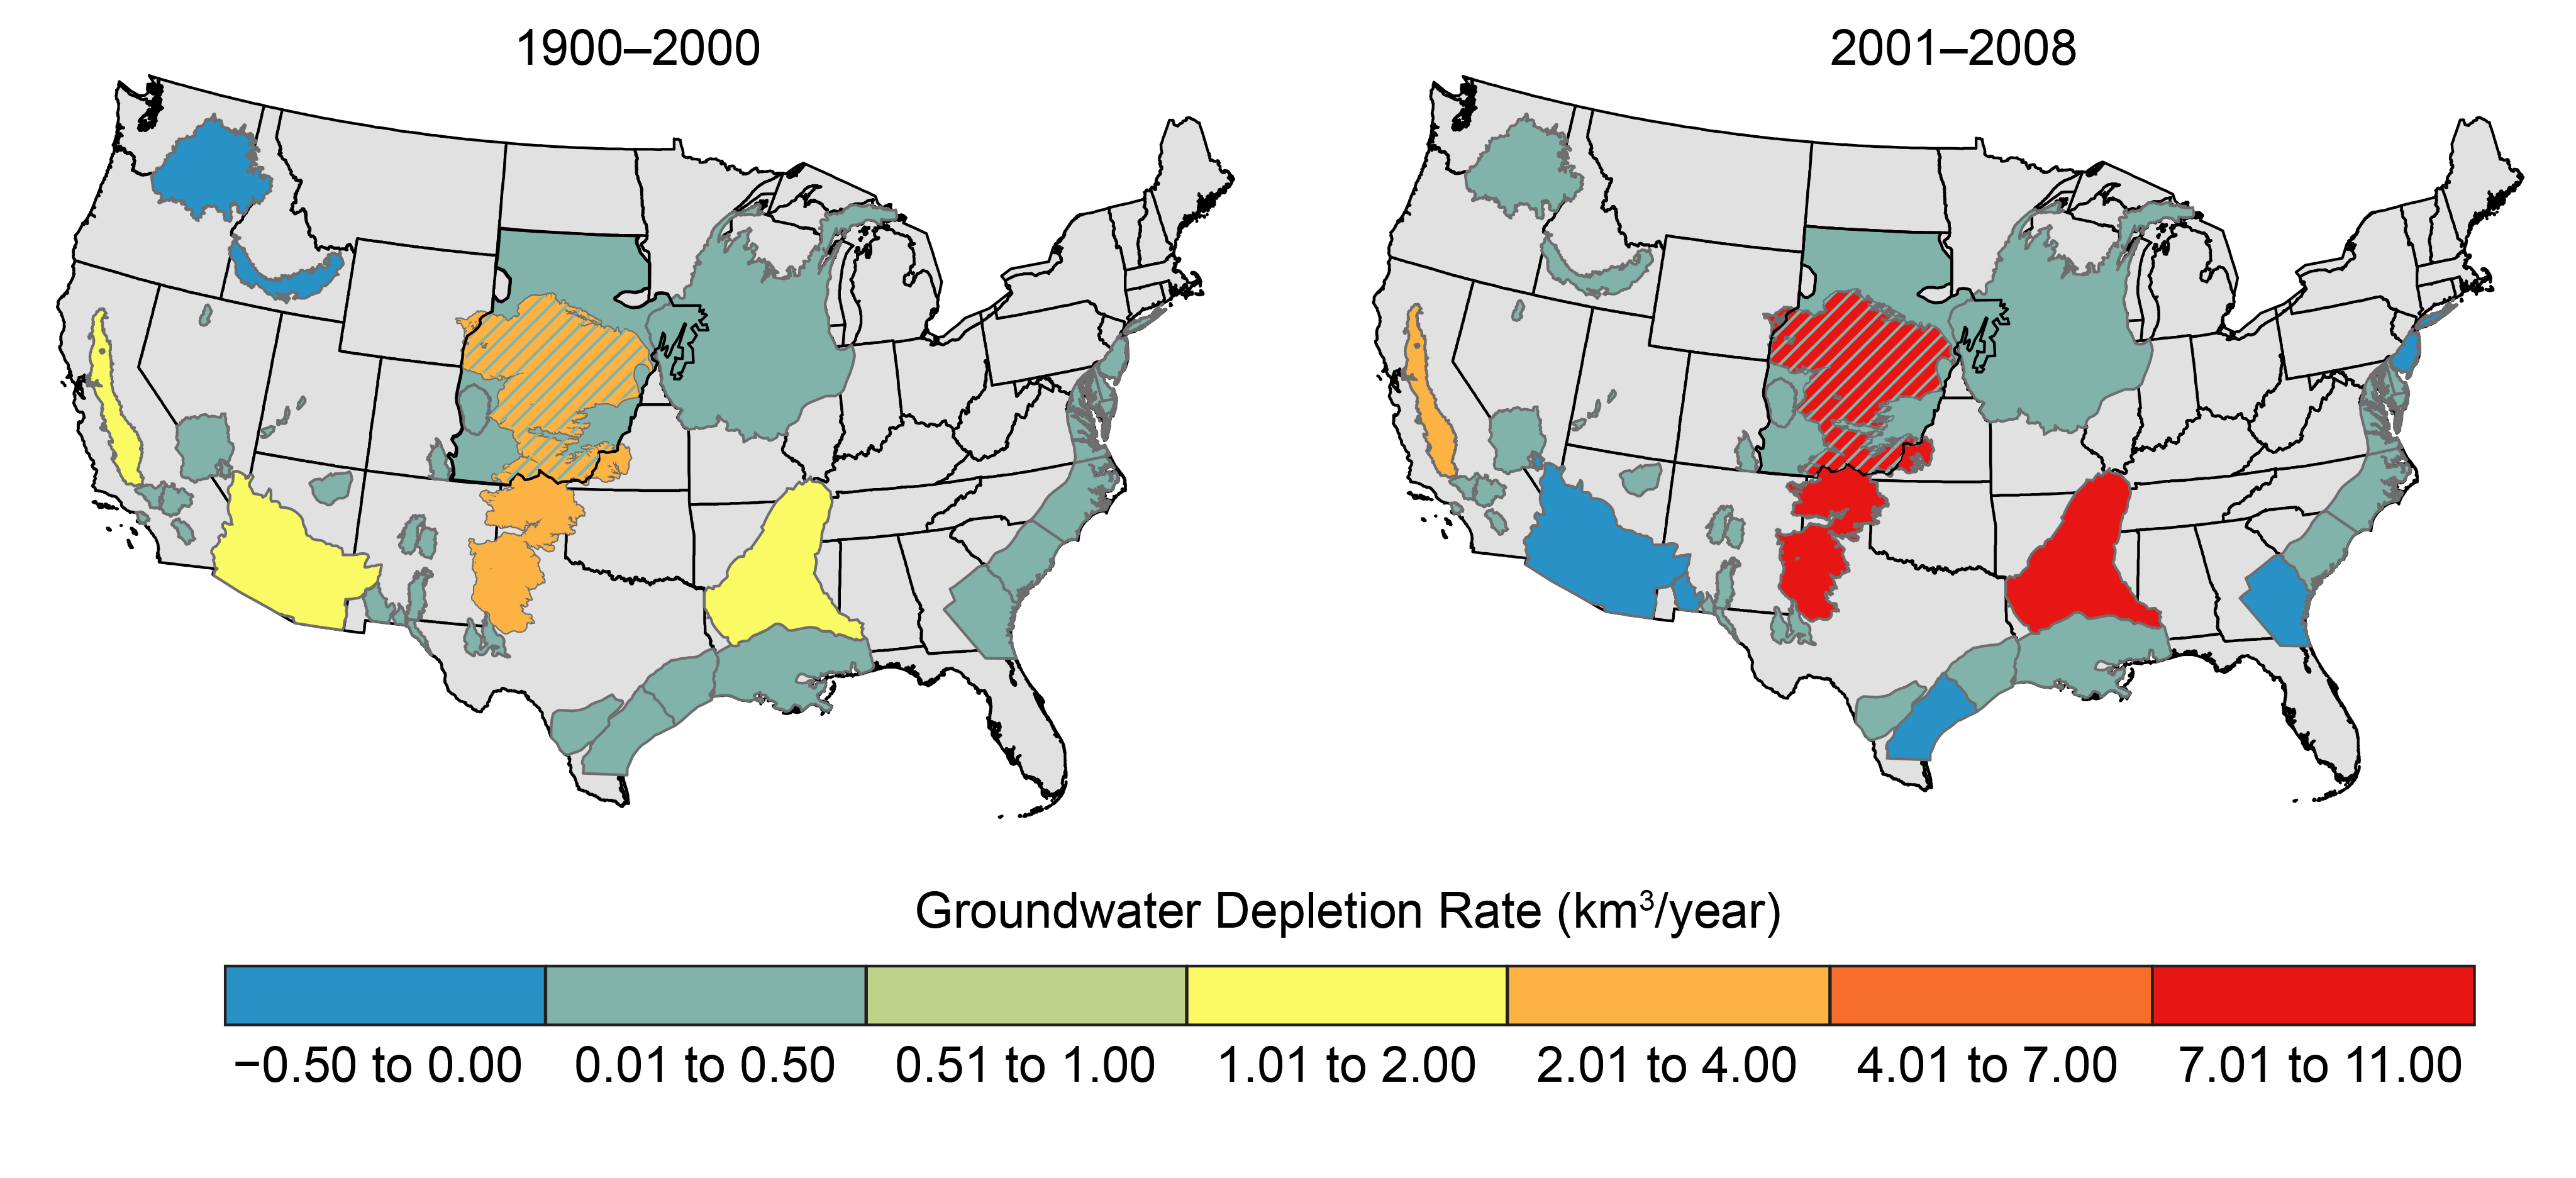
Even though national water withdrawal has remained steady irrespective of population growth,12 there is a significant spatiotemporal variability in water withdrawal (for example, a higher rate over the South) and water-use efficiency across the United States.13 Siebert et al. 201054 reported that irrigation use of groundwater has increased substantially over the past century and that groundwater use for irrigation in some areas has exceeded natural aquifer recharge rates.

Changes in air temperature and precipitation affect water quality in predictable ways. Attribution of water quality changes to climate change, however, is complicated by the multiple cascading, cumulative effects of climate change, land use, and other anthropogenic stressors on water quality. There has been a widespread increase in water temperatures across the United States.74,138 These trends are expected to continue in the future, with increased water temperatures likely across the country.76 Runoff from more frequent and intense precipitation events can increase the risk of pollutant loading as nutrients,69,70,71 sediment,66,67,68 and pathogens23,73 are transported from upland sources to water bodies. Pollutant loading is also strongly influenced by local watershed conditions (for example, land use, vegetative ground cover, pollutant sources). Increases in summer–fall water temperatures, excess nutrient loading events (driven by heavy precipitation events), and longer dry periods (associated with calm, quiescent water conditions) can expand the seasonal window for cyanobacteria and present an increased risk of bloom events.23,77

Figure 3.2 shows net, average volumetric rates of groundwater depletion (km3/year) in 40 assessed aquifer systems or subareas in the contiguous 48 states.4 Variation in rates of depletion in time and space within aquifers occurs but is not shown. For example, in the Nebraska part of the northern High Plains, small water-table rises occurred in parts of this area, and the net depletion was negligible. In contrast, in the Texas part of the southern High Plains, development of groundwater resources was more extensive, and the depletion rate averaged 1.6 km3/year.4

Major uncertainties

There is high uncertainty associated with projected scenarios, as they include many future decisions and actions that remain unknown. There also is high uncertainty with estimates of precipitation; this uncertainty is reflected in the wide range of climate model estimates of future precipitation. In contrast, because climate model simulations generally agree on the direction and general magnitude of future changes in temperature (given specific emission scenarios), there is a medium level of uncertainty associated with temperature projections. Overall, changes in land use are associated with a medium level of uncertainty. Even though there is low uncertainty regarding the expansion of urban areas, there is greater uncertainty regarding changes in agricultural land use. A medium level of uncertainty for water supply reflects a combination of high uncertainty in streamflow and low uncertainty in water demand. Uncertainty in water demand is low because of adaptation and increased water-use efficiency and because of water storage in reservoirs. Water storage capacity also reduces uncertainty in future groundwater conditions. Water temperature changes are relatively well understood, but other changes in water quality, particularly pollutant loads (such as nutrients, sediment, and pathogens), are associated with high uncertainty due to a combination of uncertain land-use changes and high uncertainty in streamflow and hydrologic processes. 

Description of confidence and likelihood

Increasing temperature is highly likely to result in early snowmelt and increased consumptive use. Uncertainty in precipitation and emission scenarios leads to low confidence in predicting water availability and the associated quality arising from changes in land-use scenarios. However, surface water and groundwater storage ensures medium confidence in water quantity and quality reliability, but spatial disparity in water efficiency could be better addressed through increased investment in water infrastructure for system maintenance.

Key Message 2: Deteriorating Water Infrastructure at Risk

Deteriorating water infrastructure compounds the climate risk faced by society (high confidence). Extreme precipitation events are projected to increase in a warming climate (high confidence) and may lead to more severe floods and greater risk of infrastructure failure in some regions (medium confidence). Infrastructure design, operation, financing principles, and regulatory standards typically do not account for a changing climate (high confidence). Current risk management does not typically consider the impact of compound extremes (co-occurrence of multiple events) and the risk of cascading infrastructure failure (high confidence).

Description of evidence base

Heavy precipitation events in most parts of the United States have increased in both intensity and frequency since about 1900 and are projected to continue to increase over this century, with important regional differences (Ch. 2: Climate).35,97 Detectable changes in some classes of flood frequency have occurred in parts of the United States and are a mix of increases and decreases (Ch. 2: Climate).6,139 However, formal attribution approaches have not established a significant connection of increased riverine flooding to human-induced climate change, and the timing of any emergence of a future detectable anthropogenic change in flooding is unclear (Ch. 2: Climate). There is considerable variation in the nature and direction of projected streamflow changes in U.S. rivers (Ch. 2: Climate).6,140

Infrastructure systems are typically sized to cope with extreme events expected to occur on average within a certain period of time in the future (for example, 25, 50, or 100 years), based on historical observations.141 There is substantial concern about the impacts of future changes in extremes on the existing infrastructure. However, the existing operational design and risk assessment frameworks (for example, rainfall intensity–duration–frequency, or IDF, curves and flood frequency curves) are based on the notion of time invariance (stationarity) in extremes.109,110

Variability in sea surface temperatures influences atmospheric circulation and subsequently affects the occurrence of regional wet and dry periods in the United States.142,143,144,145,146 Reconstructed streamflow data capture the extreme dry/wet periods beyond the instrumental record, but a limited literature has considered their application for water management.147,148

A number of models have been developed to incorporate the observed and/or projected changes in extremes in frequency analysis and risk assessment.94,103,104,105,149,150,151,152 The appropriateness of a fixed return period for IDF curves or for flood/drought frequency analysis is also questioned in the literature.7,14,134,153 This chapter has not evaluated the existing methods in the literature that account for temporal changes in extremes, and the issue warrants more investigation in the future.

Previous studies show that compound extreme events can have a multiplier effect on the risks to society, the environment, and built infrastructure.112,154 Current design frameworks ignore this issue and mainly rely on one variable at a time.92,154,155 For example, coastal flood risk assessment is primarily based on univariate methods that consider changes in terrestrial flooding and ocean flooding separately.108,109,111 Few studies have offered frameworks for considering multiple hazards for the design and risk assessment of infrastructure.112,154 Expected changes in the frequency of extreme events and their compounding effects can have significant consequences for existing infrastructure systems.

Major uncertainties

There are high uncertainties in future floods because of uncertainties in future long-term regional/local precipitation and uncertain changes in land use/land cover, water management, and other non-climatic factors that will interact with climate change to affect floods. There also are high uncertainties in future water supply estimates because of uncertainties in future precipitation. Drought increase due to combined precipitation and temperature change has a moderate uncertainty.

Description of confidence and likelihood

There is high confidence in the presence of a strong relationship between precipitation and temperature, indicating that changes in one will likely alter the statistics of the other and hence the likelihood of occurrence of extremes. The aging nature of the Nation’s water infrastructure is well documented. Not all aging infrastructure is deteriorating, however, and many aging projects are operating robustly under changing conditions. Unfortunately, no national assessment of deteriorating infrastructure or the fragility of infrastructure relative to aging exists. For example, the U.S. Army Corps of Engineers (USACE) has assessed how climate change projections with bias correction compare with the nominal design levels of USACE dams; however, this represents only a fraction of the Nation’s 88,000 dams. While age may be an imperfect proxy for deterioration, it is used here to call attention to the general concern that many elements of the Nation’s water infrastructure are likely not optimized to address changing climate conditions. There is high confidence that deteriorating water infrastructure (dams, levees, aqueducts, sewers, and water and wastewater treatment and distribution systems) compounds the climate risk faced by society.

Studies show that compound extreme events will likely have a multiplier effect on the risk to society, the environment, and built infrastructure. Sea level rise is expected to increase in a warming climate. Sea level rise adds to the height of future storm tides, reduces pressure gradients that are important for transporting fluvial water to the ocean, and enables greater upstream tide/wave propagation and coastal flooding.

There is high confidence in the existence of the interannual and decadal cycles but medium confidence in the ability to accurately simulate the joint effects of these cycles and anthropogenic climate change for water impacts.

Currently, coastal flood risk assessment is primarily based on univariate methods that consider changes in terrestrial flooding and ocean flooding separately, which may not reliably estimate the probability of interrelated compound extreme events. The expected changes in the frequency of extreme events and their compounding effects will likely have significant consequences for existing infrastructure systems. Because of the uncertainties in future precipitation and how extreme events compound each other, there is medium confidence in the effects of compound extremes (multiple extreme events) on infrastructure failure.

Key Message 3: Water Management in a Changing Future

Water management strategies designed in view of an evolving future we can only partially anticipate will help prepare the Nation for water- and climate-related risks of the future (medium confidence). Current water management and planning principles typically do not address risk that changes over time, leaving society exposed to more risk than anticipated (medium confidence). While there are examples of promising approaches to manage climate risk, the gap between research and implementation, especially in view of regulatory and institutional constraints, remains a challenge.

Description of evidence base

There is wide documentation in the scientific literature that water management practice and engineering design use the observed historical record as a guide to future expectations. This implies that significant departures from those expectations would pose greater-than-anticipated risks, and scenario analyses have demonstrated this to be the case, particularly in studies of large water supply systems. In particular, the Climate Science Special Report5 notes the potential for increased clustering (for example, heat waves and drought) or sequences of extremes and rapid transitions in climate. There is a growing literature that documents the use of robustness-based planning approaches, especially for water supply planning but also for coastal planning. These approaches provide promising methodologies for addressing climate change in water planning, although their complexity and cost—and limited planning resources—may be impediments to wide-scale adoption.

The literature also provides examples of some more innovative approaches applied to managing risks in an adaptive manner, including updating reservoir operations,116,126,156 employing financial instruments for risk transfer or financial risk management,123,157 and the use of adaptive management.117 However, the lack of broader-scale adoption and wider demonstration prevents more conclusive statements regarding the general utility of these approaches at this time.120

Major uncertainties

The key uncertainty in assessing the current state of preparation of the Nation’s water infrastructure and management for climate change is the lack of public data collected about key performance and risk parameters. This includes the state of water infrastructure, including dams, levees, distribution systems, storm water collection, and water and wastewater treatment systems. For some of these systems, current performance information may be available, but there is little knowledge of what future performance limitations may be. Furthermore, much of this information is not publicly available, although it may be collected by the many local and state agencies that operate these infrastructure systems. A large number of case studies have illustrated that observed and projected changes in climate could place systems at risk in ways that exceed current expectations.

Description of confidence and likelihood

The Key Message is stated with medium confidence due to the limited assessment that has been performed on water infrastructure systems and management regimes, and due to the nascent and limited assessment of proposed adaptive responses.

REFERENCES

  • 2017: Glacier Margin Time Series (1966, 1998, 2005, 2015) of the Named Glaciers of Glacier National Park, MT, USA. doi:10.5066/F7P26WB1. ↩
  • Abatzoglou, J. T., 2011: Influence of the PNA on declining mountain snowpack in the Western United States. International Journal of Climatology, 31 (8), 1135–1142. doi:10.1002/joc.2137. ↩
  • AghaKouchak, A., D. Feldman, M. Hoerling, T. Huxman, and J. Lund, 2015: Water and climate: Recognize anthropogenic drought. Nature, 524, 409–411. doi:10.1038/524409a. ↩
  • ASCE, 2017: 2017 Infrastructure Report Card: Dams. American Society of Civil Engineers (ASCE), Reston, VA, 6 pp. URL. ↩
  • ASCE, 2017: 2017 Infrastructure Report Card: Levees. American Society of Civil Engineers (ASCE), Reston, VA, 6 pp. URL. ↩
  • Asefa, T., A. Adams, and N. Wanakule, 2015: A level-of-service concept for planning future water supply projects under probabilistic demand and supply framework. JAWRA Journal of the American Water Resources Association, 51 (5), 1272–1285. doi:10.1111/1752-1688.12309. ↩
  • AWWA, 2012: Buried no longer: Confronting America's water infrastructure challenge. American Water Works Association, Denver, CO, 37 pp. URL. ↩
  • Bell, A., N. Matthews, and W. Zhang, 2016: Opportunities for improved promotion of ecosystem services in agriculture under the Water-Energy-Food Nexus. Journal of Environmental Studies and Sciences, 6 (1), 183–191. doi:10.1007/s13412-016-0366-9. ↩
  • Blanc, E., J. Caron, C. Fant, and E. Monier, 2017: Is current irrigation sustainable in the United States? An integrated assessment of climate change impact on water resources and irrigated crop yields. Earth's Future, 5 (8), 877–892. doi:10.1002/2016EF000473. ↩
  • Bonnin, G. M., K. Maitaria, and M. Yekta, 2011: Trends in rainfall exceedances in the observed record in selected areas of the United States. JAWRA Journal of the American Water Resources Association, 47 (6), 1173–1182. doi:10.1111/j.1752-1688.2011.00603.x. ↩
  • Brekke, L. D., J. E. Kiang, J. R. Olsen, R. S. Pulwarty, D. A. Raff, D. P. Turnipseed, R. S. Webb, and K. D. White, 2009: Climate change and water resources management: A federal perspective. U.S. Geological Survey Circular 1331. 978–1–4113–2325–4. U.S. Department of the Interior, U.S. Geological Survey, Reston, VA, 65 pp. URL. ↩
  • Brown, C., W. Werick, W. Leger, and D. Fay, 2011: A decision-analytic approach to managing climate risks: Application to the Upper Great Lakes. JAWRA Journal of the American Water Resources Association, 47 (3), 524–534. doi:10.1111/j.1752-1688.2011.00552.x. ↩
  • Chapra, S. C., B. Boehlert, C. Fant, V. J. Bierman, J. Henderson, D. Mills, D. M. L. Mas, L. Rennels, L. Jantarasami, J. Martinich, K. M. Strzepek, and H. W. Paerl, 2017: Climate change impacts on harmful algal blooms in U.S. freshwaters: A screening-level assessment. Environmental Science & Technology, 51 (16), 8933–8943. doi:10.1021/acs.est.7b01498. ↩
  • Cheng, L., A. AghaKouchak, E. Gilleland, and R. W. Katz, 2014: Non-stationary extreme value analysis in a changing climate. Climatic Change, 127 (2), 353–369. doi:10.1007/s10584-014-1254-5. ↩
  • Cheng, L., and A. AghaKouchak, 2014: Nonstationary precipitation intensity-duration-frequency curves for infrastructure design in a changing climate. Scientific Reports, 4, 7093. doi:10.1038/srep07093. ↩
  • Coffey, R., B. Benham, L.-A. Krometis, M. L. Wolfe, and E. Cummins, 2014: Assessing the effects of climate change on waterborne microorganisms: Implications for EU and U.S. water policy. Human and Ecological Risk Assessment: An International Journal, 20 (3), 724–742. doi:10.1080/10807039.2013.802583. ↩
  • Cook, B. I., E. R. Cook, K. J. Anchukaitis, R. Seager, and R. L. Miller, 2011: Forced and unforced variability of twentieth century North American droughts and pluvials. Climate Dynamics, 37 (5), 1097–1110. doi:10.1007/s00382-010-0897-9. ↩
  • Cook, E. R., P. J. Bartlein, N. Diffenbaugh, R. Seager, B. N. Shuman, R. S. Webb, J. W. Williams, and C. Woodhouse, 2008: Hydrological variability and change. Abrupt Climate Change. A Report by the U.S. Climate Change Science Program and the Subcommittee on Global Change Research., U.S. Geological Survey, Reston, VA, 67–115. URL. ↩
  • Crozier, L., 2016: Impacts of climate change on salmon of the Pacific Northwest: A review of the scientific literature published in 2015. NOAA, Northwest Fisheries Science Center, Seattle, WA, 32 pp. URL. ↩
  • Culley, S., S. Noble, A. Yates, M. Timbs, S. Westra, H. R. Maier, M. Giuliani, and A. Castelletti, 2016: A bottom‐up approach to identifying the maximum operational adaptive capacity of water resource systems to a changing climate. Water Resources Research, 52 (9), 6751–6768. doi:10.1002/2015WR018253. ↩
  • Dettinger, M. D., and D. R. Cayan, 1995: Large-scale atmospheric forcing of recent trends toward early snowmelt runoff in California. Journal of Climate, 8 (3), 606–623. doi:10.1175/1520-0442(1995)008<0606:LSAFOR>2.0.CO;2. ↩
  • Diffenbaugh, N. S., D. L. Swain, and D. Touma, 2015: Anthropogenic warming has increased drought risk in California. Proceedings of the National Academy of Sciences of the United States of America, 112 (13), 3931–3936. doi:10.1073/pnas.1422385112. ↩
  • Dittmer, K., 2013: Changing streamflow on Columbia basin tribal lands—Climate change and salmon. Climatic Change, 120 (3), 627–641. doi:10.1007/s10584-013-0745-0. ↩
  • Dudley, R. W., G. A. Hodgkins, M. R. McHale, M. J. Kolian, and B. Renard, 2017: Trends in snowmelt-related streamflow timing in the conterminous United States. Journal of Hydrology, 547, 208–221. doi:10.1016/j.jhydrol.2017.01.051. ↩
  • Döll, P., 2009: Vulnerability to the impact of climate change on renewable groundwater resources: A global-scale assessment. Environmental Research Letters, 4 (3), 035006. doi:10.1088/1748-9326/4/3/035006. ↩
  • Döll, P., B. Jiménez-Cisneros, T. Oki, N. W. Arnell, G. Benito, J. G. Cogley, T. Jiang, Z. W. Kundzewicz, S. Mwakalila, and A. Nishijima, 2015: Integrating risks of climate change into water management. Hydrological Sciences Journal, 60 (1), 4–13. doi:10.1080/02626667.2014.967250. ↩
  • Easterling, D. R., J. R. Arnold, T. Knutson, K. E. Kunkel, A. N. LeGrande, L. R. Leung, R. S. Vose, D. E. Waliser, and M. F. Wehner, 2017: Precipitation Change in the United States. Climate Science Special Report: Fourth National Climate Assessment, Volume I. Wuebbles, D. J., D. W. Fahey, K. A. Hibbard, D. J. Dokken, B. C. Stewart, and T. K. Maycock, Eds., U.S. Global Change Research Program, Washington, DC, USA, 207–230. doi:10.7930/J0H993CC. ↩
  • England, J. F., T. A. Cohn, B. A. Faber, J. R. Stedinger, W. O. Thomas Jr., A. G. Veilleux, J. E. Kiang, and R. R. Mason Jr., 2018: Guidelines for determining flood flow frequency: Bulletin 17C. U.S. Geological Survey, Reston, VA, various pp. doi:10.3133/tm4B5. ↩
  • EPA, 2013: Drinking Water Infrastructure Needs Survey and Assessment. Fifth report to Congress . EPA 816-R-13-006 . U.S. Environmental Protection Agency, Office of Water, Washington, DC, 70 pp. URL. ↩
  • EPA, 2016: Clean Watersheds Needs Survey 2012: Report to Congress. EPA-830-R-15005. EPA, Office of Wastewater Management, Washington, DC, various pp. URL. ↩
  • EPA, 2016: Climate Change Indicators in the United States, 2016. 4th edition. EPA 430-R-16-004. U.S. Environmental Protection Agency, Washington, D.C., 96 pp. URL. ↩
  • EPA, 2016: Climate Resilience Evaluation and Awareness Tool (CREAT): Version 3.0 Methodology Guide. EPA 815-B-16-004. U.S. Environmental Protection Agency (EPA), 43 pp. URL. ↩
  • EPA, 2017: EPA's Hurricane Maria Response [web story]. U.S. Environmental Protection Agency (EPA) Region 2, New York. URL. ↩
  • Fahey, D. W., S. Doherty, K. A. Hibbard, A. Romanou, and P. C. Taylor, 2017: Physical Drivers of Climate Change. Climate Science Special Report: Fourth National Climate Assessment, Volume I. Wuebbles, D. J., D. W. Fahey, K. A. Hibbard, D. J. Dokken, B. C. Stewart, and T. K. Maycock, Eds., U.S. Global Change Research Program, Washington, DC, USA, 73–113. doi:10.7930/J0513WCR. ↩
  • Fant, C., R. Srinivasan, B. Boehlert, L. Rennels, S. Chapra, K. Strzepek, J. Corona, A. Allen, and J. Martinich, 2017: Climate change impacts on US water quality using two models: HAWQS and US Basins. Water, 9 (2), 118. doi:10.3390/w9020118. ↩
  • FEMA, 2011: Identifying High Hazard Dam Risk in the United States [map]. Federal Emergency Management Agency, Washington, DC, 1 pp. URL. ↩
  • FEMA, 2015: Guidance for flood risk analysis and mapping: Combined coastal and riverine floodplain. Guidance Document 32. Federal Emergency Management Agency, Washington, DC, 6 pp. URL. ↩
  • FEMA, 2016: South Carolina Dam Failure Assessment and Advisement. FEMA P-1801. Federal Emergency Management Agency, Washington, DC, 64 pp. URL. ↩
  • Ferguson, G., and T. Gleeson, 2012: Vulnerability of coastal aquifers to groundwater use and climate change. Nature Climate Change, 2 (5), 342–345. doi:10.1038/nclimate1413. ↩
  • Ficklin, D. L., Y. Luo, and M. Zhang, 2013: Climate change sensitivity assessment of streamflow and agricultural pollutant transport in California's Central Valley using Latin hypercube sampling. Hydrological Processes, 27 (18), 2666–2675. doi:10.1002/hyp.9386. ↩
  • Georgakakos, A., P. Fleming, M. Dettinger, C. Peters-Lidard, Terese (T.C.) Richmond, K. Reckhow, K. White, and D. Yates, 2014: Ch. 3: Water Resources. Climate Change Impacts in the United States: The Third National Climate Assessment. Melillo, J. M., T. (T. C. . Richmond, and G. W. Yohe, Eds., U.S. Global Change Research Program, Washington, DC, 69–112. doi:10.7930/J0G44N6T. ↩
  • Gilroy, K., and A. Jeuken, 2018: Collaborative risk informed decision analysis: A water security case study in the Philippines. Climate Services, doi:10.1016/j.cliser.2018.04.002. ↩
  • Goode, J. R., C. H. Luce, and J. M. Buffington, 2012: Enhanced sediment delivery in a changing climate in semi-arid mountain basins: Implications for water resource management and aquatic habitat in the northern Rocky Mountains. Geomorphology, 139, 1–15. doi:10.1016/j.geomorph.2011.06.021. ↩
  • Goode, J. R., J. M. Buffington, D. Tonina, D. J. Isaak, R. F. Thurow, S. Wenger, D. Nagel, C. Luce, D. Tetzlaff, and C. Soulsby, 2013: Potential effects of climate change on streambed scour and risks to salmonid survival in snow-dominated mountain basins. Hydrological Processes, 27 (5), 750–765. doi:10.1002/hyp.9728. ↩
  • Grafton, R. Q., J. Horne, and S. A. Wheeler, 2016: On the marketisation of water: Evidence from the Murray-Darling Basin, Australia. Water Resources Management, 30 (3), 913–926. doi:10.1007/s11269-015-1199-0. ↩
  • Gray, S. T., S. T. Jackson, and J. L. Betancourt, 2004: Tree-ring based reconstructions of interannual to decadal scale precipitation variability for northeastern Utah since 1226 A.D. JAWRA Journal of the American Water Resources Association, 40 (4), 947–960. doi:10.1111/j.1752-1688.2004.tb01058.x. ↩
  • Halverson, J. B., and T. Rabenhorst, 2013: Hurricane Sandy: The science and impacts of a superstorm. Weatherwise, 66 (2), 14–23. doi:10.1080/00431672.2013.762838. ↩
  • Hamlet, A. F., P. W. Mote, M. P. Clark, and D. P. Lettenmaier, 2005: Effects of temperature and precipitation variability on snowpack trends in the western United States. Journal of Climate, 18 (21), 4545–4561. doi:10.1175/jcli3538.1. ↩
  • Hao, Z., A. AghaKouchak, and T. J. Phillips, 2013: Changes in concurrent monthly precipitation and temperature extremes. Environmental Research Letters, 8 (3), 034014. doi:10.1088/1748-9326/8/3/034014. ↩
  • Hill, R. A., C. P. Hawkins, and J. Jin, 2014: Predicting thermal vulnerability of stream and river ecosystems to climate change. Climatic Change, 125 (3), 399–412. doi:10.1007/s10584-014-1174-4. ↩
  • Hirsch, R. M., 2011: A perspective on nonstationarity and water management. JAWRA Journal of the American Water Resources Association, 47 (3), 436–446. doi:10.1111/j.1752-1688.2011.00539.x. ↩
  • Ho, M., U. Lall, M. Allaire, N. Devineni, H. H. Kwon, I. Pal, D. Raff, and D. Wegner, 2017: The future role of dams in the United States of America. Water Resources Research, 53 (2), 982–998. doi:10.1002/2016WR019905. ↩
  • Ho, M., U. Lall, X. Sun, and E. R. Cook, 2017: Multiscale temporal variability and regional patterns in 555 years of conterminous U.S. streamflow. Water Resources Research, 53 (4), 3047–3066. doi:10.1002/2016WR019632. ↩
  • Hoitink, A. J. F., and D. A. Jay, 2016: Tidal river dynamics: Implications for deltas. Reviews of Geophysics, 54 (1), 240–272. doi:10.1002/2015RG000507. ↩
  • Huntington, T. G., G. A. Hodgkins, B. D. Keim, and R. W. Dudley, 2004: Changes in the proportion of precipitation occurring as snow in New England (1949–2000). Journal of Climate, 17 (13), 2626–2636. doi:10.1175/1520-0442(2004)017<2626:citpop>2.0.co;2. ↩
  • IPCC, 2012: Managing the Risks of Extreme Events and Disasters to Advance Climate Change Adaptation. A Special Report of Working Groups I and II of the Intergovernmental Panel on Climate Change. Field, C. B., V. Barros, T. F. Stocker, D. Qin, D. J. Dokken, K. L. Ebi, M. D. Mastrandrea, K. J. Mach, G.-K. Plattner, S. K. Allen, M. Tignor, and P. M. Midgley, Eds. Cambridge University Press, Cambridge, UK and New York, NY, USA, 582 pp. URL. ↩
  • Isaak, D. J., S. Wollrab, D. Horan, and G. Chandler, 2012: Climate change effects on stream and river temperatures across the northwest US from 1980–2009 and implications for salmonid fishes. Climatic Change, 113 (2), 499–524. doi:10.1007/s10584-011-0326-z. ↩
  • IUGLSB, 2012: Lake Superior Regulation:  Addressing Uncertainty in Upper Great Lakes Water Levels. Final Report to the International Joint Commission. March 2012. International Upper Great Lakes Study Board, Ottawa, ON , 236 pp. URL. ↩
  • Jain, S., and U. Lall, 2001: Floods in a changing climate: Does the past represent the future? Water Resources Research, 37 (12), 3193–3205. doi:10.1029/2001WR000495. ↩
  • Jakob, D., 2013: Nonstationarity in extremes and engineering design. Extremes in a Changing Climate: Detection, Analysis and Uncertainty. AghaKouchak, A., D. Easterling, K. Hsu, S. Schubert, and S. Sorooshian, Eds., Springer, Dordrecht, 363–417. ↩
  • Jastram, J. D., and K. C. Rice, 2015: Air- and stream-water-temperature trends in the Chesapeake Bay region, 1960-2014. Open-File Report 2015-1207. U. S. Geological Survey, Reston, VA, 35 pp. doi:10.3133/ofr20151207. ↩
  • Johnson, T., J. Butcher, D. Deb, M. Faizullabhoy, P. Hummel, J. Kittle, S. McGinnis, L. O. Mearns, D. Nover, A. Parker, S. Sarkar, R. Srinivasan, P. Tuppad, M. Warren, C. Weaver, and J. Witt, 2015: Modeling streamflow and water quality sensitivity to climate change and urban development in 20 U.S. watersheds. JAWRA Journal of the American Water Resources Association, 51 (5), 1321–1341. doi:10.1111/1752-1688.12308. ↩
  • Katz, R. W., 2010: Statistics of extremes in climate change. Climatic Change, 100 (1), 71–76. doi:10.1007/s10584-010-9834-5. ↩
  • Katz, R. W., M. B. Parlange, and P. Naveau, 2002: Statistics of extremes in hydrology. Advances in Water Resources, 25 (8), 1287–1304. doi:10.1016/S0309-1708(02)00056-8. ↩
  • Kaushal, S. S., G. E. Likens, N. A. Jaworski, M. L. Pace, A. M. Sides, D. Seekell, K. T. Belt, D. H. Secor, and R. L. Wingate, 2010: Rising stream and river temperatures in the United States. Frontiers in Ecology and the Environment, 8 (9), 461–466. doi:10.1890/090037. ↩
  • Kaushal, S. S., P. M. Groffman, L. E. Band, C. A. Shields, R. P. Morgan, M. A. Palmer, K. T. Belt, C. M. Swan, S. E. G. Findlay, and G. T. Fisher, 2008: Interaction between urbanization and climate variability amplifies watershed nitrate export in Maryland. Environmental Science & Technology, 42 (16), 5872–5878. doi:10.1021/es800264f. ↩
  • Kirwan, M. L., and J. P. Megonigal, 2013: Tidal wetland stability in the face of human impacts and sea-level rise. Nature, 504 (7478), 53–60. doi:10.1038/nature12856. ↩
  • Kløve, B., P. Ala-Aho, G. Bertrand, J. J. Gurdak, H. Kupfersberger, J. Kværner, T. Muotka, H. Mykrä, E. Preda, P. Rossi, C. B. Uvo, E. Velasco, and M. Pulido-Velazquez, 2014: Climate change impacts on groundwater and dependent ecosystems. Journal of Hydrology, 518 (Part B), 250–266. doi:10.1016/j.jhydrol.2013.06.037. ↩
  • Knowles, N., M. D. Dettinger, and D. R. Cayan, 2006: Trends in snowfall versus rainfall in the western United States. Journal of Climate, 19 (18), 4545–4559. doi:10.1175/JCLI3850.1. ↩
  • Kolb, C., M. Pozzi, C. Samaras, and J. M. VanBriesen, 2017: Climate change impacts on bromide, trihalomethane formation, and health risks at coastal groundwater utilities. ASCE-ASME Journal of Risk and Uncertainty in Engineering Systems, Part A: Civil Engineering, 3 (3), 04017006. doi:10.1061/AJRUA6.0000904. ↩
  • Kolesar, P., and J. Serio, 2011: Breaking the deadlock: Improving water-release policies on the Delaware River through operations research. Interfaces, 41 (1), 18–34. doi:10.1287/inte.1100.0536. ↩
  • Konikow, L. F., 2013: Groundwater Depletion in the United States (1900–2008). Scientific Investigations Report 2013−5079. U. S. Geological Survey, Reston, VA, 63 pp. URL. ↩
  • Konikow, L. F., 2015: Long‐term groundwater depletion in the United States. Groundwater, 53 (1), 2–9. doi:10.1111/gwat.12306. ↩
  • Kunkel, K. E., M. Palecki, L. Ensor, K. G. Hubbard, D. Robinson, K. Redmond, and D. Easterling, 2009: Trends in twentieth-century US snowfall using a quality-controlled dataset. Journal of Atmospheric and Oceanic Technology, 26, 33–44. doi:10.1175/2008JTECHA1138.1. ↩
  • Kunkel, K. E., T. R. Karl, H. Brooks, J. Kossin, J. Lawrimore, D. Arndt, L. Bosart, D. Changnon, S. L. Cutter, N. Doesken, K. Emanuel, P. Y. Groisman, R. W. Katz, T. Knutson, J. O'Brien, C. J. Paciorek, T. C. Peterson, K. Redmond, D. Robinson, J. Trapp, R. Vose, S. Weaver, M. Wehner, K. Wolter, and D. Wuebbles, 2013: Monitoring and understanding trends in extreme storms: State of knowledge. Bulletin of the American Meteorological Society, 94 (4), 499–514. doi:10.1175/BAMS-D-11-00262.1. ↩
  • Kwon, H.-H., U. Lall, and A. F. Khalil, 2007: Stochastic simulation model for nonstationary time series using an autoregressive wavelet decomposition: Applications to rainfall and temperature. Water Resources Research, 43 (5), W05407. doi:10.1029/2006WR005258. ↩
  • Larsen, C. F., E. Burgess, A. A. Arendt, S. O'Neel, A. J. Johnson, and C. Kienholz, 2015: Surface melt dominates Alaska glacier mass balance. Geophysical Research Letters, 42 (14), 5902–5908. doi:10.1002/2015GL064349. ↩
  • Lima, C. H. R., and U. Lall, 2010: Spatial scaling in a changing climate: A hierarchical Bayesian model for non-stationary multi-site annual maximum and monthly streamflow. Journal of Hydrology, 383 (3), 307–318. doi:10.1016/j.jhydrol.2009.12.045. ↩
  • Loáiciga, H. A., 2009: Long-term climatic change and sustainable ground water resources management. Environmental Research Letters, 4 (3), 035004. doi:10.1088/1748-9326/4/3/035004. ↩
  • Lu, M., U. Lall, A. W. Robertson, and E. Cook, 2017: Optimizing multiple reliable forward contracts for reservoir allocation using multitime scale streamflow forecasts. Water Resources Research, 53 (3), 2035–2050. doi:10.1002/2016WR019552. ↩
  • Luke, A., J. A. Vrugt, A. AghaKouchak, R. Matthew, and B. F. Sanders, 2017: Predicting nonstationary flood frequencies: Evidence supports an updated stationarity thesis in the United States. Water Resources Research, 53 (7), 5469–5494. doi:10.1002/2016WR019676. ↩
  • Maupin, M. A., J. F. Kenny, S. S. Hutson, J. K. Lovelace, N. L. Barber, and Kristin S. Linsey, 2014: Estimated Use of Water in the United States in 2010. USGC Circular 1405. U.S. Geological Survey, Reston, VA, 56 pp. doi:10.3133/cir1405. ↩
  • Mazdiyasni, O., and A. AghaKouchak, 2015: Substantial increase in concurrent droughts and heatwaves in the United States. Proceedings of the National Academy of Sciences of the United States of America, 112 (37), 11484–11489. doi:10.1073/pnas.1422945112. ↩
  • McCabe, G. J., and D. M. Wolock, 2016: Variability and Trends in Runoff Efficiency in the Conterminous United States. JAWRA Journal of the American Water Resources Association, 52 (5), 1046–1055. doi:10.1111/1752-1688.12431. ↩
  • McCabe, G. J., and M. P. Clark, 2005: Trends and variability in snowmelt runoff in the western United States. Journal of Hydrometeorology, 6 (4), 476–482. doi:10.1175/jhm428.1. ↩
  • McCabe, G. J., M. A. Palecki, and J. L. Betancourt, 2004: Pacific and Atlantic Ocean influences on multidecadal drought frequency in the United States. Proceedings of the National Academy of Sciences of the United States of America, 101 (12), 4136–4141. doi:10.1073/pnas.0306738101. ↩
  • McDonald, C., 2017: Oroville Dam highlights infrastructure risks. Risk Management, 64 (3), 6–9. URL. ↩
  • McDonald, R. I., and E. H. Girvetz, 2013: Two challenges for U.S. irrigation due to climate change: Increasing irrigated area in wet states and increasing irrigation rates in dry states. PLOS ONE, 8 (6), e65589. doi:10.1371/journal.pone.0065589. ↩
  • McGuire, V. L., 2017: Water-level and recoverable water in storage changes, High Plains aquifer, predevelopment to 2015 and 2013–15. 2017-5040. Scientific Investigations Report 2017-5040. U. S. Geological Survey, Reston, VA, 24 pp. doi:10.3133/sir20175040. ↩
  • Mehran, A., A. AghaKouchak, N. Nakhjiri, M. J. Stewardson, M. C. Peel, T. J. Phillips, Y. Wada, and J. K. Ravalico, 2017: Compounding impacts of human-induced water stress and climate change on water availability. Scientific Reports, 7 (1), 6282. doi:10.1038/s41598-017-06765-0. ↩
  • Michalak, A. M., E. J. Anderson, D. Beletsky, S. Boland, N. S. Bosch, T. B. Bridgeman, J. D. Chaffin, K. Cho, R. Confesor, I. Daloğlu, J. V. DePinto, M. A. Evans, G. L. Fahnenstiel, L. He, J. C. Ho, L. Jenkins, T. H. Johengen, K. C. Kuo, E. LaPorte, X. Liu, M. R. McWilliams, M. R. Moore, D. J. Posselt, R. P. Richards, D. Scavia, A. L. Steiner, E. Verhamme, D. M. Wright, and M. A. Zagorski, 2013: Record-setting algal bloom in Lake Erie caused by agricultural and meteorological trends consistent with expected future conditions. Proceedings of the National Academy of Sciences of the United States of America, 110 (16), 6448–6452. doi:10.1073/pnas.1216006110. ↩
  • Michelsen, A. M., and R. A. Young, 1993: Optioning agricultural water rights for urban water supplies during drought. American Journal of Agricultural Economics, 75 (4), 1010–1020. doi:10.2307/1243988. ↩
  • Moftakhari, H. R., G. Salvadori, A. AghaKouchak, B. F. Sanders, and R. A. Matthew, 2017: Compounding effects of sea level rise and fluvial flooding. Proceedings of the National Academy of Sciences of the United States of America, 114 (37), 9785–9790. doi:10.1073/pnas.1620325114. ↩
  • Mote, P. W., A. F. Hamlet, M. P. Clark, and D. P. Lettenmaier, 2005: Declining mountain snowpack in western North America. Bulletin of the American Meteorological Society, 86 (1), 39–49. doi:10.1175/BAMS-86-1-39. ↩
  • Mote, P., A. K. Snover, S. Capalbo, S. D. Eigenbrode, P. Glick, J. Littell, R. Raymondi, and S. Reeder, 2014: Ch. 21: Northwest. Climate Change Impacts in the United States: The Third National Climate Assessment. Melillo, J. M., T. (T. C. . Richmond, and G. W. Yohe, Eds., U.S. Global Change Research Program, Washington, DC, 487–513. doi:10.7930/J04Q7RWX. ↩
  • Mulroy, P., 2017: Water Problem: Climate Change and Water Policy in the United States. The Brookings Institution, Washington, DC,. ↩
  • National Academy of Engineering, and National Research Council, 2006: Structural Performance of the New Orleans Hurricane Protection System During Hurricane Katrina. The National Academies Press, Washington, DC, doi:10.17226/11591. ↩
  • National Research Council, 2012: Dam and Levee Safety and Community Resilience: A Vision for Future Practice. The National Academies Press, Washington, DC, doi:10.17226/13393. ↩
  • Nearing, M., F. F. Pruski, and M. R. O'Neal, 2004: Expected climate change impacts on soil erosion rates: A review. Journal of Soil and Water Conservation, 59 (1), 43–50. URL. ↩
  • Neumann, J. E., J. Price, P. Chinowsky, L. Wright, L. Ludwig, R. Streeter, R. Jones, J. B. Smith, W. Perkins, L. Jantarasami, and J. Martinich, 2015: Climate change risks to US infrastructure: Impacts on roads, bridges, coastal development, and urban drainage. Climatic Change, 131 (1), 97–109. doi:10.1007/s10584-013-1037-4. ↩
  • NOAA NCEI, 2018: Billion-Dollar Weather and Climate Disasters [web page]. NOAA National Centers for Environmental Information, Asheville, NC. URL. ↩
  • NWS, 2017: Major Hurricane Maria - September 20, 2017. NOAA National Weather Service (NWS), San Juan, PR. URL. ↩
  • Olsen, J. R., Ed., 2015: Adapting Infrastructure and Civil Engineering Practice to a Changing Climate. Reston, VA, 93 pp. doi:10.1061/9780784479193. ↩
  • Paerl, H. W., and J. Huisman, 2008: CLIMATE: Blooms like it hot. Science, 320 (5872), 57–58. doi:10.1126/Science.1155398. ↩
  • Patskoski, J., A. Sankarasubramanian, and H. Wang, 2015: Reconstructed streamflow using SST and tree-ring chronologies over the southeastern United States. Journal of Hydrology, 527, 761–775. doi:10.1016/j.jhydrol.2015.05.041. ↩
  • Patskoski, J., and A. Sankarasubramanian, 2015: Improved reservoir sizing utilizing observed and reconstructed streamflows within a Bayesian combination framework. Water Resources Research, 51 (7), 5677–5697. doi:10.1002/2014WR016189. ↩
  • Peterson, T. C., R. R. Heim, R. Hirsch, D. P. Kaiser, H. Brooks, N. S. Diffenbaugh, R. M. Dole, J. P. Giovannettone, K. Guirguis, T. R. Karl, R. W. Katz, K. Kunkel, D. Lettenmaier, G. J. McCabe, C. J. Paciorek, K. R. Ryberg, S. Schubert, V. B. S. Silva, B. C. Stewart, A. V. Vecchia, G. Villarini, R. S. Vose, J. Walsh, M. Wehner, D. Wolock, K. Wolter, C. A. Woodhouse, and D. Wuebbles, 2013: Monitoring and understanding changes in heat waves, cold waves, floods and droughts in the United States: State of knowledge. Bulletin of the American Meteorological Society, 94 (6), 821–834. doi:10.1175/BAMS-D-12-00066.1. ↩
  • Peterson, T. C., T. R. Karl, J. P. Kossin, K. E. Kunkel, J. H. Lawrimore, J. R. McMahon, R. S. Vose, and X. Yin, 2014: Changes in weather and climate extremes: State of knowledge relevant to air and water quality in the United States. Journal of the Air & Waste Management Association, 64 (2), 184–197. doi:10.1080/10962247.2013.851044. ↩
  • Poff, N. L., C. M. Brown, T. E. Grantham, J. H. Matthews, M. A. Palmer, C. M. Spence, R. L. Wilby, M. Haasnoot, G. F. Mendoza, K. C. Dominique, and A. Baeza, 2016: Sustainable water management under future uncertainty with eco-engineering decision scaling. Nature Climate Change, 6, 25–34. doi:10.1038/nclimate2765. ↩
  • Prairie, J., K. Nowak, B. Rajagopalan, U. Lall, and T. Fulp, 2008: A stochastic nonparametric approach for streamflow generation combining observational and paleoreconstructed data. Water Resources Research, 44 (6), W06423. doi:10.1029/2007WR006684. ↩
  • Pulwarty, R. S., and R. Maia, 2015: Adaptation challenges in complex rivers around the world: The Guadiana and the Colorado Basins. Water Resources Management, 29 (2), 273–293. doi:10.1007/s11269-014-0885-7. ↩
  • Ragno, E., A. AghaKouchak, C. A. Love, L. Cheng, F. Vahedifard, and C. H. R. Lima, 2018: Quantifying changes in future intensity‐duration‐frequency curves using multimodel ensemble simulations. Water Resources Research, 54 (3), 1751–1764. doi:10.1002/2017WR021975. ↩
  • Ray, P. A., and C. M. Brown, 2015: Confronting Climate Uncertainty in Water Resources Planning and Project Design: The Decision Tree Framework. World Bank Group, Washington, DC, 125 pp. doi:10.1596/978-1-4648-0477-9. ↩
  • Reclamation, 2012: Colorado River Basin Water Supply and Demand Study. Study Report. December 2012. Prepared by the Colorado River Basin Water Supply and Demand Study Team. U.S Department of the Interior, Bureau of Reclamation, Denver, CO, 95 pp. URL. ↩
  • Redmond, K. T., and R. W. Koch, 1991: Surface climate and streamflow variability in the western United States and their relationship to large-scale circulation indices. Water Resources Research, 27 (9), 2381–2399. doi:10.1029/91WR00690. ↩
  • Regonda, S. K., B. Rajagopalan, M. Clark, and J. Pitlick, 2005: Seasonal cycle shifts in hydroclimatology over the western United States. Journal of Climate, 18 (2), 372–384. doi:10.1175/JCLI-3272.1. ↩
  • Rheinheimer, D. E., S. E. Null, and J. R. Lund, 2015: Optimizing selective withdrawal from reservoirs to manage downstream temperatures with climate warming. Journal of Water Resources Planning and Management, 141 (4), 04014063. doi:10.1061/(ASCE)WR.1943-5452.0000447. ↩
  • Rice, K. C., B. Hong, and J. Shen, 2012: Assessment of salinity intrusion in the James and Chickahominy Rivers as a result of simulated sea-level rise in Chesapeake Bay, East Coast, USA. Journal of Environmental Management, 111, 61–69. doi:10.1016/j.jenvman.2012.06.036. ↩
  • Riedel, J. L., S. Wilson, W. Baccus, M. Larrabee, T. J. Fudge, and A. Fountain, 2015: Glacier status and contribution to streamflow in the Olympic Mountains, Washington, USA. Journal of Glaciology, 61 (225), 8–16. doi:10.3189/2015JoG14J138. ↩
  • Rosner, A., R. M. Vogel, and P. H. Kirshen, 2014: A risk‐based approach to flood management decisions in a nonstationary world. Water Resources Research, 50 (3), 1928–1942. doi:10.1002/2013WR014561. ↩
  • Russo, T. A., and U. Lall, 2017: Depletion and response of deep groundwater to climate-induced pumping variability. Nature Geoscience, 10 (2), 105–108. doi:10.1038/ngeo2883. ↩
  • Salas, J. D., and J. Obeysekera, 2014: Revisiting the Concepts of Return Period and Risk for Nonstationary Hydrologic Extreme Events. Journal of Hydrologic Engineering, 19 (3), 554–568. doi:10.1061/(ASCE)HE.1943-5584.0000820. ↩
  • Sankarasubramanian, A., J. L. Sabo, K. L. Larson, S. B. Seo, T. Sinha, R. Bhowmik, A. R. Vidal, K. Kunkel, G. Mahinthakumar, E. Z. Berglund, and J. Kominoski, 2017: Synthesis of public water supply use in the United States: Spatio-temporal patterns and socio-economic controls. Earth's Future, 5 (7), 771–788. doi:10.1002/2016EF000511. ↩
  • Sankarasubramanian, A., U. Lall, F. A. Souza Filho, and A. Sharma, 2009: Improved water allocation utilizing probabilistic climate forecasts: Short‐term water contracts in a risk management framework. Water Resources Research, 45 (11) doi:10.1029/2009WR007821. ↩
  • Scanlon, B. R., C. C. Faunt, L. Longuevergne, R. C. Reedy, W. M. Alley, V. L. McGuire, and P. B. McMahon, 2012: Groundwater depletion and sustainability of irrigation in the US High Plains and Central Valley. Proceedings of the National Academy of Sciences of the United States of America, 109 (24), 9320–9325. doi:10.1073/pnas.1200311109. ↩
  • Scanlon, B. R., R. C. Reedy, J. B. Gates, and P. H. Gowda, 2010: Impact of agroecosystems on groundwater resources in the Central High Plains, USA. Agriculture, Ecosystems & Environment, 139 (4), 700–713. doi:10.1016/j.agee.2010.10.017. ↩
  • Shukla, S., A. Steinemann, S. F. Iacobellis, and D. R. Cayan, 2015: Annual drought in California: Association with monthly precipitation and climate phases. Journal of Applied Meteorology and Climatology, 54 (11), 2273–2281. doi:10.1175/jamc-d-15-0167.1. ↩
  • Siebert, S., J. Burke, J. M. Faures, K. Frenken, J. Hoogeveen, P. Döll, and F. T. Portmann, 2010: Groundwater use for irrigation—A global inventory. Hydrology and Earth System Sciences, 14 (10), 1863–1880. doi:10.5194/hess-14-1863-2010. ↩
  • Sinha, E., A. M. Michalak, and V. Balaji, 2017: Eutrophication will increase during the 21st century as a result of precipitation changes. Science, 357 (6349), 405–408. doi:10.1126/science.aan2409. ↩
  • Skahill, B. E., A. AghaKouchak, L. Cheng, A. Byrd, and J. Kanney, 2016: Bayesian inference of nonstationary precipitation intensity-duration-frequency curves for infrastructure design. ERDC/CHL CHETN-X-2. Army Engineer Research and Development Center, Vicksburg, MS, 20 pp. URL. ↩
  • Spence, C. M., and C. M. Brown, 2016: Nonstationary decision model for flood risk decision scaling. Water Resources Research, 52 (11), 8650–8667. doi:10.1002/2016WR018981. ↩
  • Stedinger, J. R., and V. W. Griffis, 2011: Getting from here to where? Flood frequency analysis and climate. JAWRA Journal of the American Water Resources Association, 47 (3), 506–513. doi:10.1111/j.1752-1688.2011.00545.x. ↩
  • Steinschneider, S., M. Ho, E. R. Cook, and U. Lall, 2016: Can PDSI inform extreme precipitation?: An exploration with a 500 year long paleoclimate reconstruction over the U.S. Water Resources Research, 52 (5), 3866–3880. doi:10.1002/2016WR018712. ↩
  • Stewart, I. T., D. R. Cayan, and M. D. Dettinger, 2004: Changes in snowmelt runoff timing in western North America under a “business as usual” climate change scenario. Climatic Change, 62 (1), 217–232. doi:10.1023/B:CLIM.0000013702.22656.e8. ↩
  • Stratus Consulting and Denver Water, 2015: Embracing uncertainty: A case study examination of how climate change is shifting water utility planning. Prepared for the Water Utility Climate Alliance (WUCA), the American Water Works Association (AWWA), the Water Research Foundation (WRF), and the Association of Metropolitan Water Agencies (AMWA) by Stratus Consulting Inc., Boulder, CO (Karen Raucher and Robert Raucher) and Denver Water, Denver, CO (Laurna Kaatz). Stratus Consulting, Boulder, CO, various pp. URL. ↩
  • Sun, Q., C. Miao, A. AghaKouchak, and Q. Duan, 2016: Century-scale causal relationships between global dry/wet conditions and the state of the Pacific and Atlantic Oceans. Geophysical Research Letters, 43 (12), 6528–6537. doi:10.1002/2016GL069628. ↩
  • Traynham, M. S., Dam safety in South Carolina. In 2017 South Carolina Bar Convention: Environment & Natural Resources Section/Administrative & Regulatory Law Committee Seminar, 27. URL. ↩
  • Trtanj, J., L. Jantarasami, J. Brunkard, T. Collier, J. Jacobs, E. Lipp, S. McLellan, S. Moore, H. Paerl, J. Ravenscroft, M. Sengco, and J. Thurston, 2016: Ch. 6: Climate impacts on water-related illness. The Impacts of Climate Change on Human Health in the United States: A Scientific Assessment., U.S. Global Change Research Program, Washington, DC, 157–188. doi:10.7930/J03F4MH4. ↩
  • Udall, B., and J. Overpeck, 2017: The twenty-first century Colorado River hot drought and implications for the future. Water Resources Research, 53 (3), 2404–2418. doi:10.1002/2016WR019638. ↩
  • USGCRP, 2017: Climate Science Special Report: Fourth National Climate Assessment, Volume I. Wuebbles, D. J., D. W. Fahey, K. A. Hibbard, D. J. Dokken, B. C. Stewart, and T. K. Maycock, Eds. U.S. Global Change Research Program, Washington, DC, USA, 470 pp. doi:10.7930/J0J964J6. ↩
  • USGS, 1982: Guidelines for determining flood flow frequency: Bulletin 17B. U.S. Geological Survey, Reston, VA, various pp. URL. ↩
  • Vahedifard, F., A. AghaKouchak, and J. D. Robinson, 2015: Drought threatens California's levees. Science, 349 (6250), 799–799. doi:10.1126/science.349.6250.799-a. ↩
  • Vahedifard, F., A. AghaKouchak, and N. H. Jafari, 2016: Compound hazards yield Louisiana flood. Science, 353 (6306), 1374–1374. doi:10.1126/science.aai8579. ↩
  • Vahedifard, F., F. S. Tehrani, V. Galavi, E. Ragno, and A. AghaKouchak, 2017: Resilience of MSE walls with marginal backfill under a changing climate: Quantitative assessment for extreme precipitation events. Journal of Geotechnical and Geoenvironmental Engineering, 143 (9), 04017056. doi:10.1061/(ASCE)GT.1943-5606.0001743. ↩
  • Vahedifard, F., J. D. Robinson, and A. AghaKouchak, 2016: Can protracted drought undermine the structural integrity of California's earthen levees? Journal of Geotechnical and Geoenvironmental Engineering, 142 (6), 02516001. doi:10.1061/(ASCE)GT.1943-5606.0001465. ↩
  • Vano, J. A., B. Udall, D. R. Cayan, J. T. Overpeck, L. D. Brekke, T. Das, H. C. Hartmann, H. G. Hidalgo, M. Hoerling, G. J. McCabe, K. Morino, R. S. Webb, K. Werner, and D. P. Lettenmaier, 2014: Understanding uncertainties in future Colorado River streamflow. Bulletin of the American Meteorological Society, 95 (1), 59–78. doi:10.1175/bams-d-12-00228.1. ↩
  • Wahl, T., S. Jain, J. Bender, S. D. Meyers, and M. E. Luther, 2015: Increasing risk of compound flooding from storm surge and rainfall for major US cities. Nature Climate Change, 5 (12), 1093–1097. doi:10.1038/nclimate2736. ↩
  • Ward, M. N., C. M. Brown, K. M. Baroang, and Y. H. Kaheil, 2013: Reservoir performance and dynamic management under plausible assumptions of future climate over seasons to decades. Climatic Change, 118 (2), 307–320. doi:10.1007/s10584-012-0616-0. ↩
  • Wehner, M. F., J. R. Arnold, T. Knutson, K. E. Kunkel, and A. N. LeGrande, 2017: Droughts, Floods, and Wildfires. Climate Science Special Report: Fourth National Climate Assessment, Volume I. Wuebbles, D. J., D. W. Fahey, K. A. Hibbard, D. J. Dokken, B. C. Stewart, and T. K. Maycock, Eds., U.S. Global Change Research Program, Washington, DC, USA, 231–256. doi:10.7930/J0CJ8BNN. ↩
  • Wenger, S. J., D. J. Isaak, C. H. Luce, H. M. Neville, K. D. Fausch, J. B. Dunham, D. C. Dauwalter, M. K. Young, M. M. Elsner, B. E. Rieman, A. F. Hamlet, and J. E. Williams, 2011: Flow regime, temperature, and biotic interactions drive differential declines of trout species under climate change. Proceedings of the National Academy of Sciences of the United States of America, 108 (34), 14175–14180. doi:10.1073/pnas.1103097108. ↩
  • Whateley, S., and C. Brown, 2016: Assessing the relative effects of emissions, climate means, and variability on large water supply systems. Geophysical Research Letters, 43 (21), 11,329-11,338. doi:10.1002/2016GL070241. ↩
  • Whateley, S., S. Steinschneider, and C. Brown, 2014: A climate change range‐based method for estimating robustness for water resources supply. Water Resources Research, 50 (11), 8944–8961. doi:10.1002/2014WR015956. ↩
  • Whitehead, P. G., R. L. Wilby, R. W. Battarbee, M. Kernan, and A. J. Wade, 2009: A review of the potential impacts of climate change on surface water quality. Hydrological Sciences Journal, 54 (1), 101–123. doi:10.1623/hysj.54.1.101. ↩
  • Woodhouse, C. A., J. L. Russell, and E. R. Cook, 2009: Two modes of North American drought from instrumental and paleoclimatic data. Journal of Climate, 22 (16), 4336–4347. doi:10.1175/2009jcli2705.1. ↩
  • Zeff, H. B., and G. W. Characklis, 2013: Managing water utility financial risks through third-party index insurance contracts. Water Resources Research, 49 (8), 4939–4951. doi:10.1002/wrcr.20364. ↩
  • Zervas, C., 2013: Extreme water levels of the United States 1893-2010. NOAA Technical Report NOS CO-OPS 067. NOAA National Ocean Service, Silver Spring, MD, 200 pp. URL. ↩
  • Ziska, L., A. Crimmins, A. Auclair, S. DeGrasse, J. F. Garofalo, A. S. Khan, I. Loladze, A. A. Pérez de León, A. Showler, J. Thurston, and I. Walls, 2016: Ch. 7: Food safety, nutrition, and distribution. The Impacts of Climate Change on Human Health in the United States: A Scientific Assessment., U.S. Global Change Research Program, Washington, DC, 189–216. doi:10.7930/J0ZP4417. ↩

External Link External Link

You are leaving The Fourth National Climate Assessment and will be redirected to a new site in 5 seconds.

USGCRP Globalchange.gov earth logo

13 Logos #1 13 Logos #2

U.S. Global Change Research Program
1800 G Street, NW, Suite 9100, Washington, DC 20006 USA
Tel: +1 202.223.6262 | Fax: +1 202.223.3065

Contact Us • Credits • Privacy Policy • Site Map

Some figures and images are copyright protected.
Permission of the copyright owner must be obtained
before making use of copyrighted material.