APPENDIX 5
Frequently Asked Questions
Frequently Asked Questions
- Technical Contributors:
- C. Taylor Armstrong, National Oceanic and Atmospheric Administration
- Edward Blanchard-Wrigglesworth, University of Washington
- James Bradbury, Georgetown Climate Center
- Delavane Diaz, Electric Power Research Institute
- Joshua Graff-Zivin, University of California, San Diego
- Jessica Halofsky, University of Washington
- Lesley Jantarasami, Oregon Department of Energy
- Shannon LaDeau, Cary Institute of Ecosystem Studies
- Elizabeth Marino, Oregon State University
- Shaima Nasiri, U.S. Department of Energy
- Matthew Neidell, Columbia University
- Rachael Novak, U.S. Department of the Interior
- Rick Ostfeld, Cary Institute of Ecosystem Studies
- David Pierce, Scripps Institute of Oceanography
- Catherine Pollack, National Oceanic and Atmospheric Administration
- William V. Sweet, National Oceanic and Atmospheric Administration
- Carina Wyborn, University of Montana
- Laurie Yung, University of Montana-Missoula
- Lewis Ziska, U.S. Department of Agriculture
- USGCRP Coordinators:
<strong>Dzaugis</strong>, M.P., D.R. Reidmiller, C.W. Avery, A. Crimmins, L. Dahlman, D.R. Easterling, R. Gaal, E. Greenhalgh, D. Herring, K.E. Kunkel, R. Lindsey, T.K. Maycock, R. Molar, B.C. Stewart, and R.S. Vose, 2018: Frequently Asked Questions. In <em>Impacts, Risks, and Adaptation in the United States: Fourth National Climate Assessment, Volume II</em> [Reidmiller, D.R., C.W. Avery, D.R. Easterling, K.E. Kunkel, K.L.M. Lewis, T.K. Maycock, and B.C. Stewart (eds.)]. U.S. Global Change Research Program, Washington, DC, USA, pp. 1444–1515. doi: <a href='http://doi.org/10.7930/NCA4.2018.AP5'>10.7930/NCA4.2018.AP5</a>
This appendix is an update to the frequently asked questions (FAQs) presented in the Third National Climate Assessment (NCA3). New questions based on areas of emerging scientific inquiry are included alongside updated responses to the FAQs from NCA3. The answers are based on the U.S. Global Change Research Program’s (USGCRP) sustained assessment products, other peer-reviewed literature, and consultation with experts.
Introduction to Climate Change
Many indicators show conclusively that Earth has warmed since the 19th century. In addition to warming shown in the observational record of oceanic and atmospheric temperature, other evidence includes melting glaciers and continental ice sheets, rising global sea level, a longer frost-free season, changes in temperature extremes, and increases in atmospheric humidity, all consistent with long-term warming.
1. How do we know Earth is warming?
Observations of surface temperature taken over Earth’s land and ocean surfaces since the 19th century show a clear warming trend. Temperature observations have been taken consistently since the 1880s or earlier at thousands of observing sites around the world. Additionally, instruments on ships, buoys, and floats together provide a more-than-100-year record of sea surface temperature showing that the top 6,500 feet of Earth’s ocean is warming in all basins.1 These observations are consistent with readings from satellite instruments that measure atmospheric and sea surface temperatures from space. Used together, land-, ocean-, and space-based temperature observations show clear evidence of warming at Earth’s surface over climatological timescales (see Ch. 2: Climate and http://www.globalchange.gov/browse/indicators for more indicators of change).
Scientists around the world have been measuring the extent and volume of ice contained in the same glaciers every few years since 1980. These measurements show that, globally, there is a large net volume loss in glacial ice since the 1980s. However, the rate of the ice loss varies by region, and in some cases yearly glacier advances are observed (see FAQ “How does climate change affect mountain glaciers?”). Ice sheets on Antarctica and Greenland have been losing ice mass consistently since 2002, when advanced satellite measurements of their continental ice mass began (see FAQ “Is Antarctica losing ice? What about Greenland?”). Arctic sea ice coverage has been monitored using satellite imagery since the late 1970s, showing consistent and large declines in September, the time of year when the minimum coverage occurs.2
There are additional observational lines of evidence for warming. For example, the area of land in the Northern Hemisphere covered by snow each spring is now smaller on average than it was in the 1960s.3 Tide gauges and satellites show that global sea level is rising, both as a result of the addition of water to the ocean from melting glaciers and from the expansion of seawater as it warms (Ch. 2: Climate; Ch. 8: Coastal). Lastly, as air warms, its capacity to hold water vapor increases, and measurements show that atmospheric humidity is increasing around the globe, consistent with a warming climate (see Ch. 3: Water; see also Ch. 1: Overview, Figure 1.2 for more indicators of a warming world).
Increases in global temperature since the 1950s are unusual for two reasons. First, current changes are primarily the result of human activities rather than natural physical processes. Second, temperature changes are occurring much faster than they did in the past.
2. What makes recent climate change different from warming in the past?"
Our planet’s climate has changed before. Sedimentary rocks and fossils show clear evidence for a series of long cold periods—called ice ages—followed by warm periods. Common archaeological and geological processes for dating past events show that these cycles of cooling and warming occurred about once every 100,000 years for at least the last million years.
Before major land-use changes and industrialization, changes in global temperature were caused by natural factors, including regular changes in Earth’s orbit around the sun, volcanic eruptions, and changes in energy from the sun.4 Major warming and cooling events were driven by natural variations of Earth’s orbit that altered the amount of sunlight reaching Earth’s Arctic and Antarctic regions, resulting in the retreat and advance of massive ice sheets. Additionally, quiescent or active periods of volcanic eruptions also could contribute to warming or cooling events, respectively.5
Natural factors are still affecting the planet’s climate today (see Figure A5.5). Yet since the beginning of the Industrial Revolution, human use of coal, oil, and gas has rapidly changed the composition of the atmosphere (Figure A5.1). Land-use changes (such as deforestation), cement production, and animal production for food have also contributed to the increase in levels of greenhouse gases in the atmosphere. Unlike past changes in climate, today’s warming is driven primarily by human activity rather than by natural physical processes (see Figure A5.5) (see also Ch. 2: Climate).
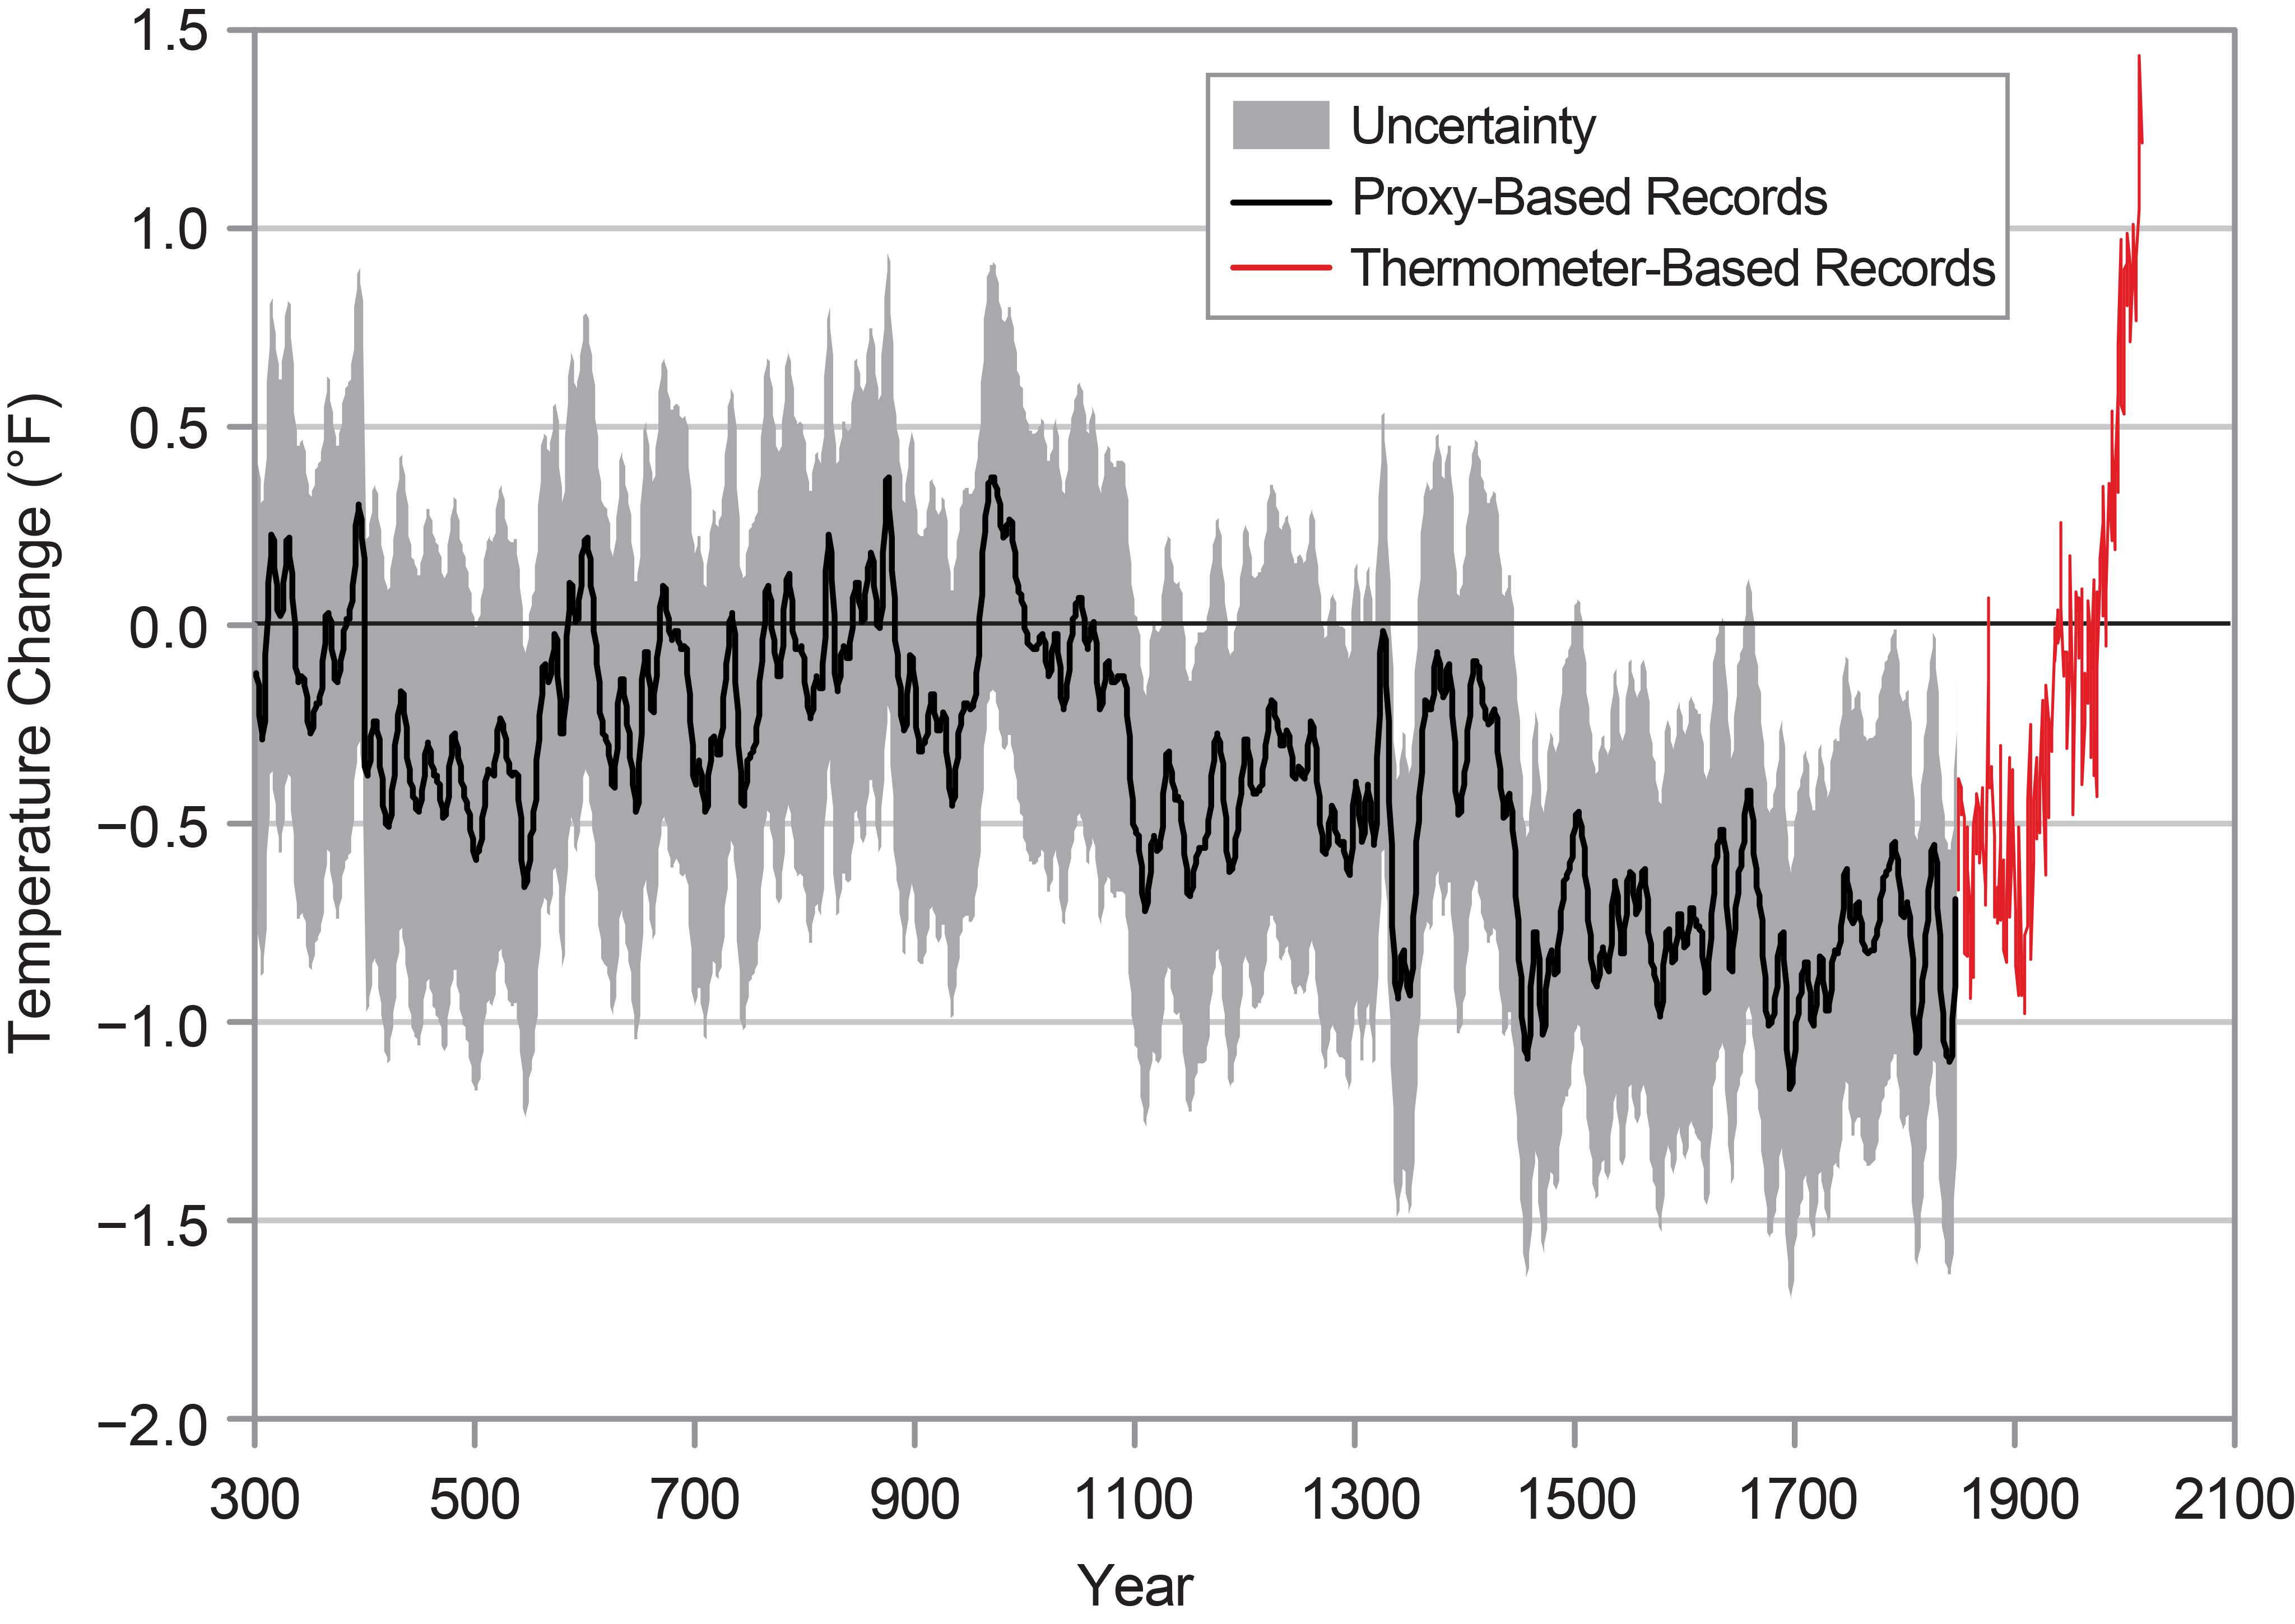
Current warming is also happening much faster than it did in the past. Scientific records from ice cores, tree rings, soil boreholes, and other “natural thermometers”—often called proxy climate data—show that the recent increase in temperature is unusually rapid compared to past changes (see Figures A5.2 and A5.4). After an ice age, Earth typically took thousands of years to warm up again; the observed rate of warming over the last 50 years is about eight times faster than the average rate of warming from a glacial maximum to a warm interglacial period.4
Figure A5.1: Carbon Emissions in the Industrial Age
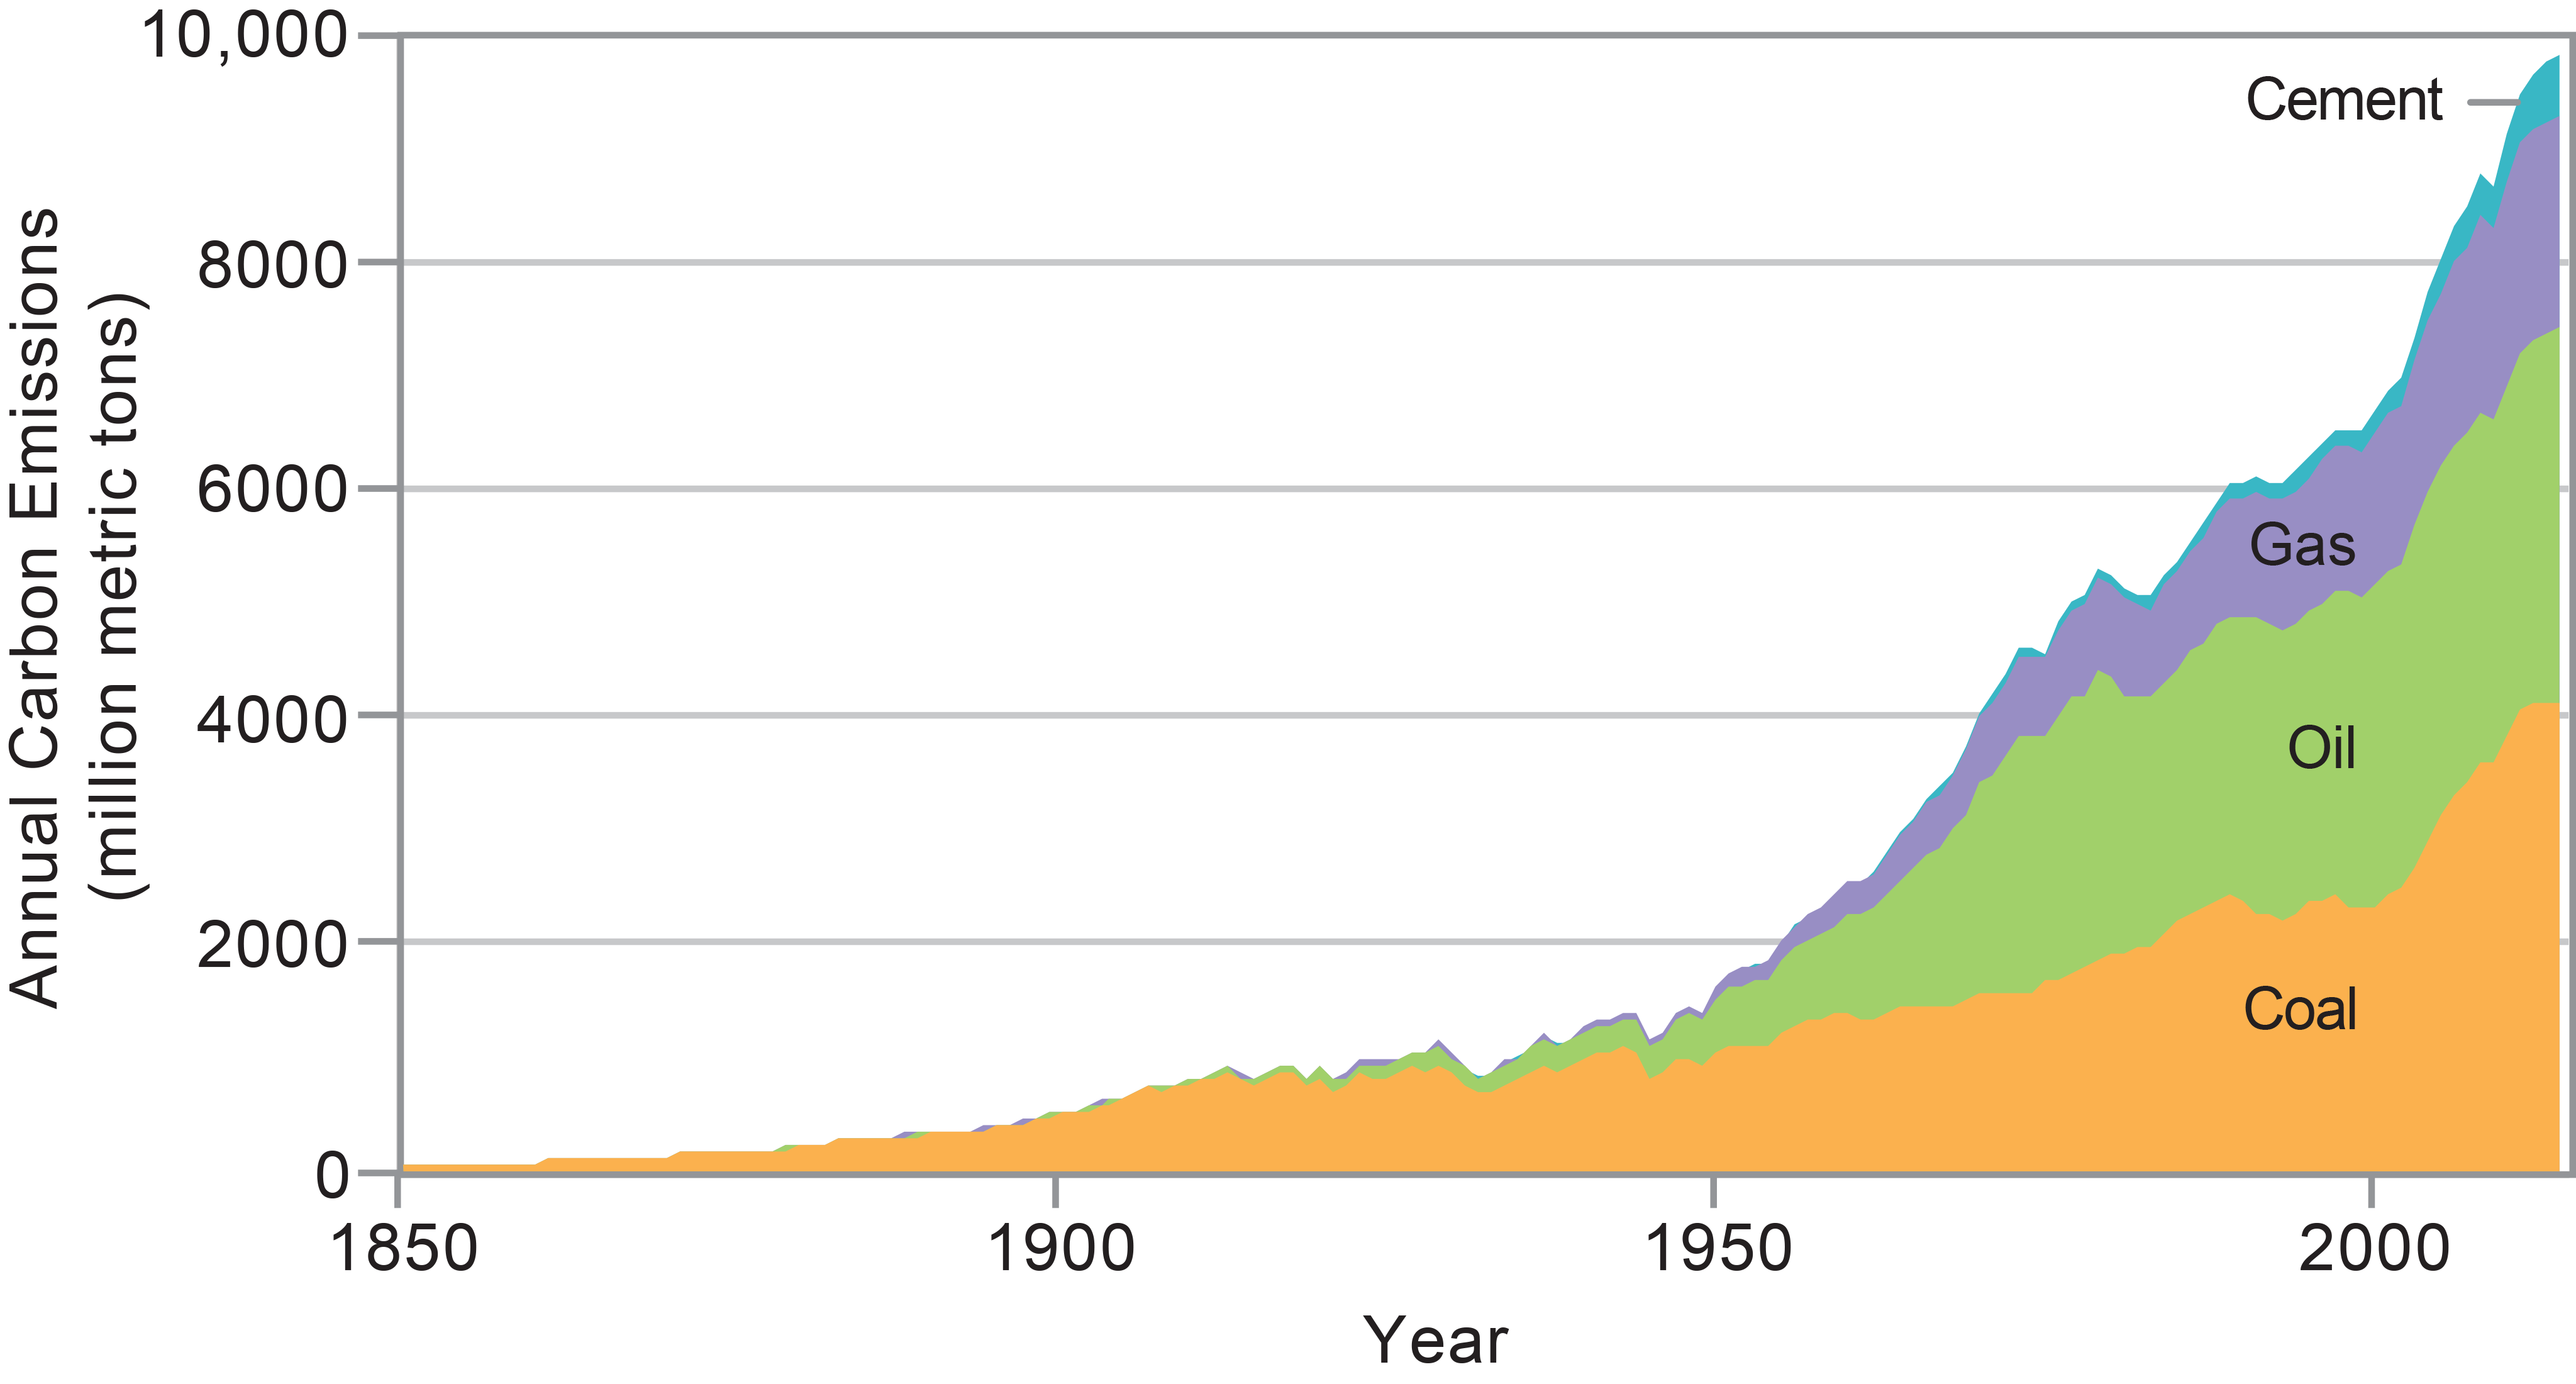
Figure A5.2: 1,700 Years of Global Temperature Change
Though some people use the terms “global warming” and “climate change” interchangeably, their meanings are slightly different. Global warming refers only to Earth’s rising surface temperature, while climate change includes temperature changes and a multitude of effects that result from warming, including melting glaciers, increased humidity, heavier rainstorms, and changes in the patterns of some climate-related extreme events.
3. What’s the difference between global warming and climate change?
By itself, the phrase global warming refers to increases in Earth’s annual average surface temperature. Today, however, when people use the phrase, they usually mean the recent warming that is due in large part to the rapid increase of greenhouse gases (GHGs) in the atmosphere from human activities such as deforestation and the burning of fossil fuels for energy. Thus, “global warming” has become a form of shorthand for a complex scientific process.
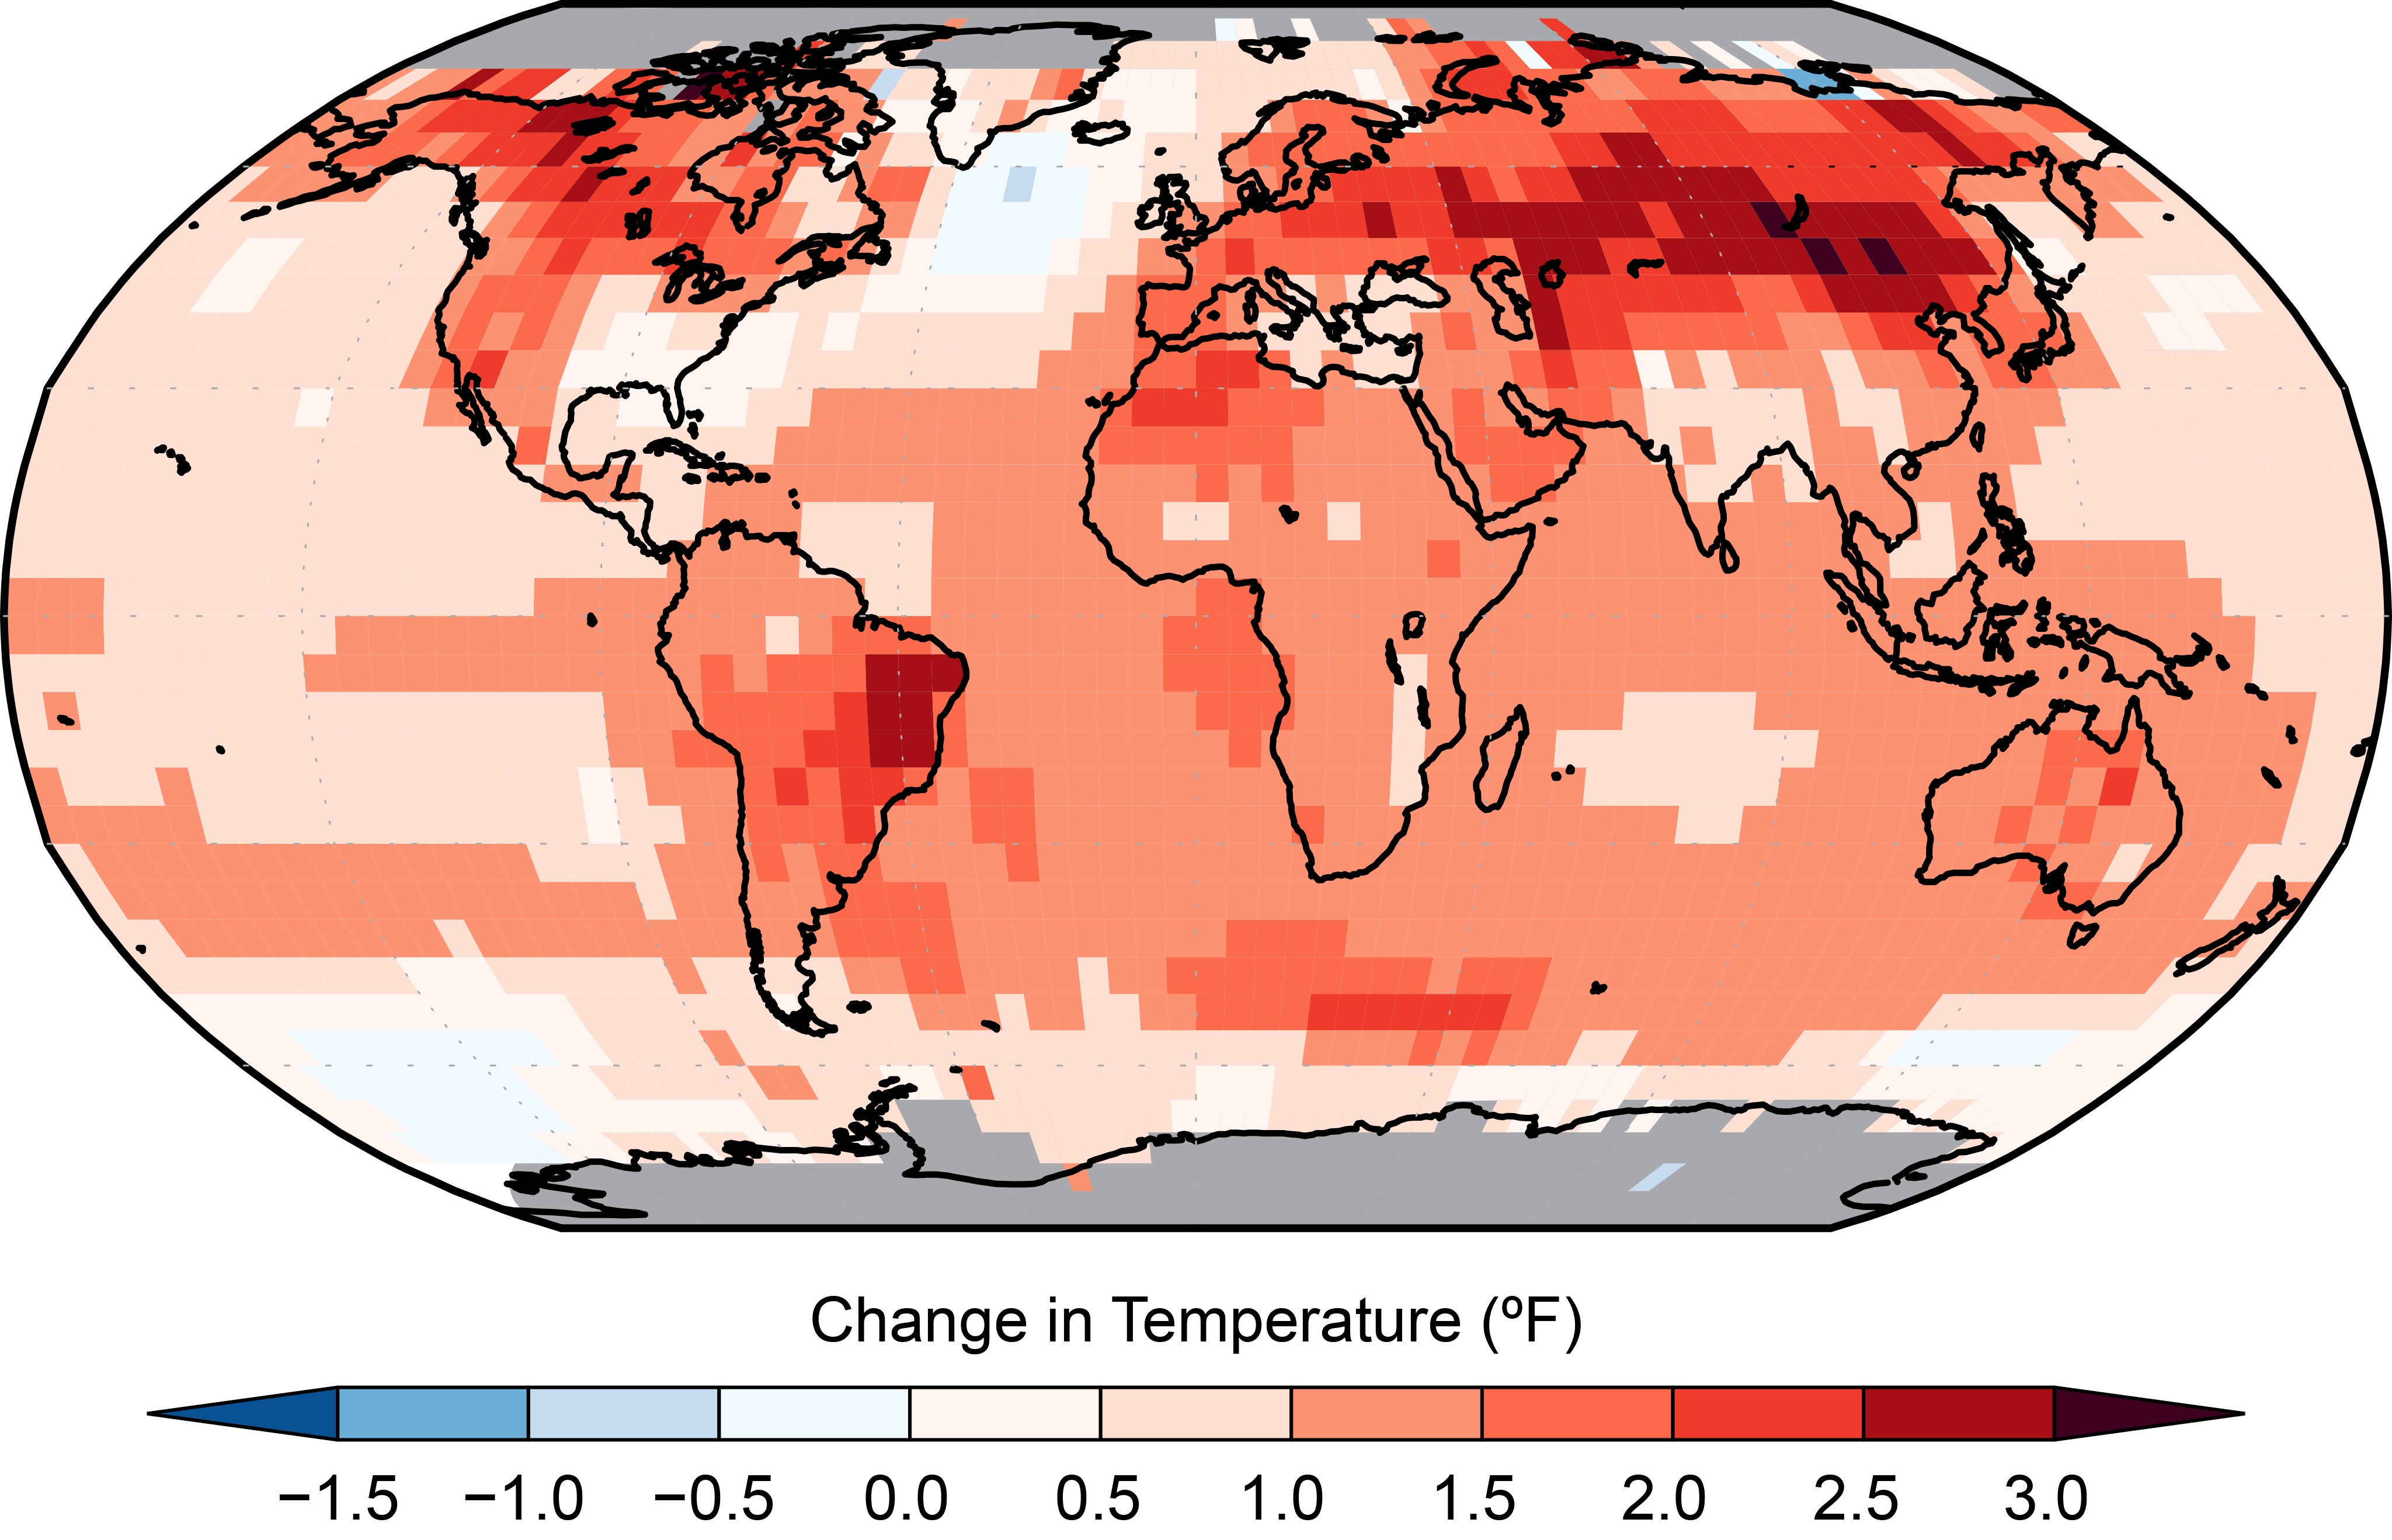
The entire globe is not warming uniformly. Some areas may cool (such as the North Atlantic Ocean), while some may warm faster than the global average (such as the Arctic). The term climate change refers to the full range of consequences or impacts that occur as atmospheric levels of GHGs rise and different parts of the earth system respond to a higher average surface temperature. For instance, observed long-term trends, such as increases in the frequency of drought and heavy precipitation events, are not technically warming trends, but they are related to current warming and are processes of climate change (Ch 2: Climate).
Climate Science
Greenhouse gases (GHGs) are gases that absorb and emit thermal (heat) infrared radiation. Carbon dioxide, methane, nitrous oxide, ozone, and water vapor are the most prevalent GHGs in Earth’s atmosphere. These gases absorb heat emitted by Earth’s surface and re-emit that heat into Earth’s atmosphere, making it much warmer than it would be otherwise—a process known as the greenhouse effect.
4. What are greenhouse gases, and what is the greenhouse effect?
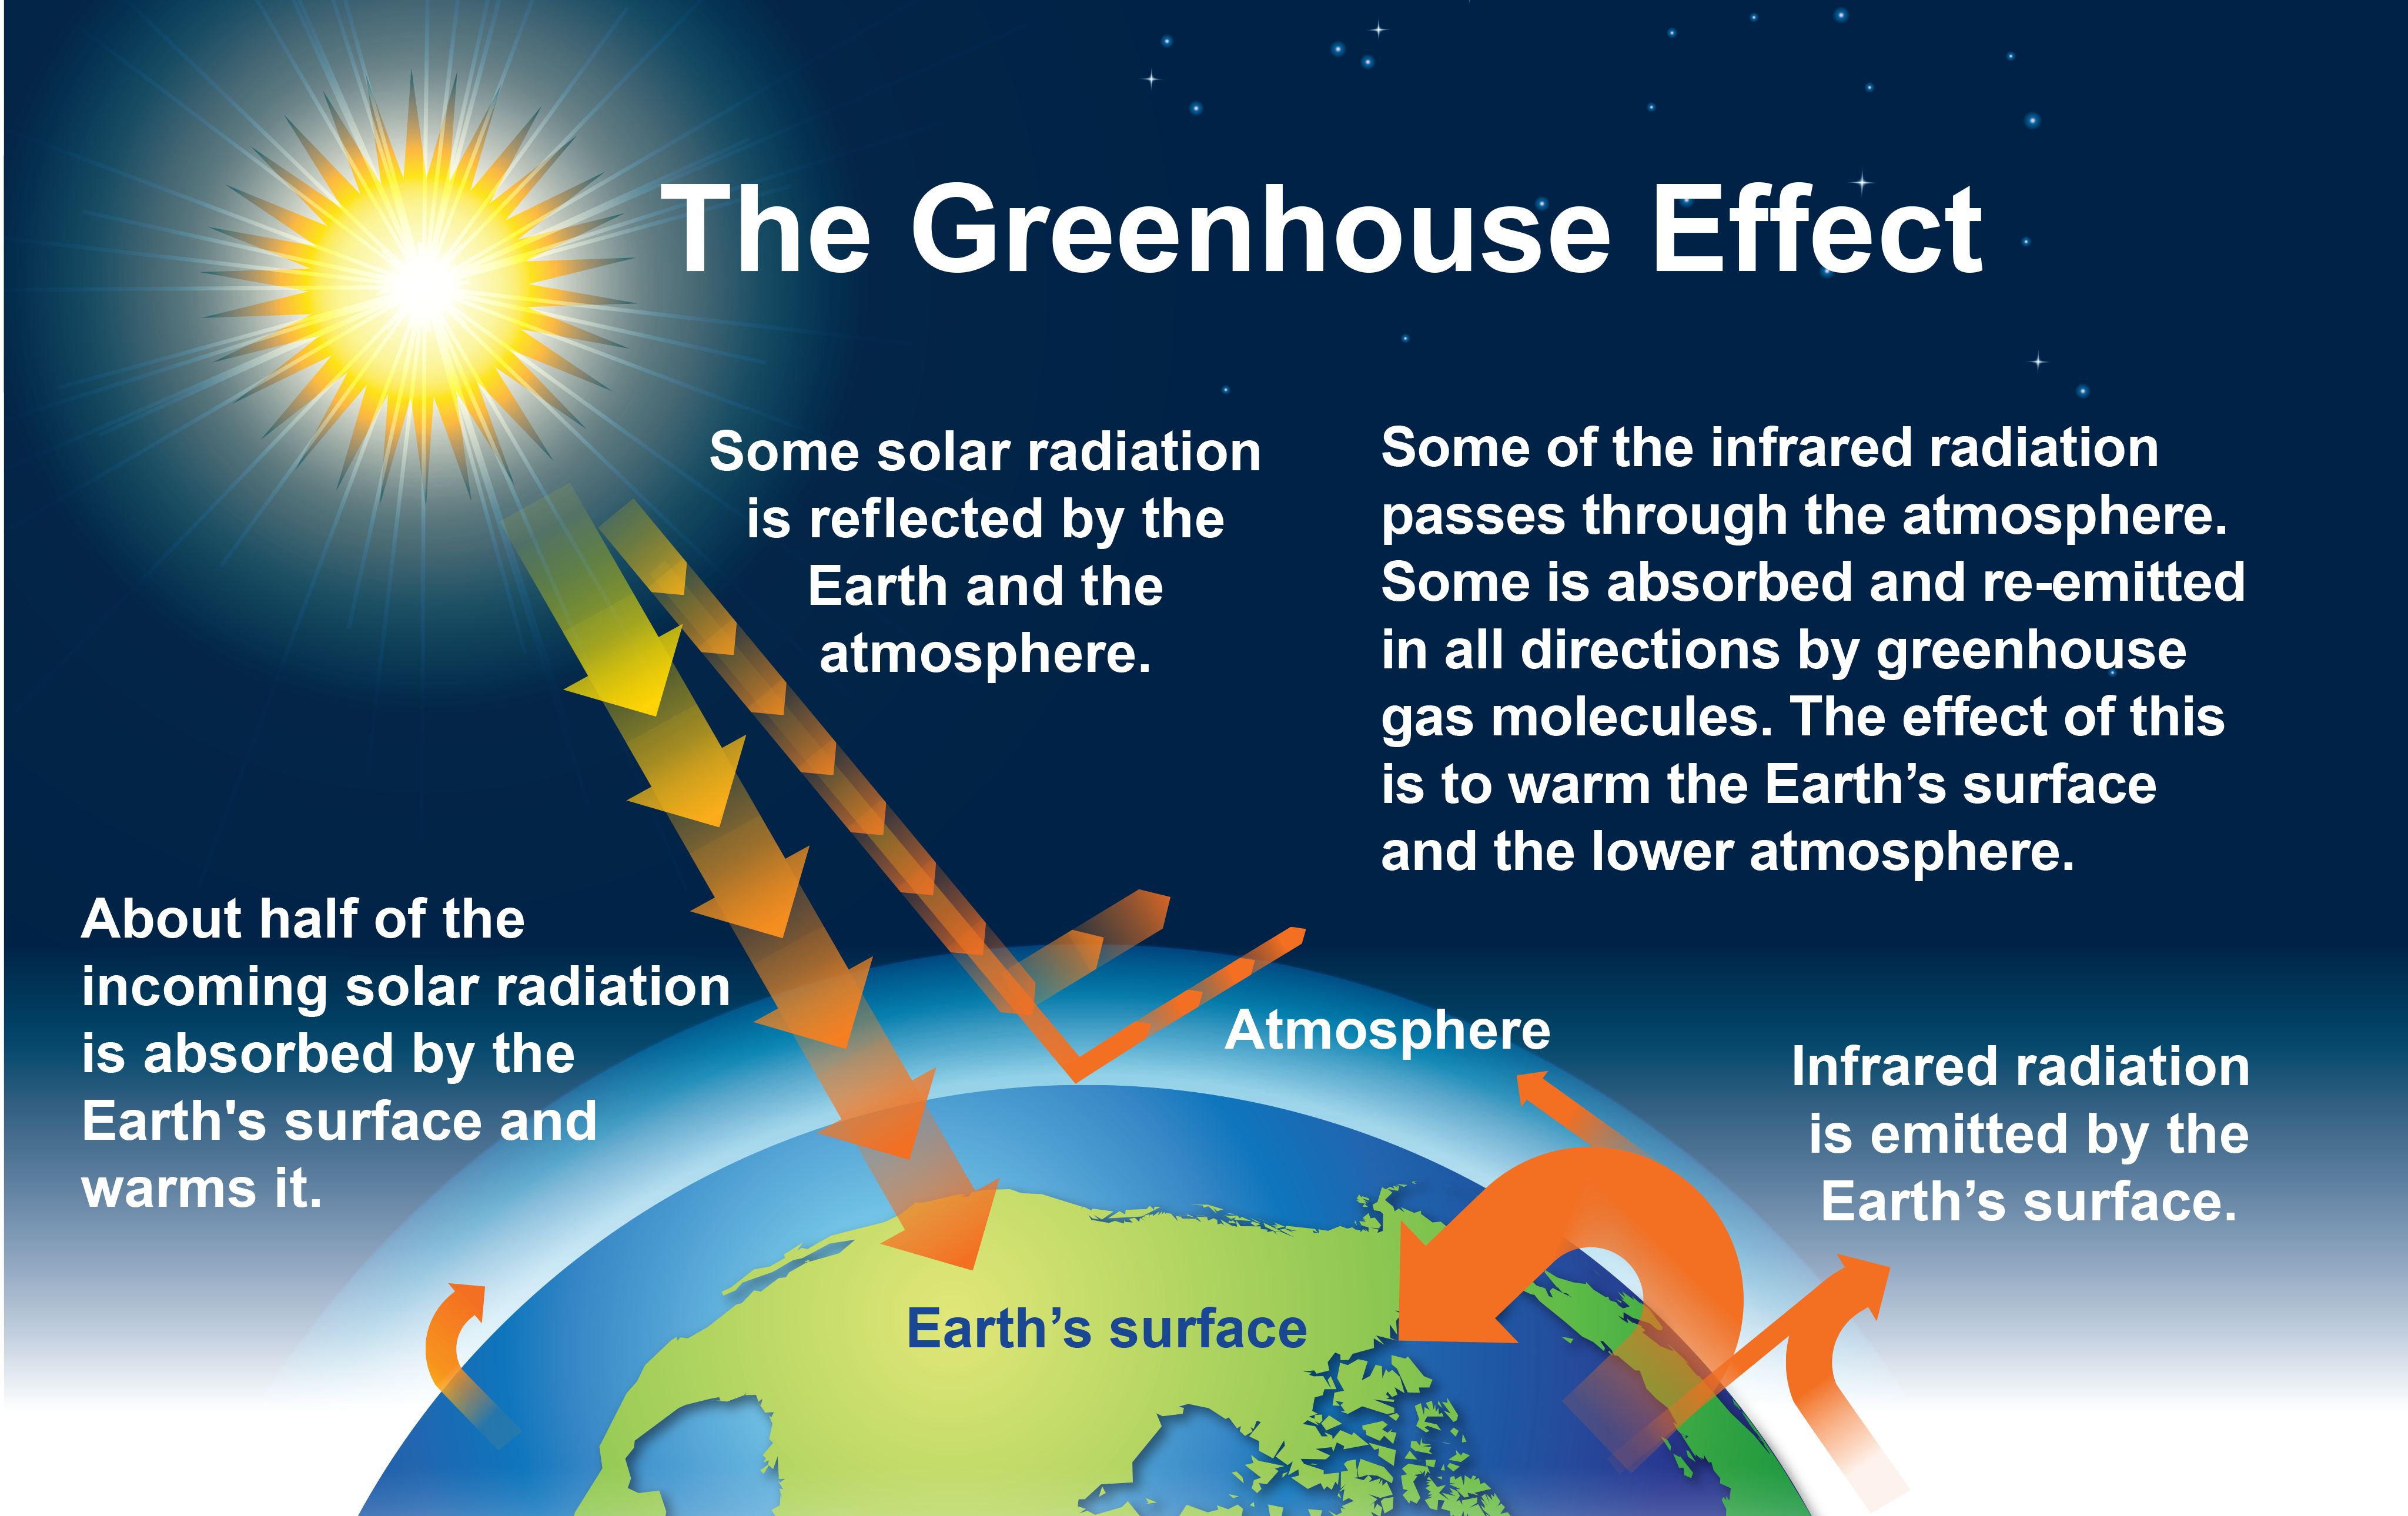
Most of Earth’s atmosphere is made up of nitrogen (N2) and oxygen (O2), neither of which is considered a greenhouse gas. Other gases, known as greenhouse gases (GHGs), behave very differently from O2 and N2 when it comes to infrared radiation emitted from Earth. GHGs, such as water vapor, carbon dioxide (CO2), and methane (CH4), have a more complex molecular structure (made up of three or more atoms, as opposed to the symmetrical, two-atom molecules of O2 and N2) that absorbs some of the energy emitted from Earth’s surface and then re-radiates that energy in all directions, including back down towards the surface. This ultimately traps energy in the lower atmosphere in the form of heat (Figure A5.3). This greenhouse effect makes the average temperature of Earth nearly 60°F warmer than it would be in the absence of these GHGs. Even a tiny amount of these gases can have a huge effect on the amount of heat trapped in the lower atmosphere, just like a tiny amount of anthrax can have a huge effect on human health.
Many GHGs, including CO2, CH4, water vapor, and nitrous oxide (N2O), occur naturally in the atmosphere. However, atmospheric concentrations of these GHGs have been rising over the last few centuries as a result of human activities. In addition, human activities have added new, entirely human-made GHGs to the atmosphere, including chlorofluorocarbons (CFCs), hydrofluorocarbons (HFCs), perfluorocarbons (PFCs), and sulfur hexafluoride (SF6).5
As the global population has increased, so have GHG emissions. This in turn makes the greenhouse effect stronger, resulting in higher average temperature around the globe (Ch 2: Climate).
Figure A5.3: The Greenhouse Effect
Many independent lines of evidence support the finding that human activities are the dominant cause of recent (since 1950) climate change. These lines of evidence include changes seen in the observational records that are consistent with our understanding, based on physics, of how the climate system should change due to human influences. Other evidence comes from climate modeling studies that closely reproduce the observed temperature record.
5. Why are scientists confident that human activities are the primary cause of recent climate change?
The Climate Science Special Report9 concludes, “human activities, especially emissions of greenhouse gases, are the dominant cause of the observed warming since the mid-20th century.” The Earth’s climate only warms or cools significantly in response to changes that affect the balance of incoming and outgoing energy. Over long timescales (tens to hundreds of thousands of years), orbital cycles produce long periods of warming and cooling. Over shorter timescales, two factors could generally force changes in Earth’s temperature to a measurable degree: (1) changes in the amount of energy put out by the sun, and (2) changes in the concentrations of greenhouse gases (GHGs) in Earth’s atmosphere. Recent measurements of the sun’s energy show no trend over the last 50 years. Additionally, observations show that the lower atmosphere (troposphere) has warmed while the upper atmosphere (stratosphere) has cooled. If the observed warming had been due to an increase in energy from the sun, then all layers of Earth’s atmosphere would have warmed, which is not what scientists observe. Thus, we can eliminate changes in the energy received from the sun as a major factor in the warming observed since about 1950.10
This leaves the possibility that changes in GHG concentrations in the atmosphere are the primary cause of recent warming. Atmospheric carbon dioxide (CO2) levels have increased from approximately 270 parts per million (ppm) during preindustrial times to the current 408 ppm observed in 2018 (see https://www.esrl.noaa.gov/gmd/ccgg/trends)—levels that exceed any observed over the past 800,000 years (Figure A5.4). In addition, atmospheric concentrations of other GHGs (including methane and nitrous oxide) have increased over the same period. This increase in GHG concentrations has coincided with the observed increase in global temperature. Scientists use methods that provide chemical “fingerprints” of the source of these increased emissions and have shown that the 40% increase in atmospheric CO2 levels since the Industrial Revolution is due mainly to human activities (primarily the combustion of fossil fuels) and not due to natural carbon cycle processes.5
Other evidence attributing human activities as the dominant driver of observed warming comes from climate modeling studies. Computer simulations of Earth’s climate based on historical data of observed changes in natural and human influences accurately reproduce the observed temperature record over the last 120 years. These results show that without human influences, such as the observed increases in GHG emissions, Earth’s surface would have cooled slightly over the past half century. The only way to closely replicate the observed warming is to include both natural and human forcing changes in climate models (Figure A5.5). Thus, the observational record and modeling studies both point to human factors being the main cause for the recent warming (Ch.2: Climate).
Figure A5.4: 800,000 Years of CO2 and Temperature Change

Figure A5.5: Human and Natural Influences on Global Temperature
Click legend item names to toggle graph lines.
Sophisticated computer models of Earth’s climate system allow scientists to explore the effects of both natural and human factors. In all three panels of this figure, the black line shows the observed annual average global surface temperature for 1880–2017 as a difference from the average value for 1880–1910.
The top panel (a) shows the temperature changes simulated by a climate model when only natural factors (yellow line) are considered. The other lines show the individual contributions to the overall effect from observed changes in Earth’s orbit (brown line), the amount of incoming energy from the sun (purple line), and changes in emissions from volcanic eruptions (green line). Note that no long-term trend in globally averaged surface temperature over this time period would be expected from natural factors alone.4
The middle panel (b) shows the simulated changes in global temperature when considering only human influences (dark red line), including the contributions from emissions of greenhouse gases (purple line) and small particles (referred to as aerosols, brown line) as well as changes in ozone levels (orange line) and changes in land cover, including deforestation (green line). Changes in aerosols and land cover have had a net cooling effect in recent decades, while changes in near-surface ozone levels have had a small warming effect.5 These smaller effects are dominated by the large warming influence of greenhouse gases such as carbon dioxide and methane. Note that the net effect of human factors (dark red line) explains most of the long-term warming trend.
The bottom panel (c) shows the temperature change (orange line) simulated by a climate model when both human and natural influences are included. The result matches the observed temperature record closely, particularly since 1950, making the dominant role of human drivers plainly visible.
Researchers do not expect climate models to exactly reproduce the specific timing of actual weather events or short-term climate variations, but they do expect the models to capture how the whole climate system behaves over long periods of time. The simulated temperature lines represent the average values from a large number of simulation runs. The orange hatching represents uncertainty bands based on those simulations. For any given year, 95% of the simulations will lie inside the orange bands. See Chapter 2: Climate for more information. Source: NASA GISS.
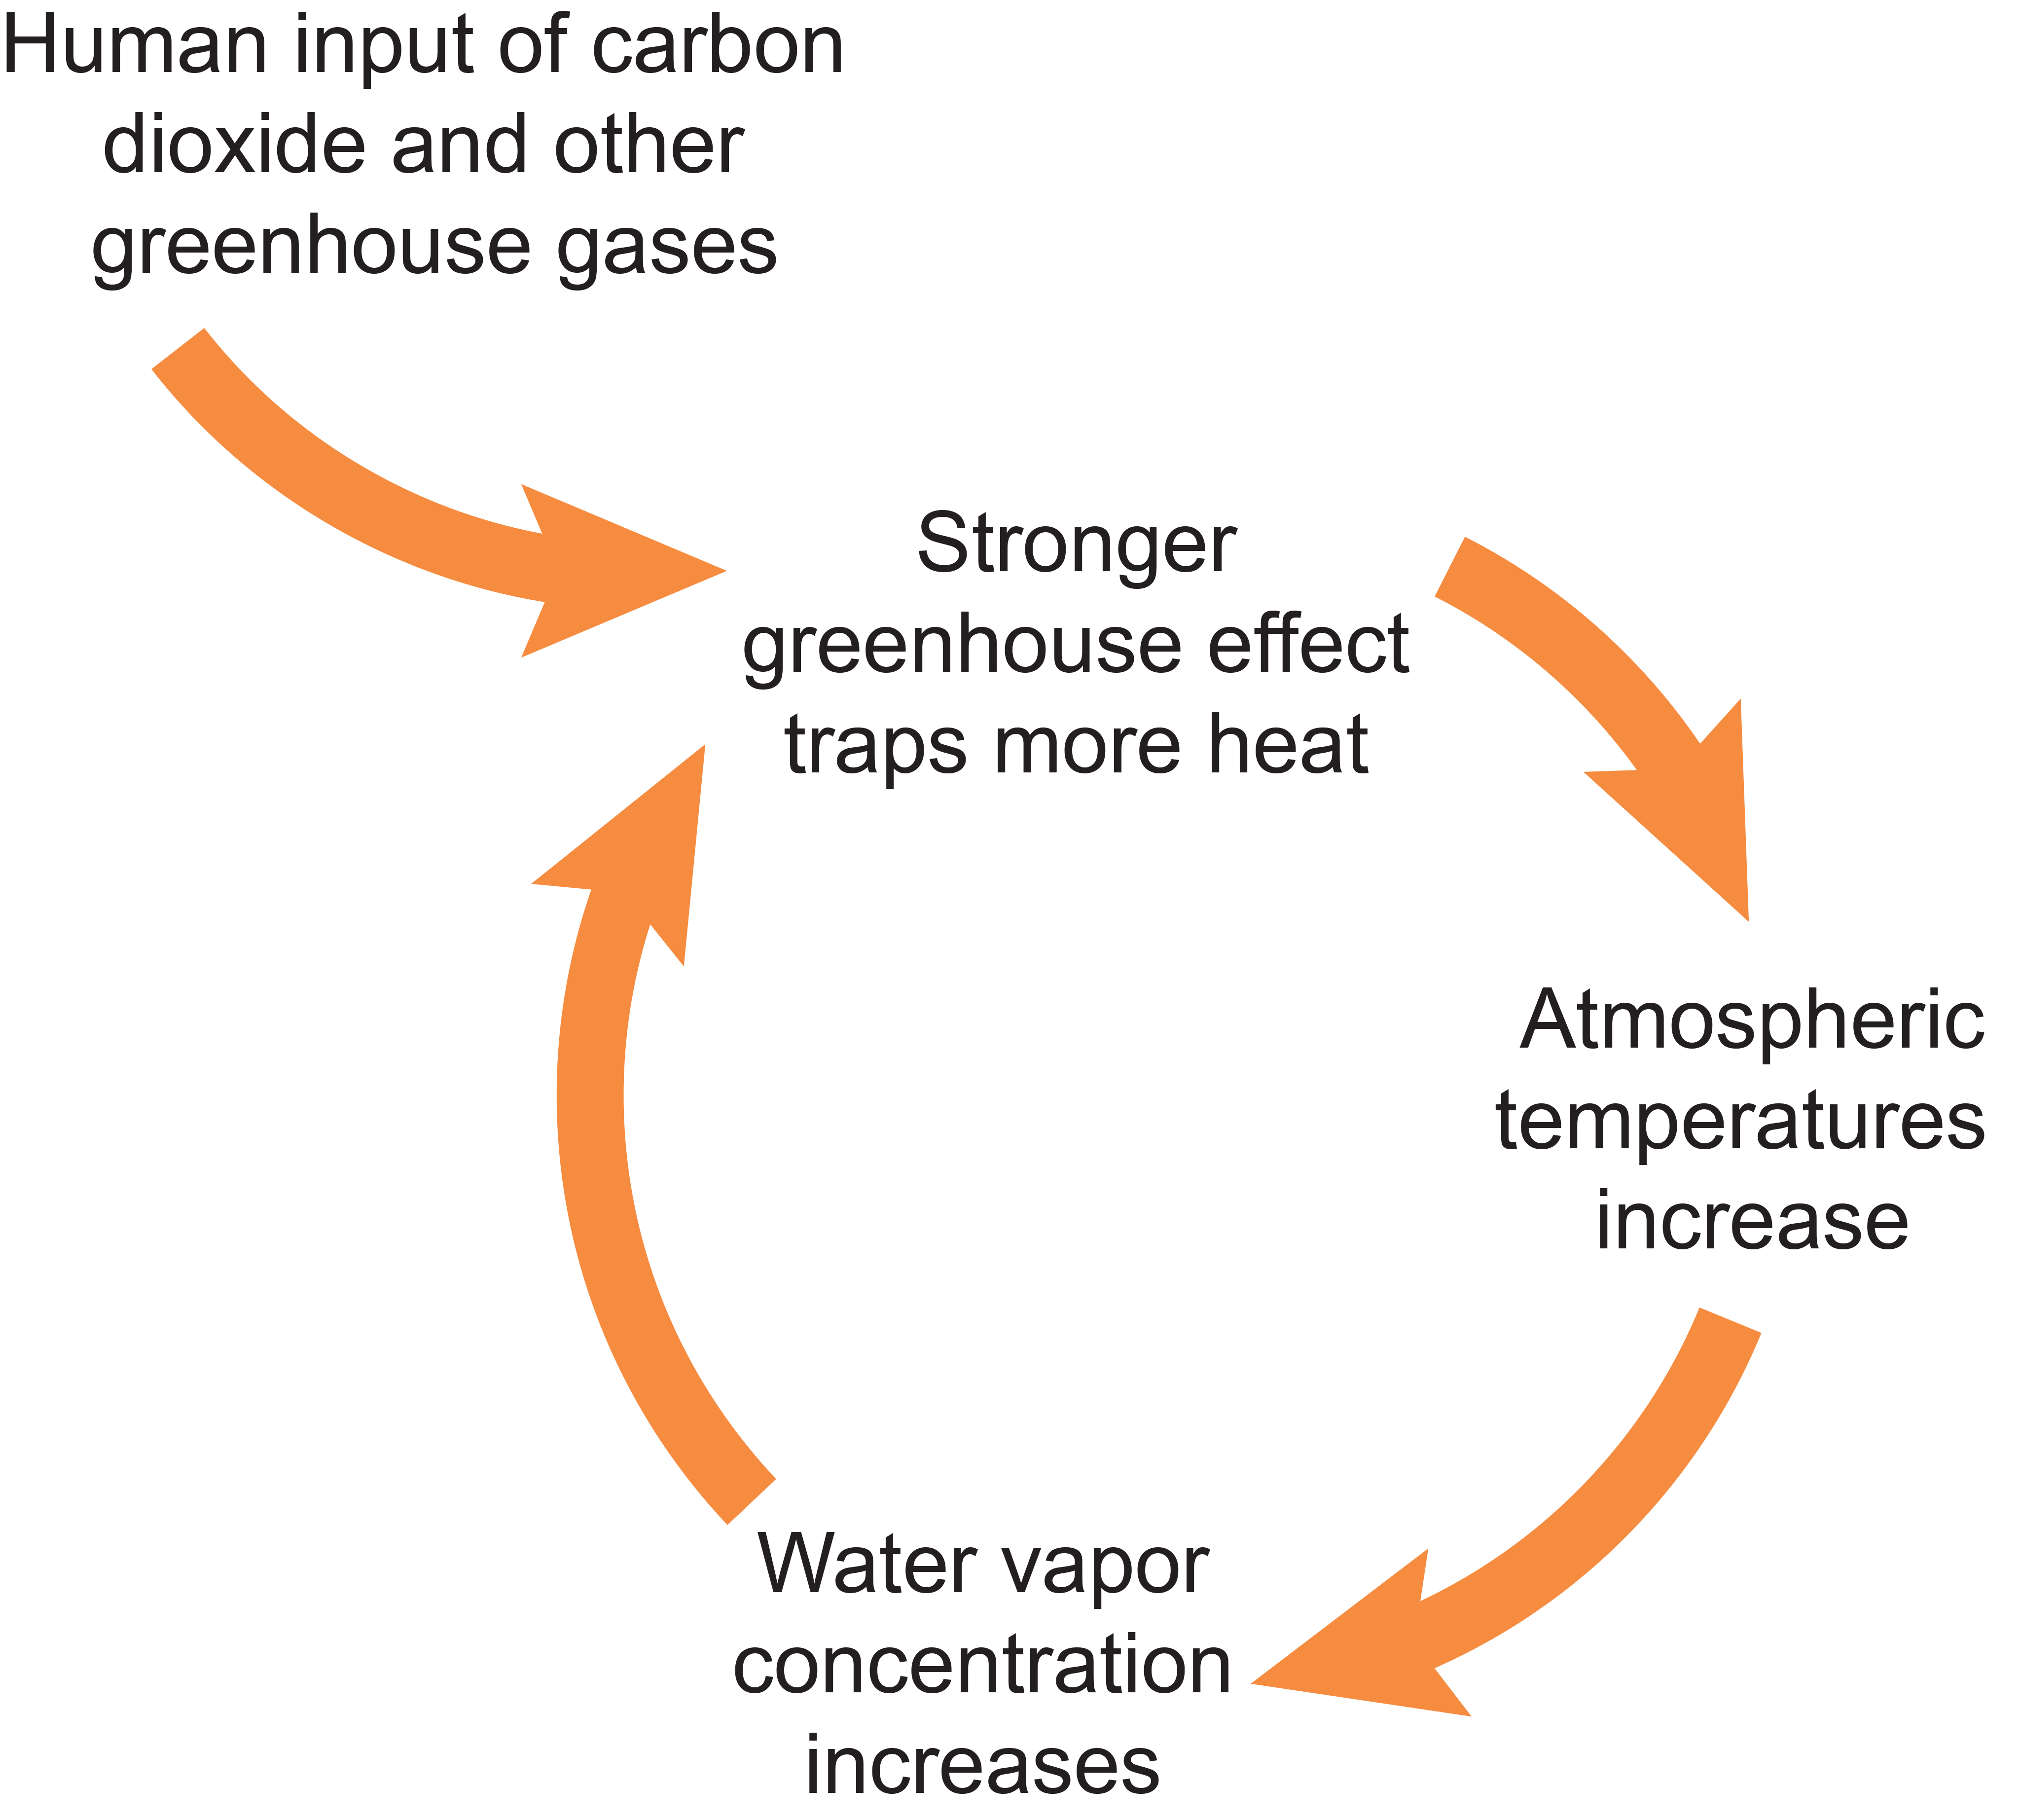
Water vapor is the most abundant greenhouse gas (GHG) in the atmosphere and plays an important role in Earth’s climate, significantly increasing Earth’s temperature. However, unlike other GHGs, water vapor can condense and precipitate, so water vapor has a short life span in the atmosphere. Air temperature, and not emissions, controls the amount of water vapor in the lower atmosphere. For this reason, water vapor is considered a feedback agent and not a driver of climate change.
6. What role does water vapor play in climate change?
Water vapor is the primary GHG in the atmosphere, and its contribution to Earth’s greenhouse effect is about two or three times that of carbon dioxide (CO2). Human activities directly add water vapor to the atmosphere primarily through increasing evaporation from irrigation, power plant cooling, and combustion of fossil fuels. Other GHGs, such as CO2, are not condensable at atmospheric temperatures and pressures, so they will continue to build up in the atmosphere as long as their emissions continue.12
The amount of water vapor in the lower atmosphere (troposphere) is mainly controlled by the air temperature and proximity to a water source, such as an ocean or large lake, rather than by emissions from human activities. Fluctuations in air temperature change the amount of water vapor that the air can hold, with warmer air capable of holding more moisture. Increases in water vapor levels in the lower atmosphere are considered a “positive feedback” (or self-reinforcing cycle) in the climate system. As increasing concentrations of other GHGs (for example, carbon dioxide, methane, and nitrous oxide) warm the atmosphere, atmospheric water vapor concentrations increase, thereby amplifying the warming effect (Figure A5.6). If atmospheric concentrations of CO2 and other GHGs decreased, air temperature would drop, decreasing the ability of the atmosphere to hold water vapor, further decreasing temperature.5,12
Figure A5.6: Water Vapor and the Greenhouse Effect
El Niño and other forms of natural climate variability are not caused by humans, but their frequency, duration, extent, or intensity might be affected by greenhouse gas emissions from human activities. Natural climate variability produces short-term regional changes in temperature and weather patterns, whereas human-caused climate change is a persistent, long-term phenomenon.
7. How are El Niño and climate variability related to climate change?
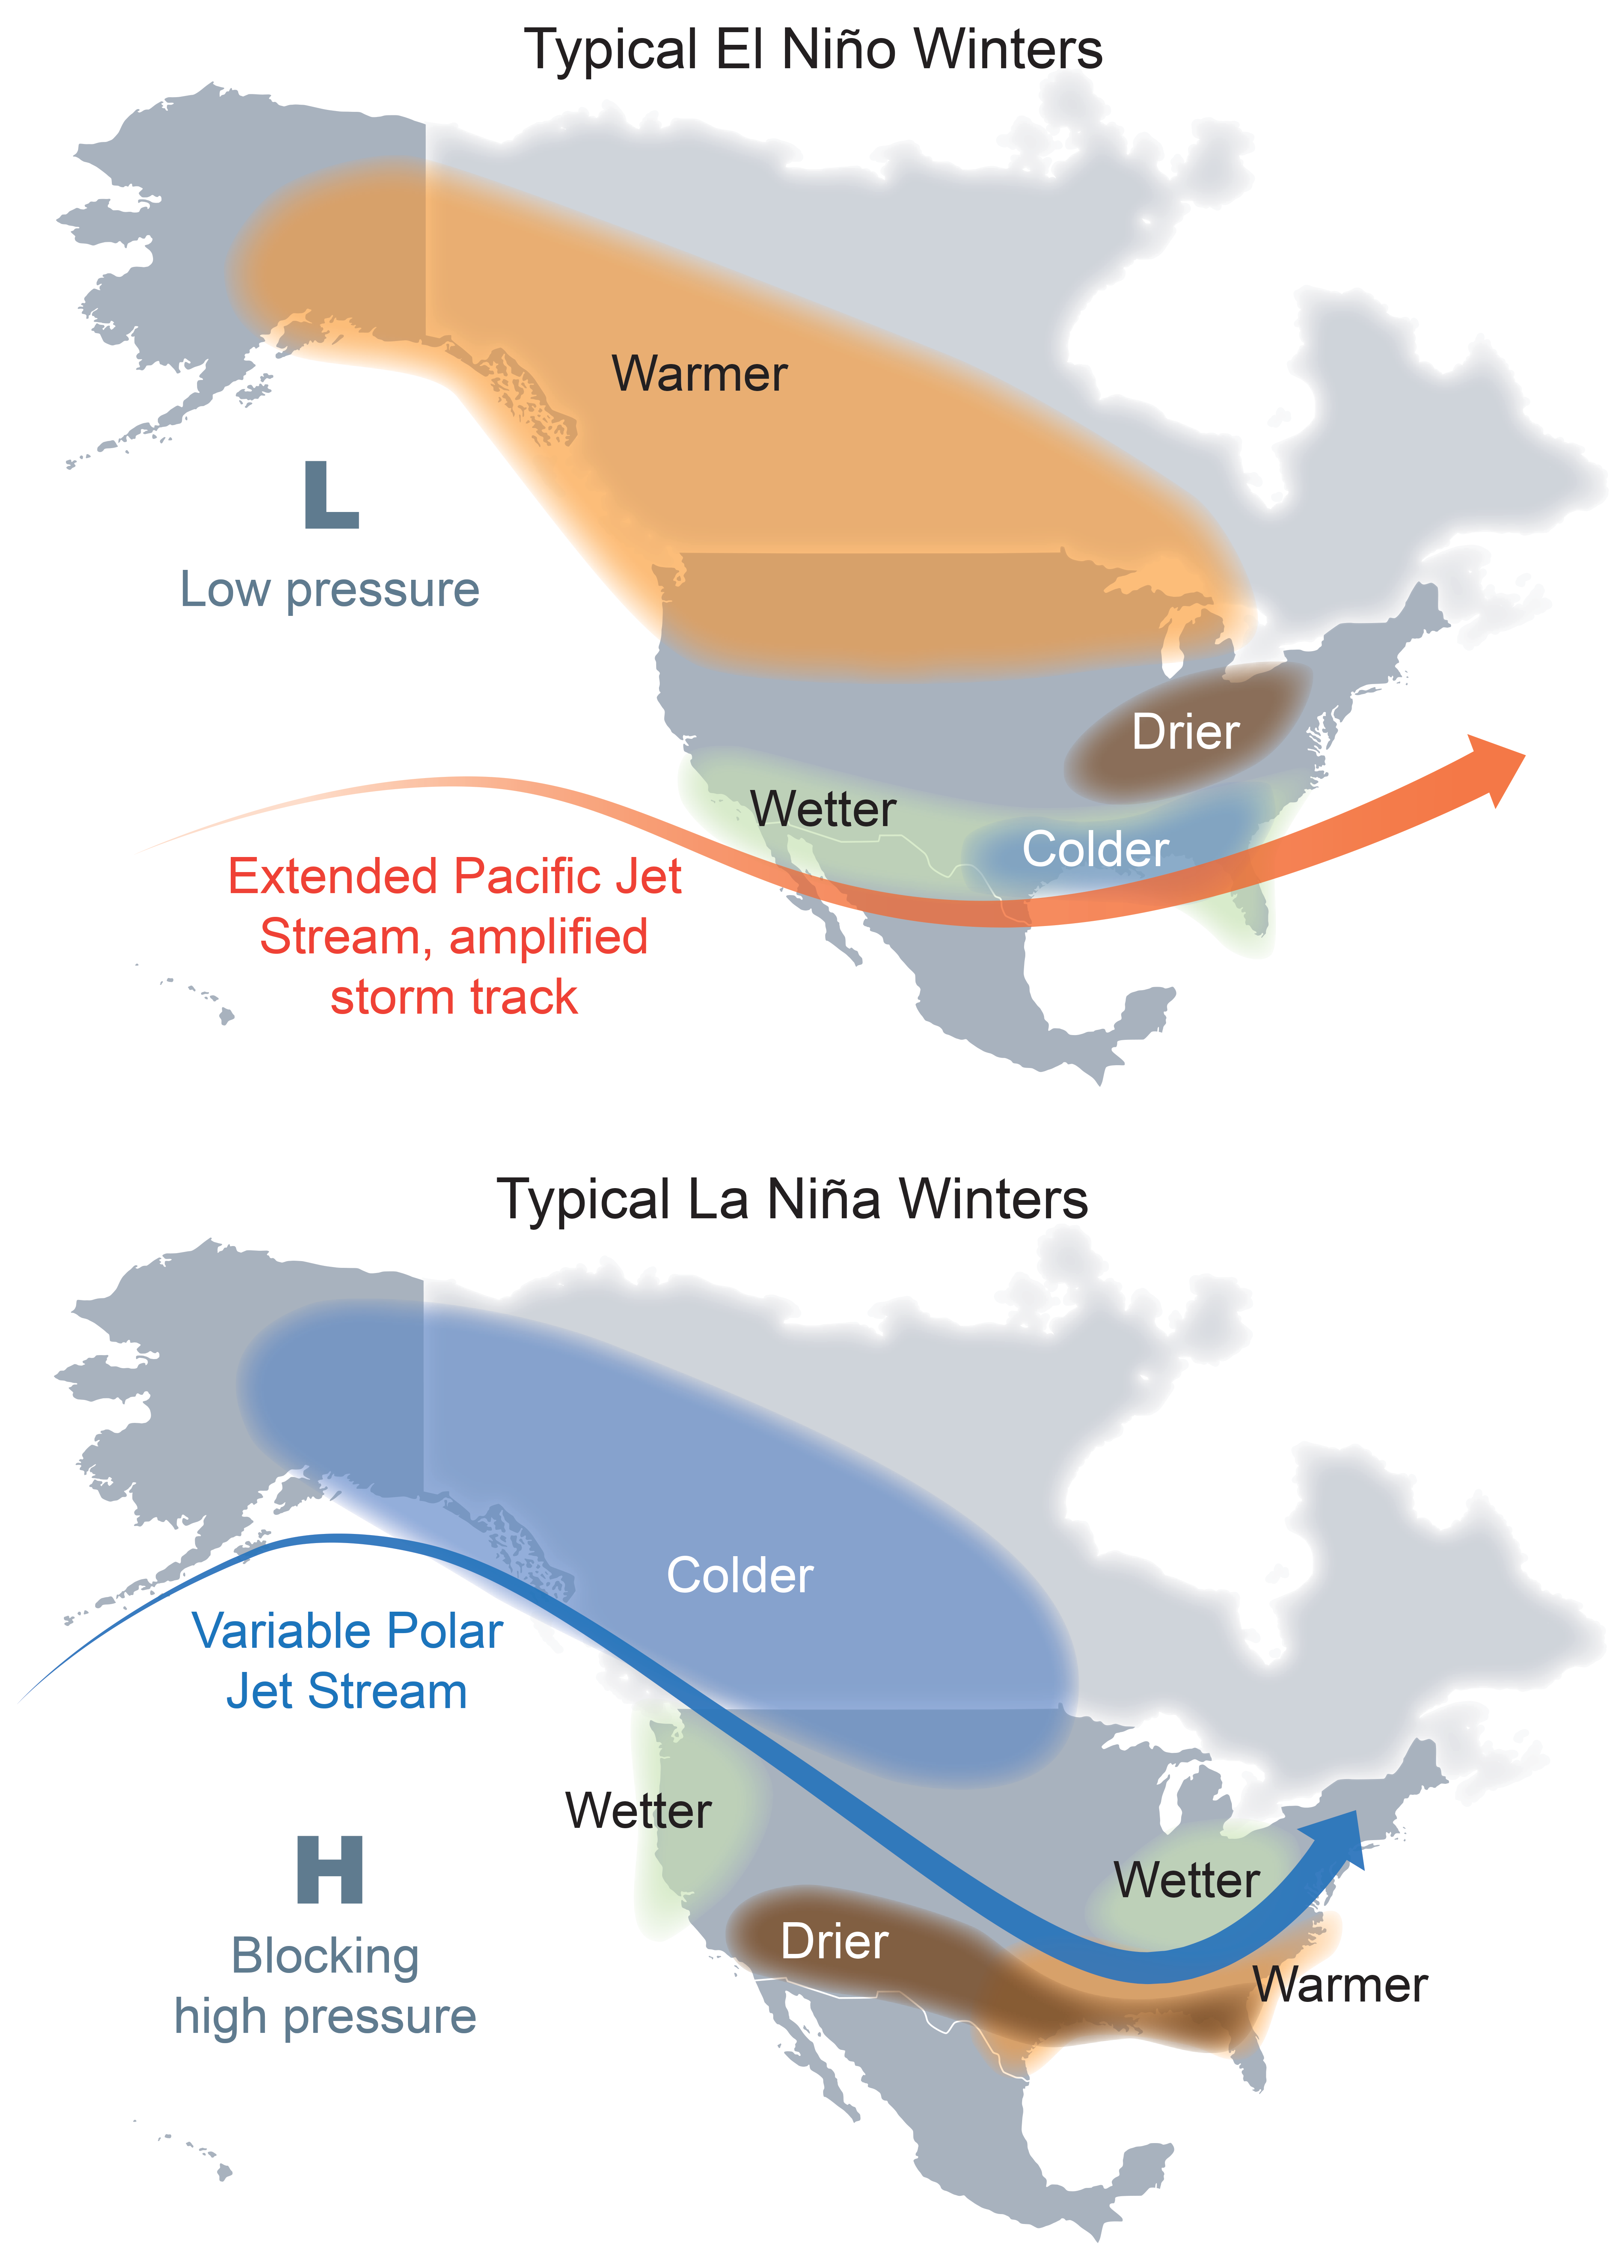
Climate variability refers to the natural changes in climate that fall within the observed range of extremes for a particular region, as measured by temperature, precipitation, and frequency of events. Drivers of climate variability include the El Niño–Southern Oscillation (ENSO) and other phenomena. ENSO is a quasi-periodic warming or cooling of the of the sea surface temperatures in the tropical eastern Pacific and is often referred to by its phase of El Niño (warm phase) or La Niña (cool phase). These different ENSO phases can have varying ecosystem and economic effects, especially in certain fishing communities, while also influencing weather worldwide (Figure A5.7). In the United States, El Niño conditions generally correspond with warmer than average sea surface and air temperatures along the West Coast, wetter conditions in the Southwest, cooler temperatures in the Southeast, and warmer conditions in the Northeast. In contrast, the La Niña phase of ENSO corresponds to cooler temperature in the U.S. Northwest and dryer and warmer conditions in the Southeast, along with increased upwelling along the West Coast.
Evidence from paleoclimate records suggests that there have been changes in the frequency and intensity of ENSO events in the past. Human-caused climate change might also affect the frequency and magnitude of ENSO events and can exacerbate or ameliorate regional ENSO impacts. For example, if there is a strong La Niña event that results in dry conditions in the Southwest, those conditions may be exacerbated by additional drying due to climate change. ENSO is a complex phenomenon, but new research is shedding light on the many factors influencing how climate change affects the ENSO cycle.13
Figure A5.7: El Niño/La Niña Cause Short-Term Changes in Weather Patterns
Temperature and Climate Projections
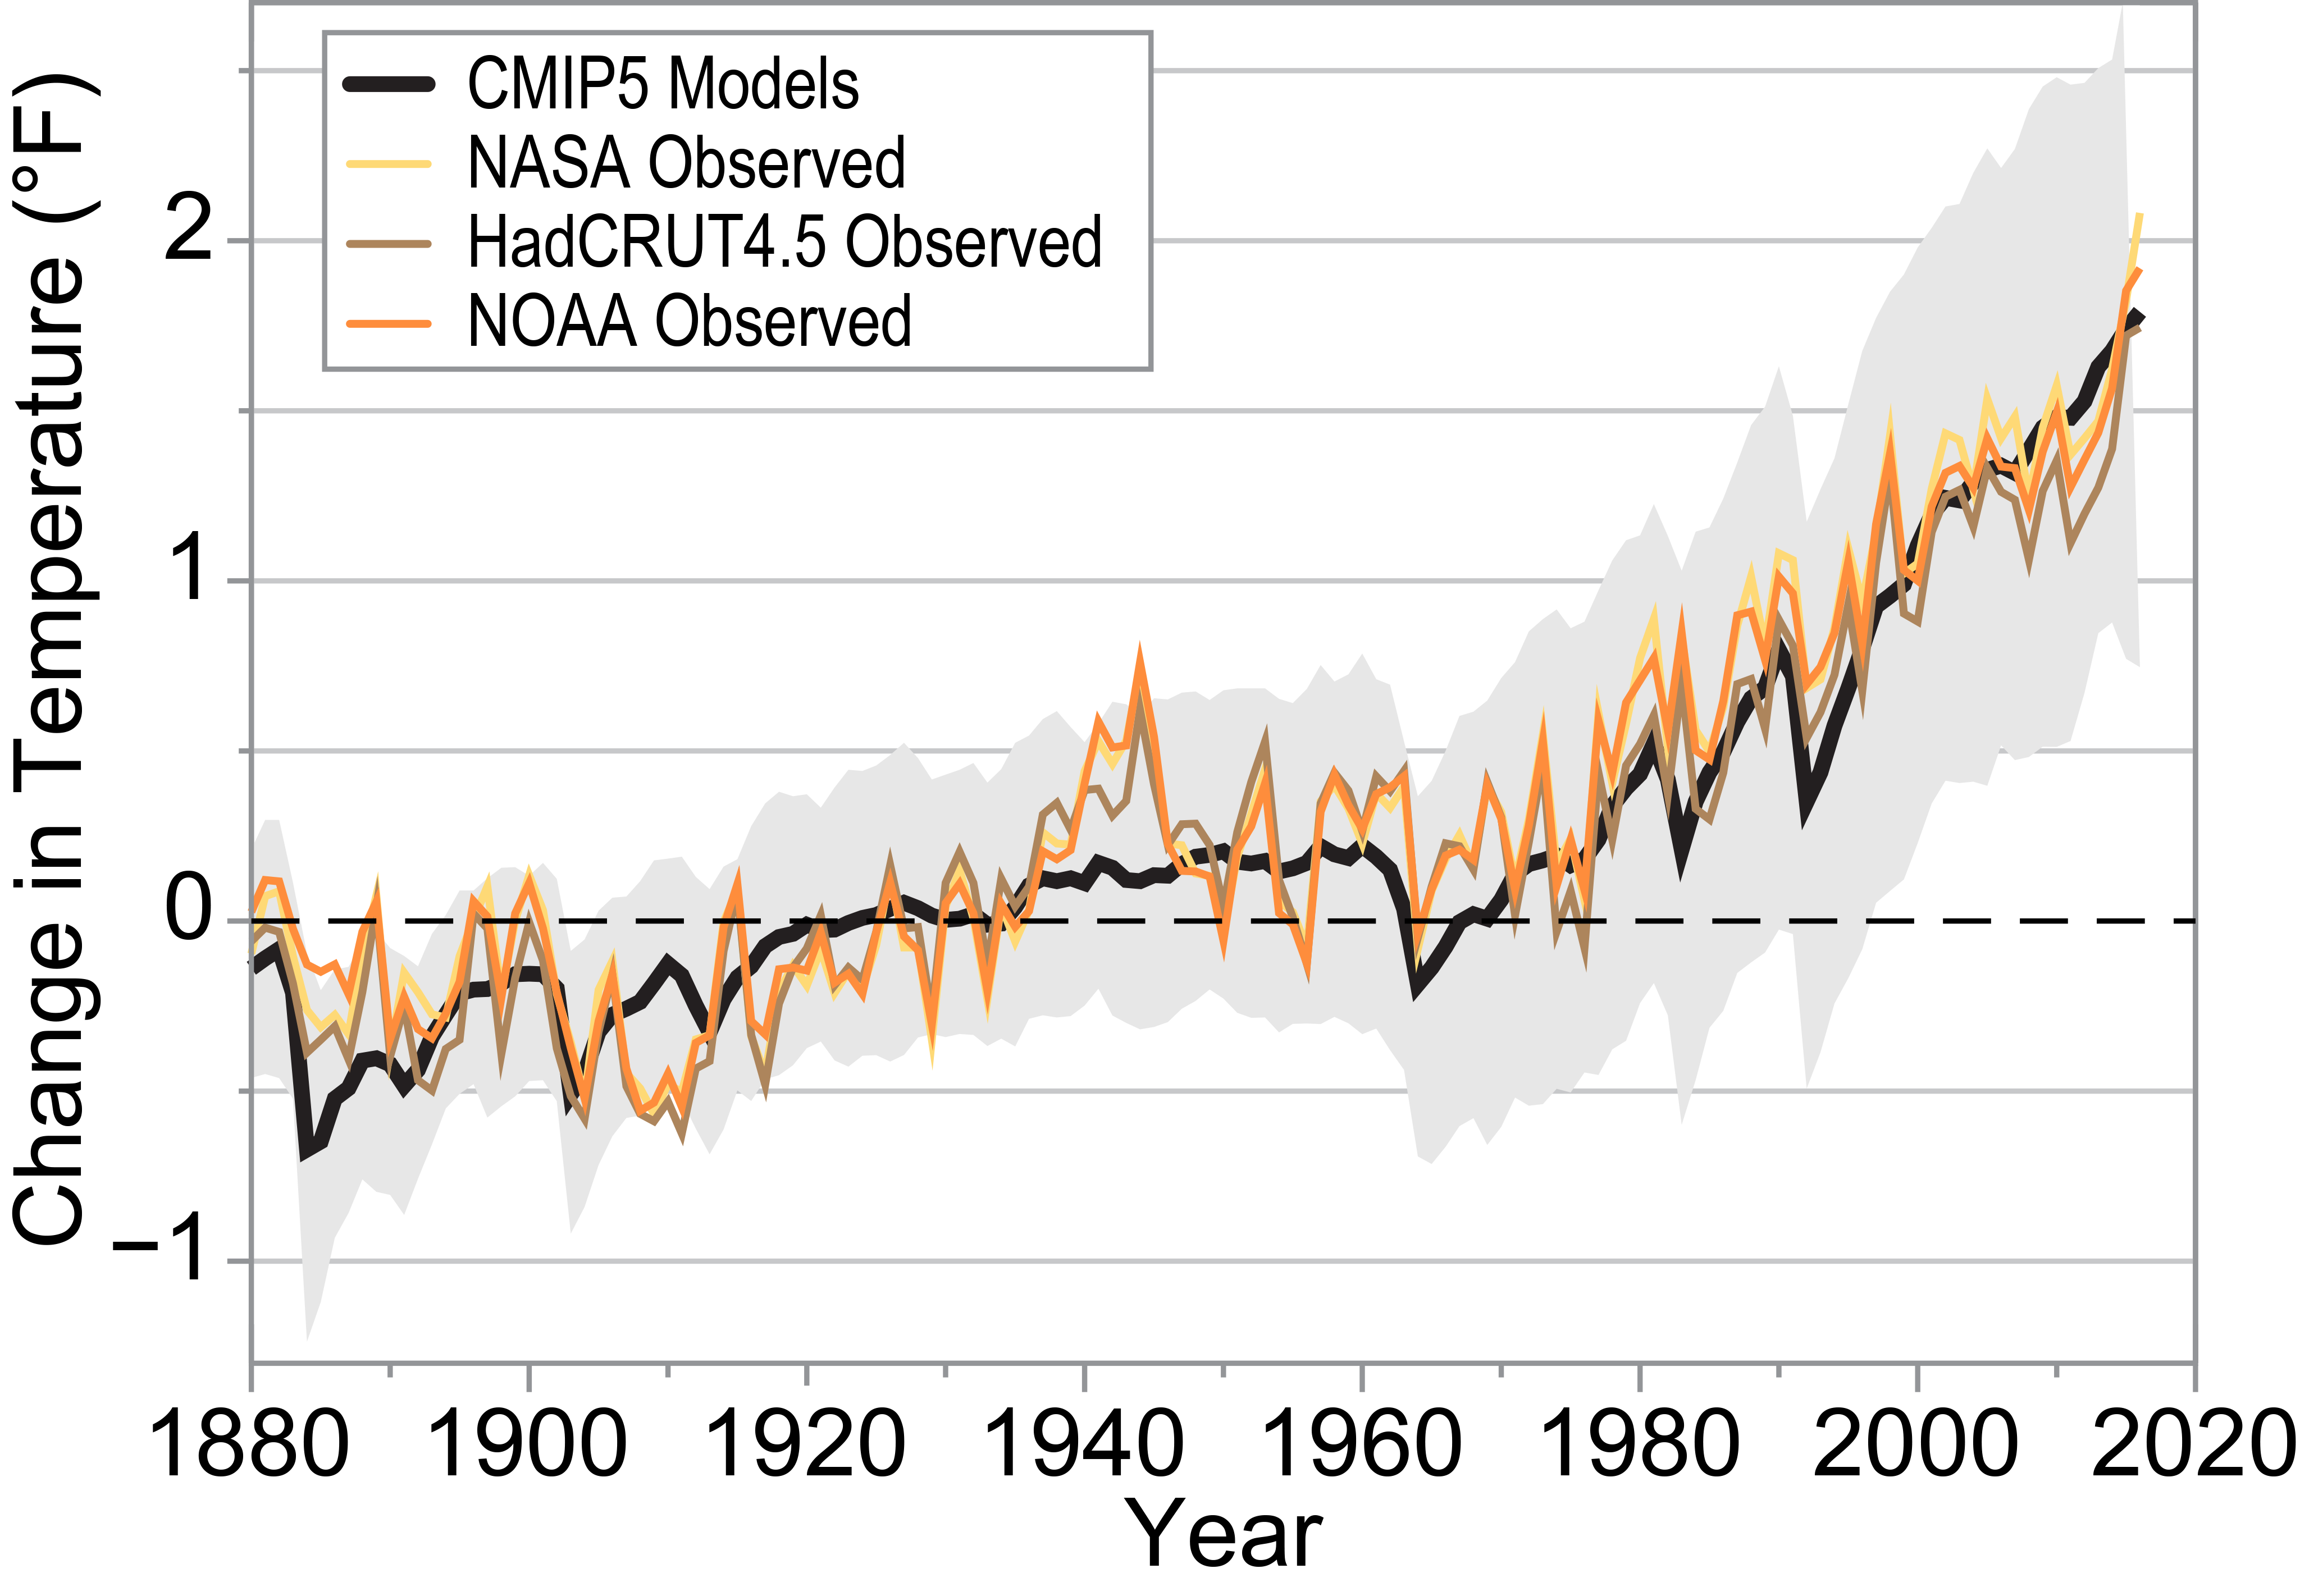
Global surface temperatures are measured by using data from weather stations over land and by ships and buoys over the ocean. Global surface temperature records date back more than 300 years in some locations, and near-global coverage has existed since the late 1800s. Multiple research groups have examined U.S. and global temperature records in great detail, taking into account changes in instruments, the time of observations, station location, and any other potential sources of error. Although there are slight differences among datasets—due to choices in data selection, analysis, and averaging techniques—these differences do not change the clear result that global surface temperature is rising.
8. What methods are used to record global surface temperatures and measure changes in climate?
Climate change is best measured by assessing trends over long periods of time (generally greater than 30 years), which means we need global surface temperature records that include data from before the satellite age. Scientists who obtain, digitize, and collate long-term temperature records take great care to ensure that any potentially skewed measurements—such as a change in instrument method or location or a change in the time of day a recording is made—do not affect the integrity of the dataset. Researchers rigorously examine the data to identify and adjust for any such effects before using it to evaluate long-term climate trends. Different choices in data selection, analysis, and averaging techniques by multiple independent research teams mean that each dataset varies slightly. Even with these variations, however, multiple independently produced results are in very good agreement at both global and regional scales: all global surface temperature datasets indicate that the vast majority of Earth’s surface has warmed since 1901 (Figure A5.8).
Scientists also consider other influences that could impact temperature records, such as whether data from thermometers located in cities are skewed by the urban heat island effect, where heat absorbed by buildings and asphalt makes cities warmer than the surrounding countryside. When determining climate trends, data corrections to these temperature records have adequately accounted for this effect. At the global scale, evidence of global warming over the past 50 years is still observed even if all of the urban stations are removed from the global temperature record. Studies have also shown that the warming trends of rural and urban areas that are in close proximity essentially match, even though the urban areas may have higher temperatures overall.14
Figure A5.8: Global Temperature Increase Shown in Multiple Datasets
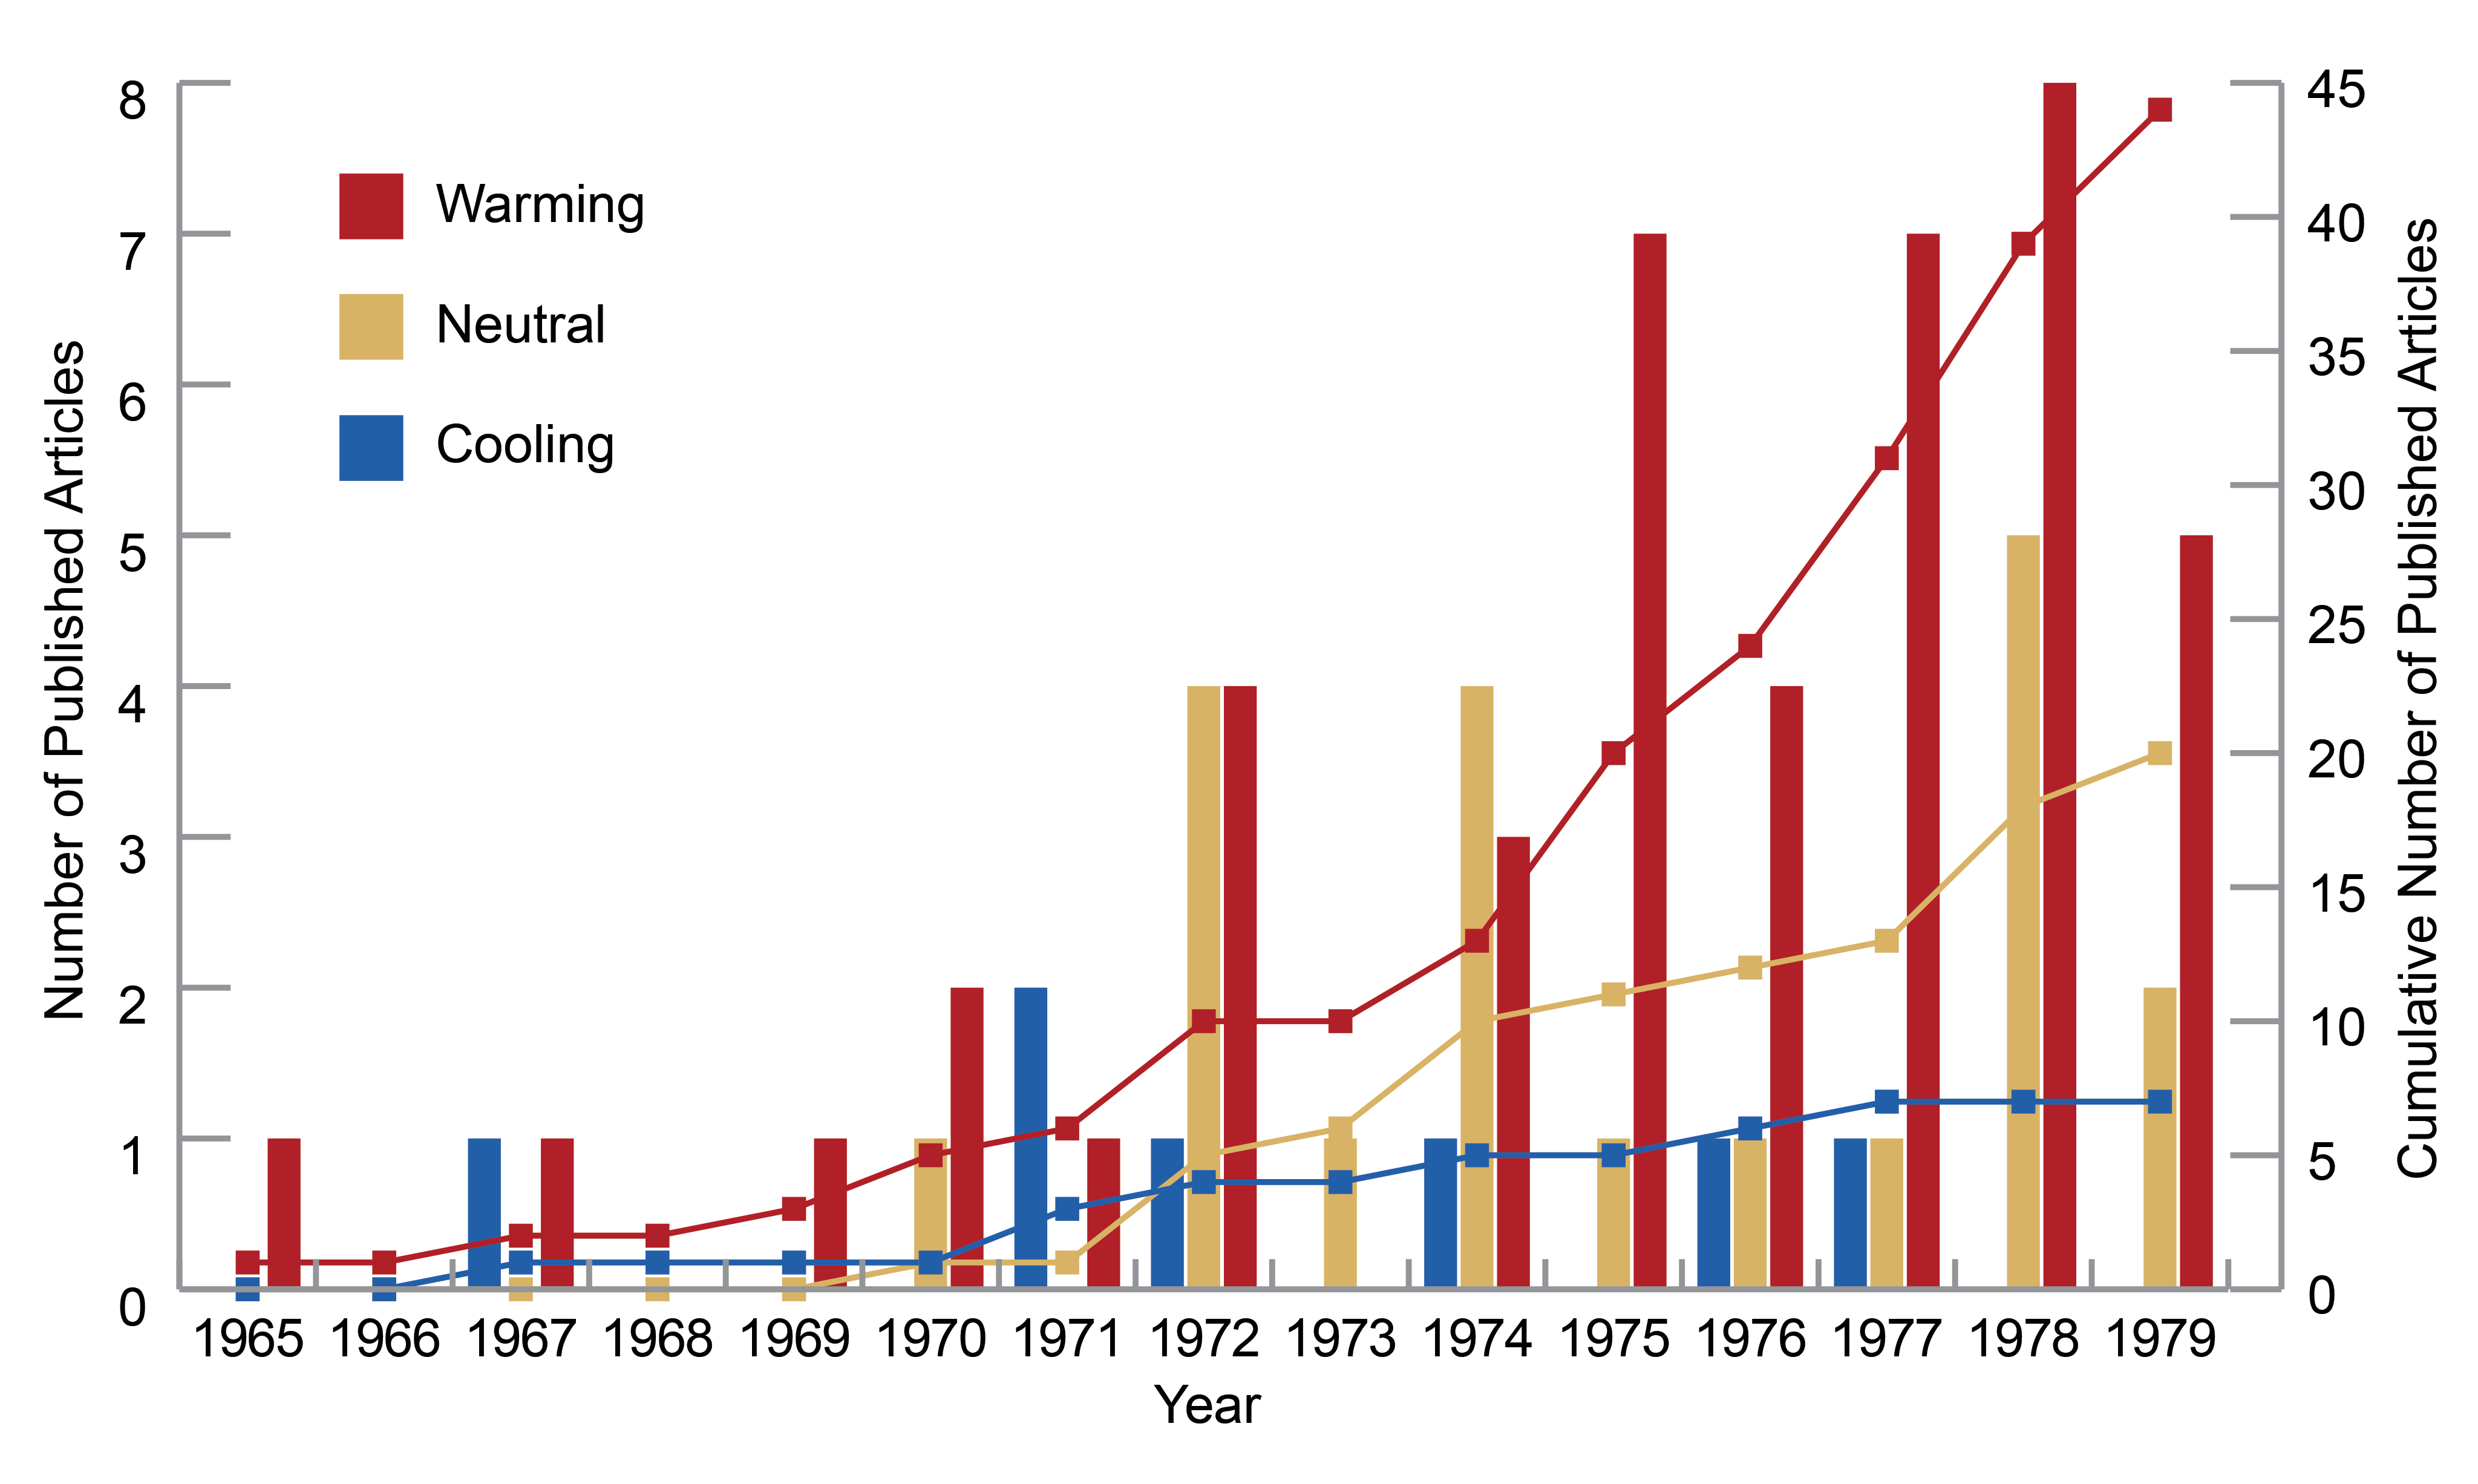
No. A review of the scientific literature from the 1970s shows that the broad climate science community did not predict “global cooling” or an “imminent” ice age. On the contrary, even then, discussions of human-related warming dominated scientific publications on climate and human influences.
9. Were there predictions of global cooling in the 1970s?
Scientific understanding of what are called the Milankovitch cycles (cyclical changes in Earth’s orbit that can explain the onset and ending of ice ages) led a few scientists in the 1970s to contemplate that the current warm interglacial period might be ending soon, leading to a new ice age over the next few centuries. These few speculations were picked up and amplified by the media. But at that time there were far more scientific articles describing how warming would occur from the increase in atmospheric concentrations of greenhouse gases from human activities, including the burning of fossil fuels (Figure A5.9). The latest information suggests that if Earth’s climate was being controlled primarily by natural factors, the next cooling cycle would begin sometime in the next 1,500 years. However, humans have so altered the composition of the atmosphere that the next ice age has likely now been delayed. That delay could potentially be tens of thousands of years.6
Figure A5.9: Published Climate Change Research Papers
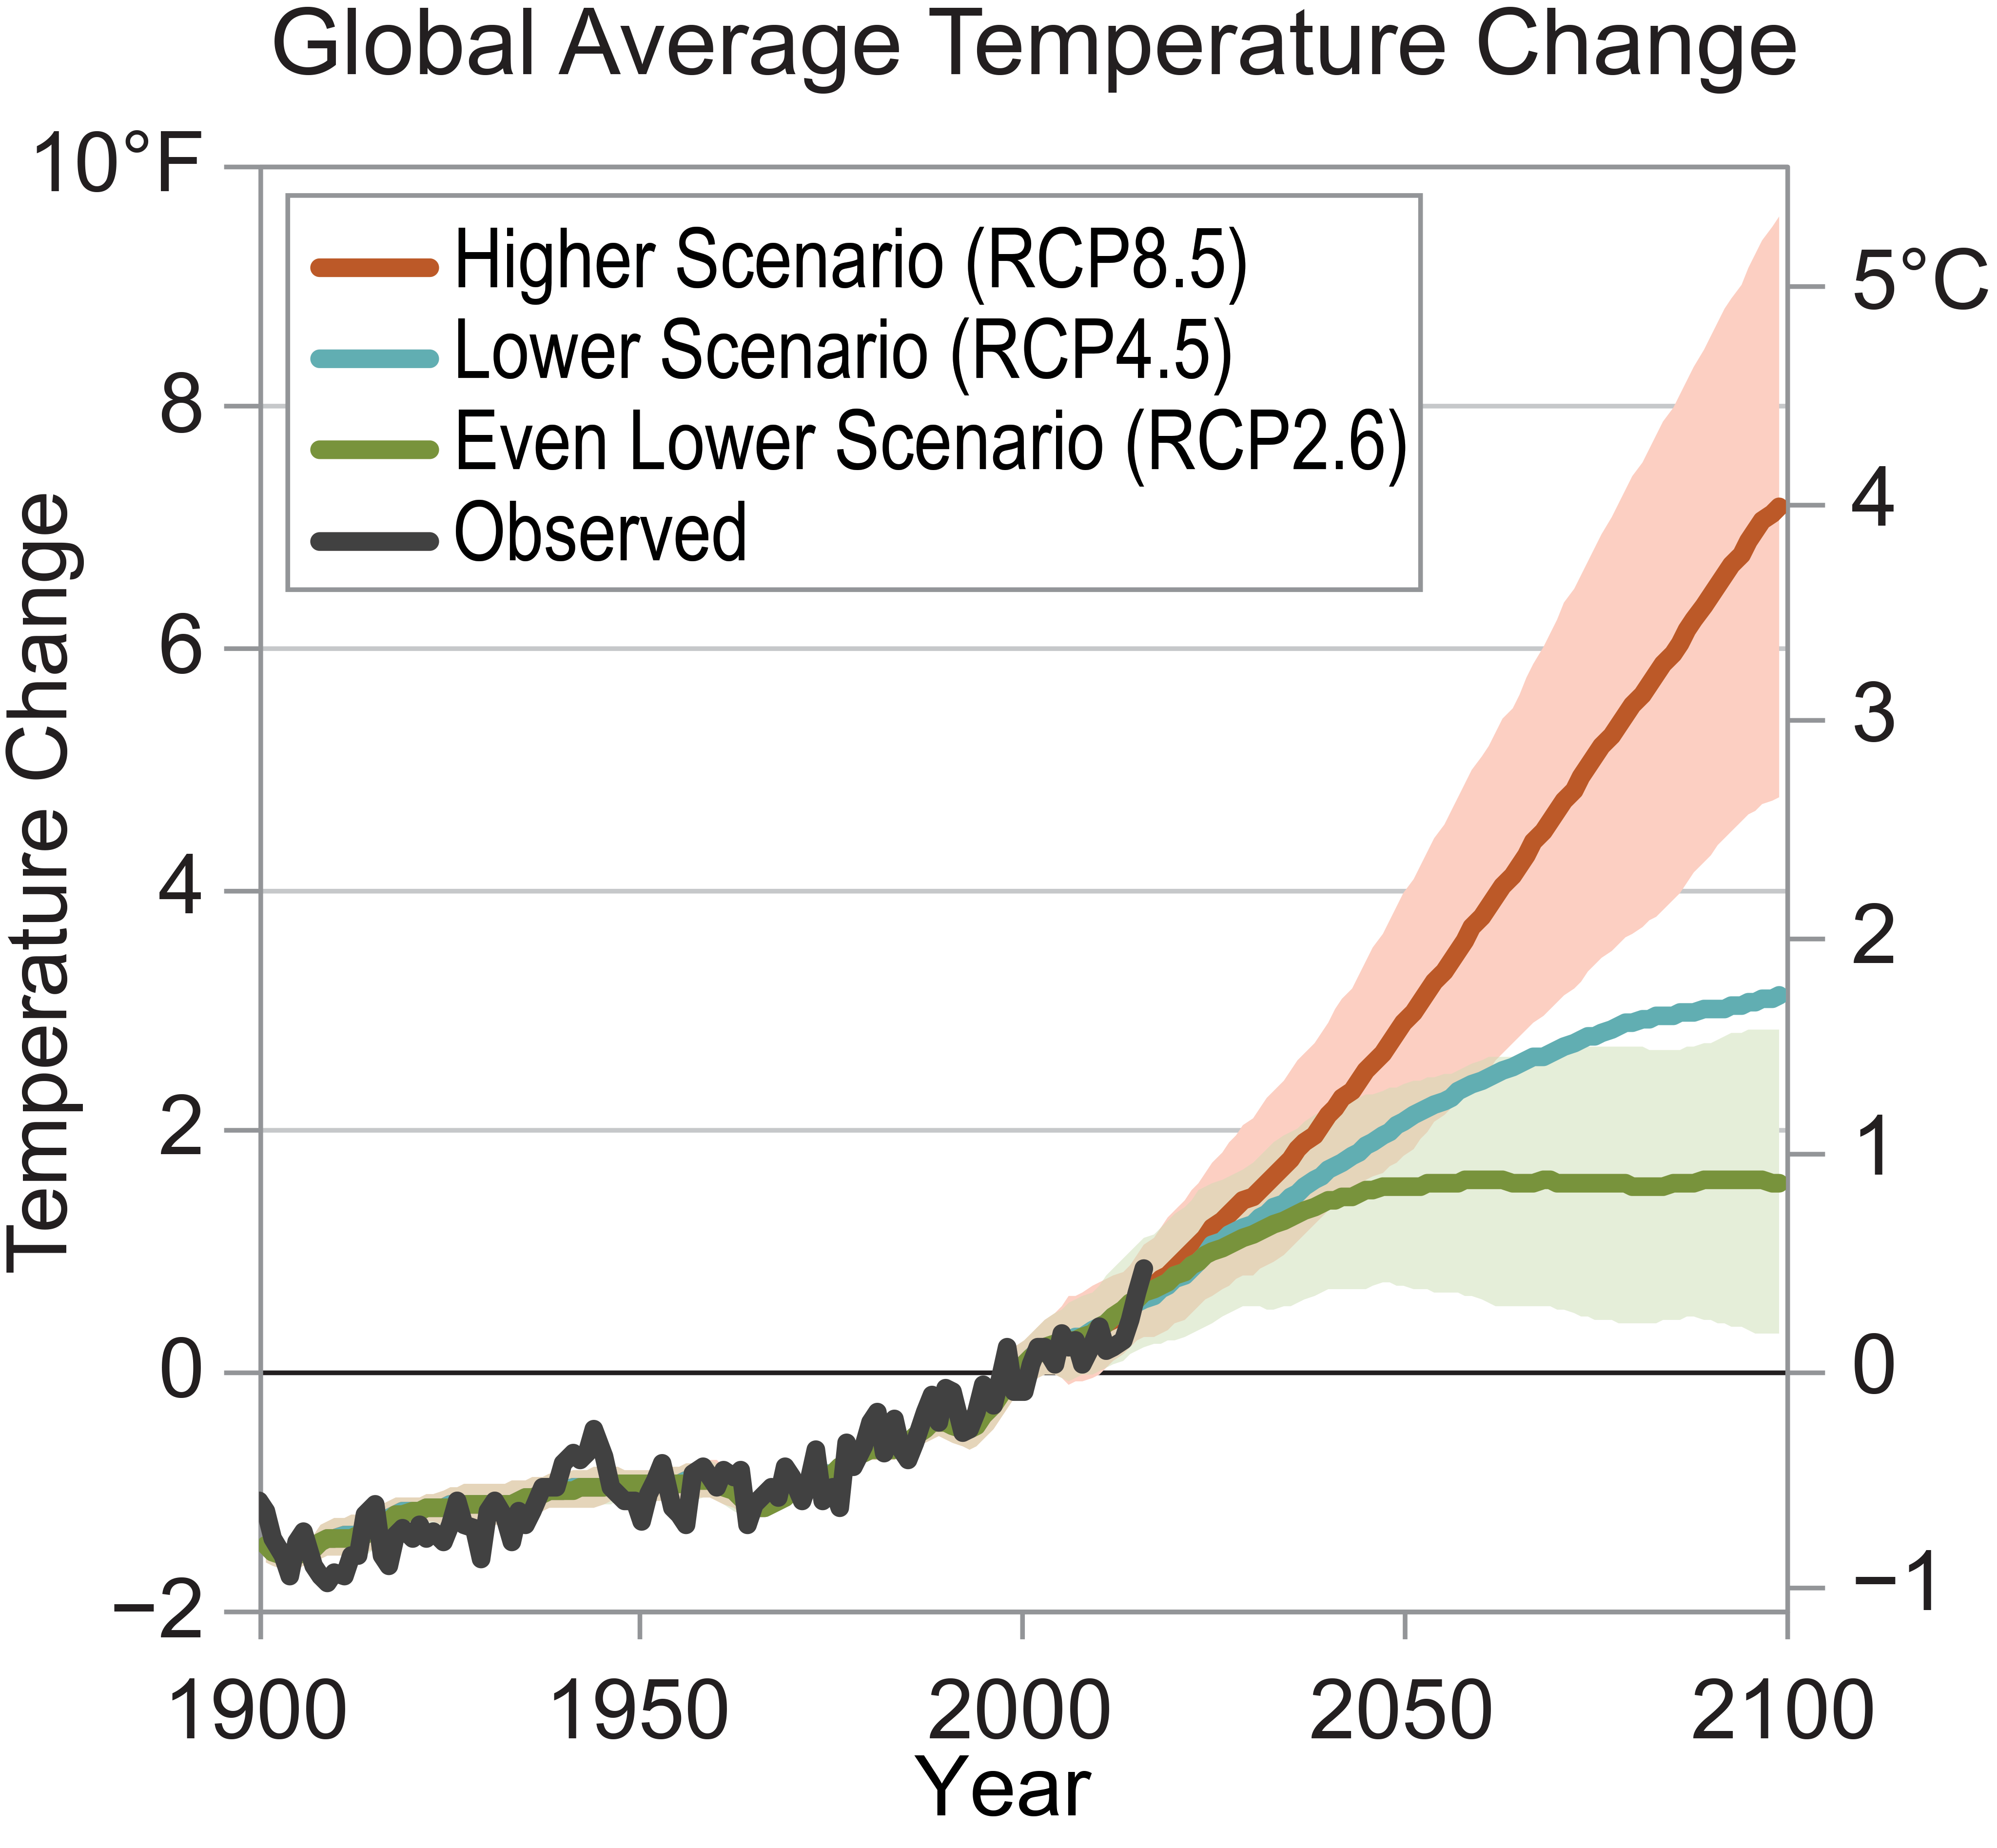
Our world will continue to warm in the future because of historic emissions of greenhouse gases (GHGs), but the amount of warming will depend largely on the level of future emissions of GHGs and the choices humans make. If humans continue burning fossil fuels at or above our current rate through the end of the century, scientists project Earth will warm about 9ºF, relative to preindustrial times (prior to 1750). Precipitation is projected to still be seasonally and regionally variable, but on average, projections show high-latitude areas getting wetter and subtropical areas getting drier. The frequency and intensity of very heavy precipitation are expected to increase, increasing the likelihood of flooding. Climate change will not affect all places in the same way or to the same degree but will vary at regional levels.
10. How are temperature and precipitation patterns projected to change in the future?
In the coming decades, scientists project that global average temperature will continue to increase (Ch. 2: Climate), although natural variability will continue to play a significant role in year-to-year changes. Sizeable variations from global average changes are possible at the regional level. Even if humans drastically reduce levels of GHG emissions, near-term warming will still occur because there is a lag in the temperature response to changes in atmospheric composition (Figure A5.10).
Over the next couple decades, natural variability and the response of Earth’s climate system to historic emissions will be the primary determinants of observed warming. After about 2050, however, the rate and amount of emissions of GHGs released by human activities, as well as the response of Earth’s climate system to those emissions, will be the primary determining factors in changes in global and regional temperature (Figure A5.13) (see also Ch. 2: Climate). Efforts to rapidly and significantly reduce emissions of GHGs can still limit the global temperature increase to 3.6ºF (2ºC) by the end of the century relative to preindustrial levels.17
Precipitation patterns are also expected to continue to change throughout this century and beyond. The trends observed in recent decades are expected to continue, with more precipitation projected to fall in the form of heavier precipitation events.3 Such events increase the likelihood of flooding, even in drought-prone areas. As with increases in global average temperature, large-scale shifts towards wetter or drier conditions and the projected increases in heavy precipitation are expected to be greater under higher GHG emissions scenarios (for example, RCP8.5) versus lower ones (for example, RCP4.5). Projected warming is also expected to lead to an increase in the fraction of total precipitation falling as rain rather than snow, which reduces snowpack on the margins of areas that now have reliable snowpack accumulation during the cold season (see, for example, Ch. 24: Northwest, KM 2).
Figure A5.10: Observed and Projected Changes in Global Temperature
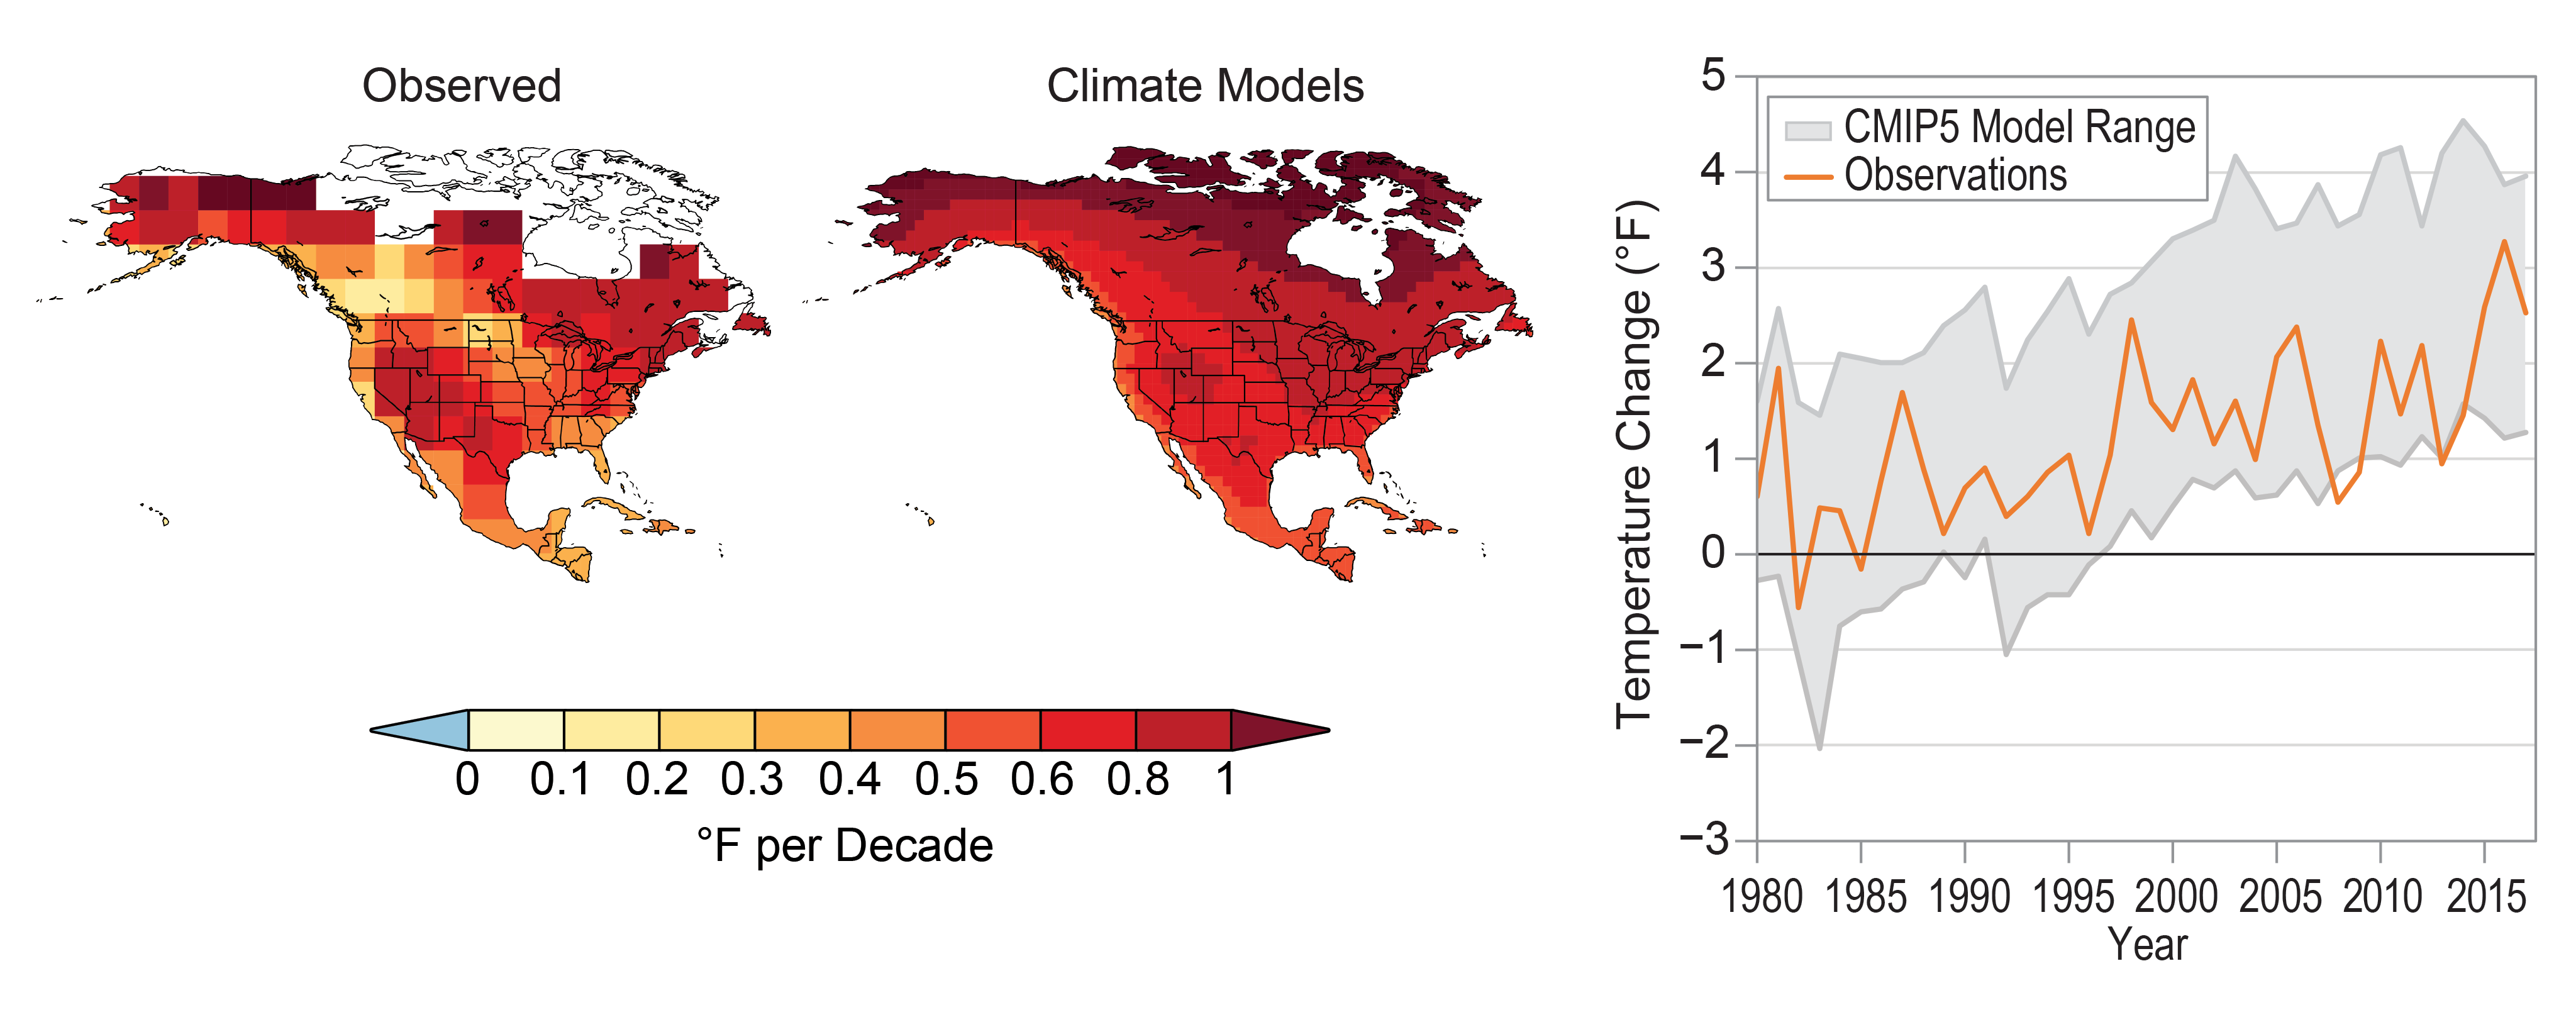
Global climate models enable scientists to create “virtual Earths,” where they can analyze causes and effects of past changes in temperature, precipitation, and other climate variables. Today’s climate models can accurately reproduce broad features of past and present climate, such as the location and strength of the jet stream, the spatial distribution and seasonal cycle of precipitation, and the natural occurrence of extreme weather events, such as heat and cold waves, droughts and floods, and hurricanes. They also can reproduce historic natural cycles, such as the periodic occurrence of ice ages and interglacial warm periods, as well as the human-caused warming that has occurred over the last 50 years. While uncertainties remain, scientists have confidence in model projections of how climate is likely to change in the future in response to key variables, such as an increase in human-caused emissions of greenhouse gases, in part because of how accurately they can represent past climate changes.
11. How do computers model Earth’s climate?
Climate models are based on equations that represent fundamental laws of nature and the many processes that affect Earth’s climate system. By dividing the atmosphere, land, and ocean into smaller spatial units to solve the equations, climate models capture the evolving patterns of atmospheric pressures, winds, temperatures, and precipitation. Over longer time frames, these models simulate wind patterns, high- and low-pressure systems, ocean currents, ice and snowpack accumulation and melting, soil moisture, extreme weather occurrences, and other environmental characteristics that make up the climate system (Figure A5.11).18
Some important processes, including cloud formation and atmospheric mixing, are represented by approximate relationships, either because the processes are not fully understood or they are at a scale that a model cannot directly represent. These approximations lead to uncertainties in model simulations of climate. Approximations are not the only uncertainties associated with climate models, as discussed in the FAQ “What are key uncertainties when projecting climate change?”
Figure A5.11: Comparison of Climate Models and Observed Temperature Change
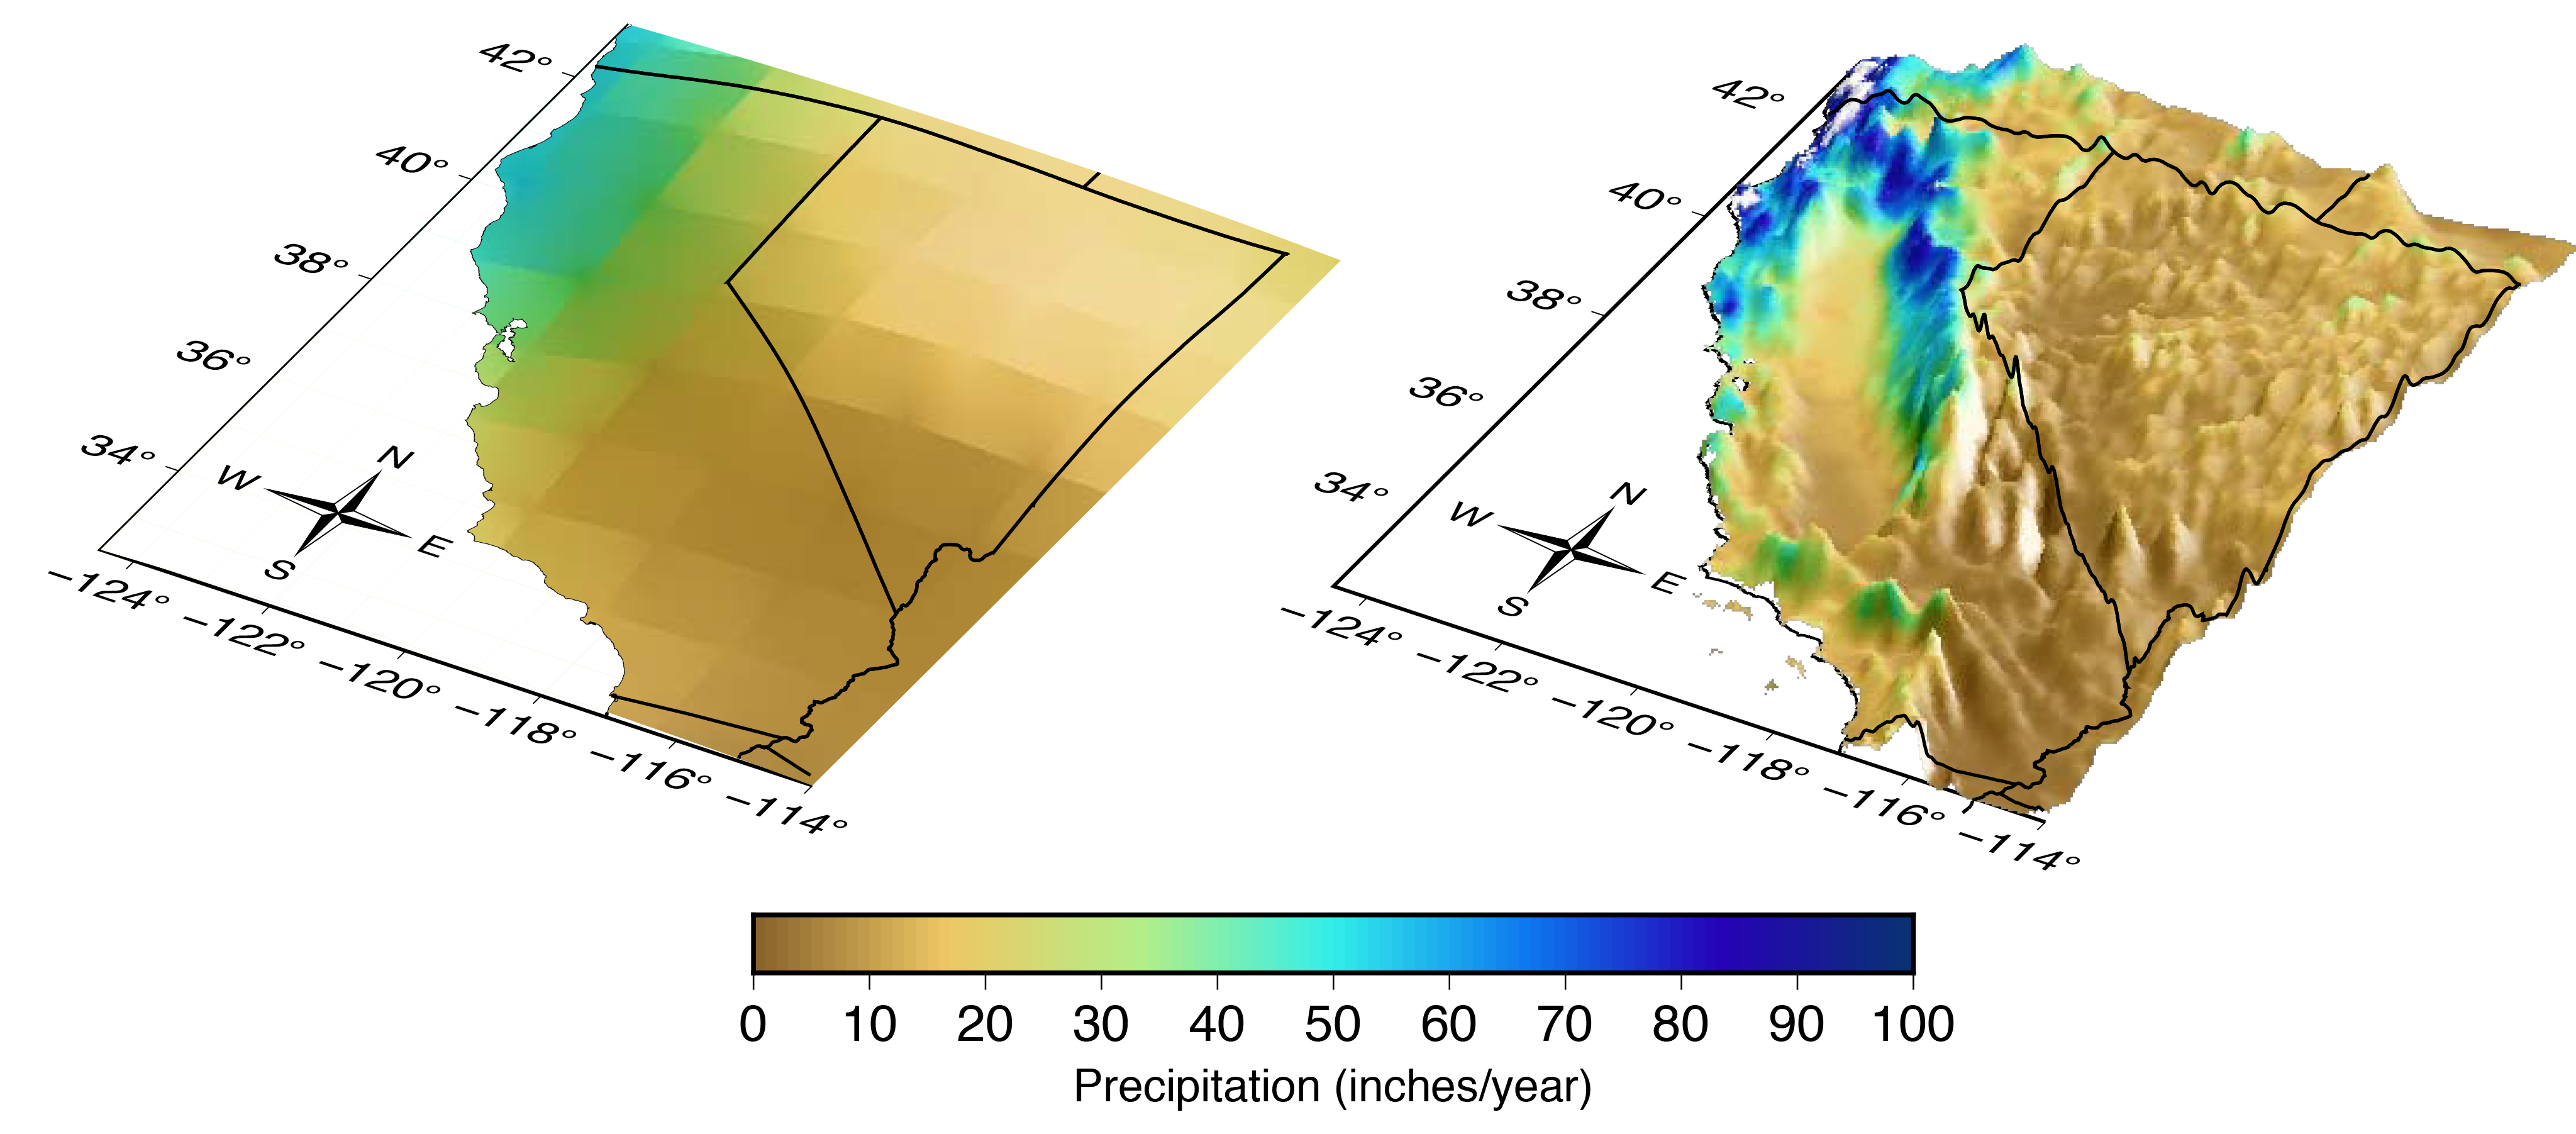
Yes, though there are limitations. With advances in computing power, the future effects of climate change can be projected more accurately for local communities. Local high-resolution (downscaled) climate modeling can be used to produce data at a scale of 1–20 miles. These downscaled projections show climate-related impacts at the local level and can be an important tool for community planners and decision-makers.
12. Can scientists project the effects of climate change for local regions?
One significant research focus recently has been to develop models of climate impacts on a relatively small geographic scale. Most global climate projections use grid units that may be too coarse to properly represent mountains, coastlines, and other important features of a local landscape. Recently, two different approaches have been used by scientists to project local climate conditions.
The first is a statistical approach that uses local observations in conjunction with global models to project future changes. The local observations required for this approach are available only for limited regions and for a few climate variables (mainly temperature and precipitation; Figure A5.12).
The second method is a so-called dynamical approach that uses an additional high-resolution computer model—similar to a weather prediction model— to account for complex topography and varying land cover that can impact climate on the local level. High-resolution dynamical models are complete enough to simulate numerous climate variables (temperature, precipitation, winds, humidity, surface sunlight, etc.) and do not require the local observations required for the statistical approach. However, these models require an immense amount of computing power. Today’s most powerful supercomputers enable climate scientists to examine the effects of climate change in ways that were impossible just five years ago. Over the next decade, computer speeds are predicted to increase 100-fold or more, improving climate projections and models on both the global and local levels.
It should also be noted that both statistical and dynamical approaches have biases and errors that, when combined with uncertainties from global model simulations, can reduce the level of confidence in these more localized projections (see Hayhoe et al. 201718 for more details).
Figure A5.12: Climate Modeling for Smaller Regions
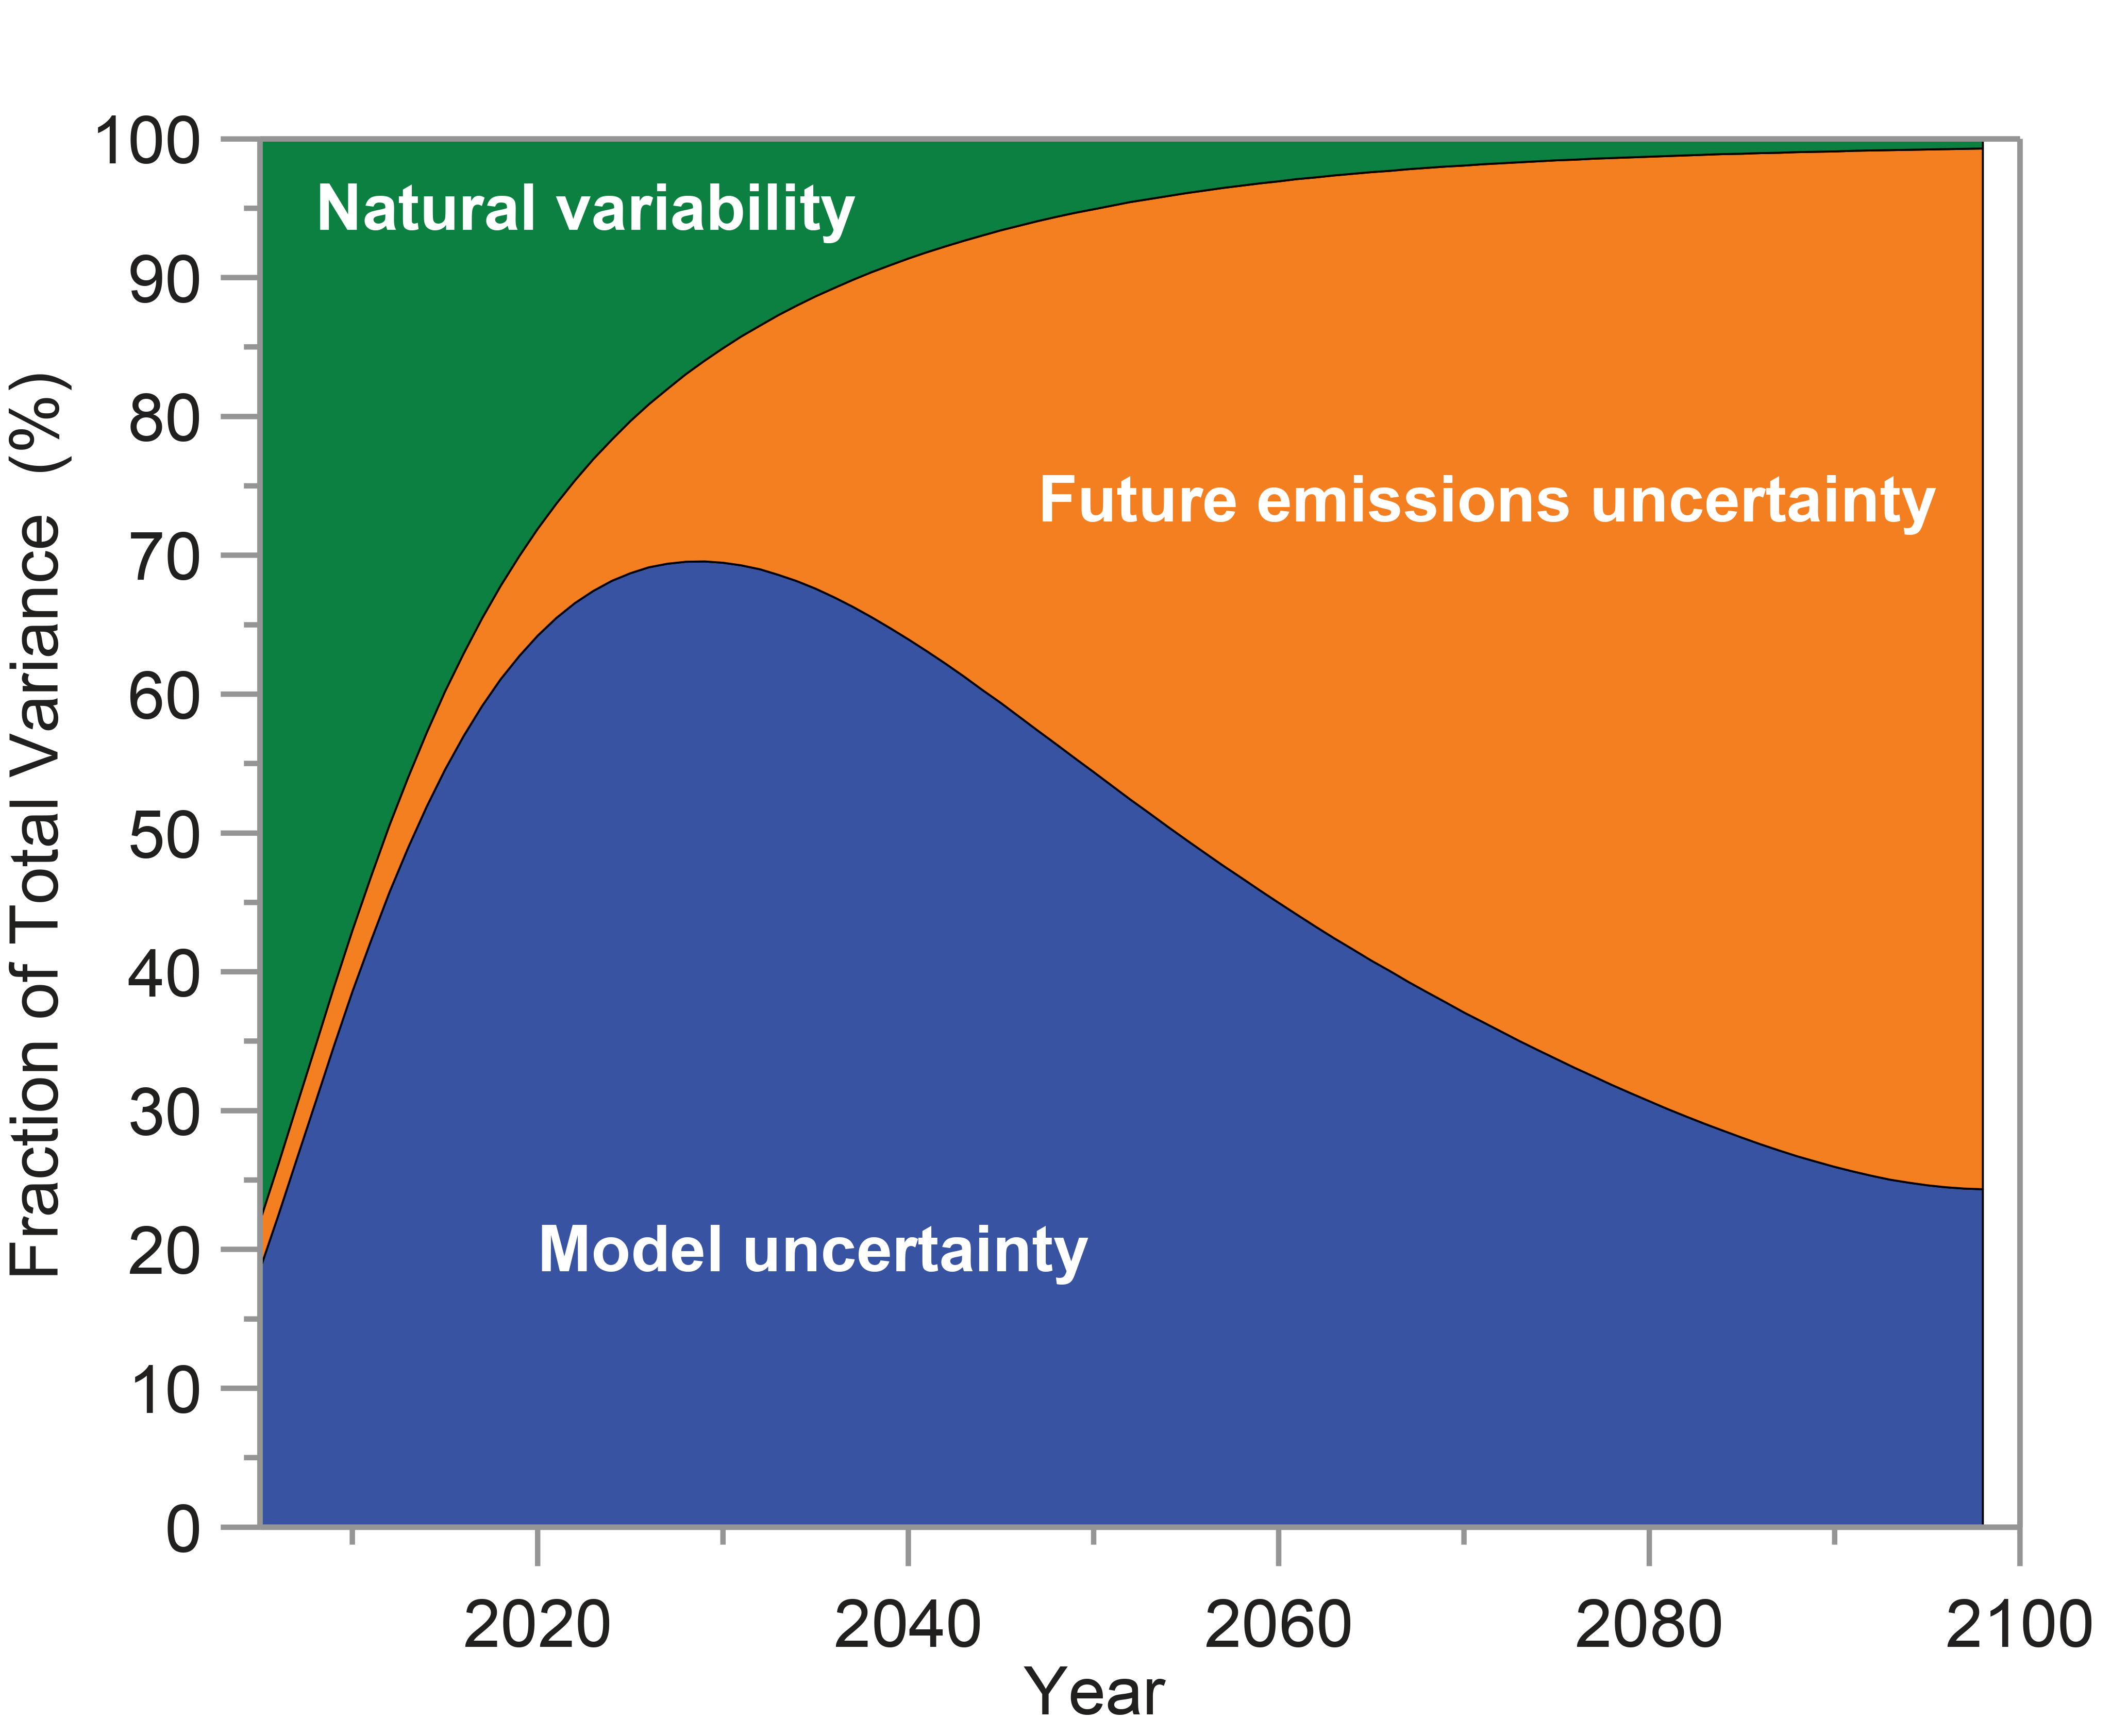
The precise amount of future climate change that will occur over the rest of this century is uncertain, mainly due to uncertainties in emissions, natural variability, and differences in scientific models.
13. What are key uncertainties when projecting climate change?
First, projections of future climate changes are usually based on scenarios (or sets of assumptions) regarding how future emissions may change due to changes in population, energy use, technology, and economics. Society may choose to reduce emissions or continue on a pathway of increasing emissions. The differences in projected future climate under different scenarios are generally small for the next few decades. By the second half of the century, however, human choices, as reflected in these scenarios, become the key determinant of future climate change (Figure A5.13).
A second source of uncertainty is natural variability, which affects the climate over timescales from months to decades. These natural variations are largely unpredictable, such as a volcanic eruption, and are superimposed on the warming from increasing greenhouse gases (GHGs).
A third source of uncertainty involves limitations in our current scientific knowledge. Climate models differ in the way they represent various processes (for example, cloud properties, ocean circulation, and aerosol effects). Additionally, climate sensitivity, or how much the climate will warm with a given increase in GHGs (often a doubling of GHG from preindustrial levels), is still a major source of uncertainty. As a result, different models produce small differences in projections of global average change. Scientists often use multiple models to account for the variability and represent this as a range of projected outcomes.
Finally, there is always the possibility that there are processes and feedbacks not yet being included in projections of climate in the future. For example, as the Arctic warms, carbon trapped in permafrost may be released into the atmosphere, increasing the initial warming due to human-caused emissions of GHGs, or an ice sheet may collapse, leading to faster than expected sea level rise.
However, for a given future scenario, the amount of future climate change can be specified within plausible bounds, with those bounds determined not only from the differences in how climate responds to a doubling of GHG concentrations among models but also by utilizing information about climate changes in the past (see Hayhoe et al. 201718 for more details).
Figure A5.13: Key Uncertainties in Temperature Projections
Our world is warming overall, but temperatures are not increasing at the same rate everywhere. The average global temperature is projected to continue increasing throughout the remainder of this century due to greenhouse gas (GHG) emissions from human activities. Generally, high latitudes are expected to continue warming more than lower latitudes; coastal and island regions are expected to warm less than interior continent regions.
14. Is it getting warmer everywhere at the same rate?
Temperature changes at a given location are a function of multiple factors, including global and local forces, and both human and natural influences. Though Earth’s average temperature is rising, some locations could be cooling due to local factors. In some places, including the U.S. Southeast, temperatures do not show a warming trend over the last century as a whole, although they have been increasing since the 1960s (Ch. 19: Southeast). Possible causes of the observed lack of warming in the Southeast during the 20th century include increased cloud cover and precipitation, increases in the presence of fine particles (called aerosols) in the atmosphere, expanding forests, decreases in the amount of heat conducted from land due to increases in irrigation, and multidecadal variability in sea surface temperatures in both the North Atlantic and the tropical Pacific Oceans. At smaller geographic scales and time intervals, the relative influence of natural variations in climate compared to the human contribution is larger than at the global scale. A lack of warming or a decrease in temperature at an individual location does not negate the fact that, overall, the planet is warming.
Alaska, in contrast to the U.S. Southeast, has been warming twice as fast as the global average since the middle of the 20th century (Ch. 26: Alaska). Statewide average temperatures for 2014–2016 were notably warmer as compared to the last few decades, with 2016 being the warmest on record. Daily record high temperatures in the contiguous United States are now occurring twice as often as record low temperatures. In Alaska, starting in the 1990s, record high temperatures occurred three times as often as record lows, and in 2015, an astounding nine times as often (Ch. 26: Alaska).
Because Earth’s climate system still has more energy entering than leaving, global warming has not yet equilibrated to the load of increased GHGs that have already accumulated in the atmosphere (for example, the oceans are still warming over many layers from surface to depth). Some GHGs have long lifetimes (for example, carbon dioxide can reside in the atmosphere for a century or more). Thus, even if the emissions of GHGs were to be sharply curtailed to bring them back to natural levels, it is estimated that Earth is committed to continued warming of more than 1°F by 2100.
At the global scale, some future years will be cooler than the preceding year; some decades could even be cooler than the preceding decade (Figure A5.14). Brief periods of faster temperature increases and also temporary decreases in global temperature can be expected to continue into the future as a result of natural variability and other factors. Nonetheless, each successive decade in the last 30 years has been the warmest in the period of reliable instrumental records (going back to 1850; Figure A5.15). In fact, the rate of warming has accelerated in the past several decades, and 17 of the 18 warmest years have occurred since 2001 (see FAQ “What do scientists mean by the ‘warmest year on record’?”). Based on this historical record and assessed scenarios for the future, it is expected that future global temperatures, averaged over climate timescales of 30 years or more, will be higher than preceding periods as a result of emissions of CO2 and other GHGs from human activities (Ch 2: Climate).
Figure A5.14: Temperature Change Varies by Region

Figure A5.15: Average Global Temperature Is Increasing
When scientists declare it the “warmest year on record,” they mean it’s the warmest year since modern global surface temperature record keeping began in 1880. Global temperature data from NASA show that 2016 marked the sixth time this century that a new record high annual average temperature was set (along with 2002, 2005, 2010, 2014, and 2015) and that 17 of the 18 warmest years have occurred since 2001.
15. What do scientists mean by the “warmest year on record”?
The “warmest year on record” means it is the warmest year in more than 130 years of modern record keeping of global surface temperature. Prior to 1880, observations did not cover a large enough area of Earth’s surface to enable an accurate calculation of the global average temperature. To calculate the value in recent times, scientists evaluate data from roughly 6,300 stations around the world, on land, ships, and buoys.
The year the last National Climate Assessment was published, 2014, was the warmest year on record at the time, but it was surpassed by 2015, which was then surpassed by 2016. Data from NASA shows that 17 of the 18 warmest years have occurred since 2001, and the 6 warmest years on record have occurred this century (Figure A5.16). However, the global surface temperature is affected by natural variability in addition to climate change, so it is not expected that each year will set a new temperature record.
Figure A5.16: Record Warm Years
The range of possible weather conditions at a specific location on any given day can vary considerably. The climate varies far less for that same location, because it is a measure of weather conditions averaged over 30 years or more. Because the range of possible climate conditions at a given location is much smaller than the range of possible weather conditions, scientists are able to project climate conditions decades into the future.
16. How do climate projections differ from weather predictions?
Projecting how climate may change decades in the future is a different scientific issue than forecasting weather a few days from now. Weather prediction means determining the exact location, time, and magnitude of specific events. Because the range of possible weather conditions can vary so widely, the weather forecast is extremely sensitive to even the smallest uncertainties or errors in our description of the state of the atmosphere at the start of a forecast. The impact of those uncertainties magnifies over time, which makes it very difficult to predict specific weather events at a given location more than a week or two into the future.
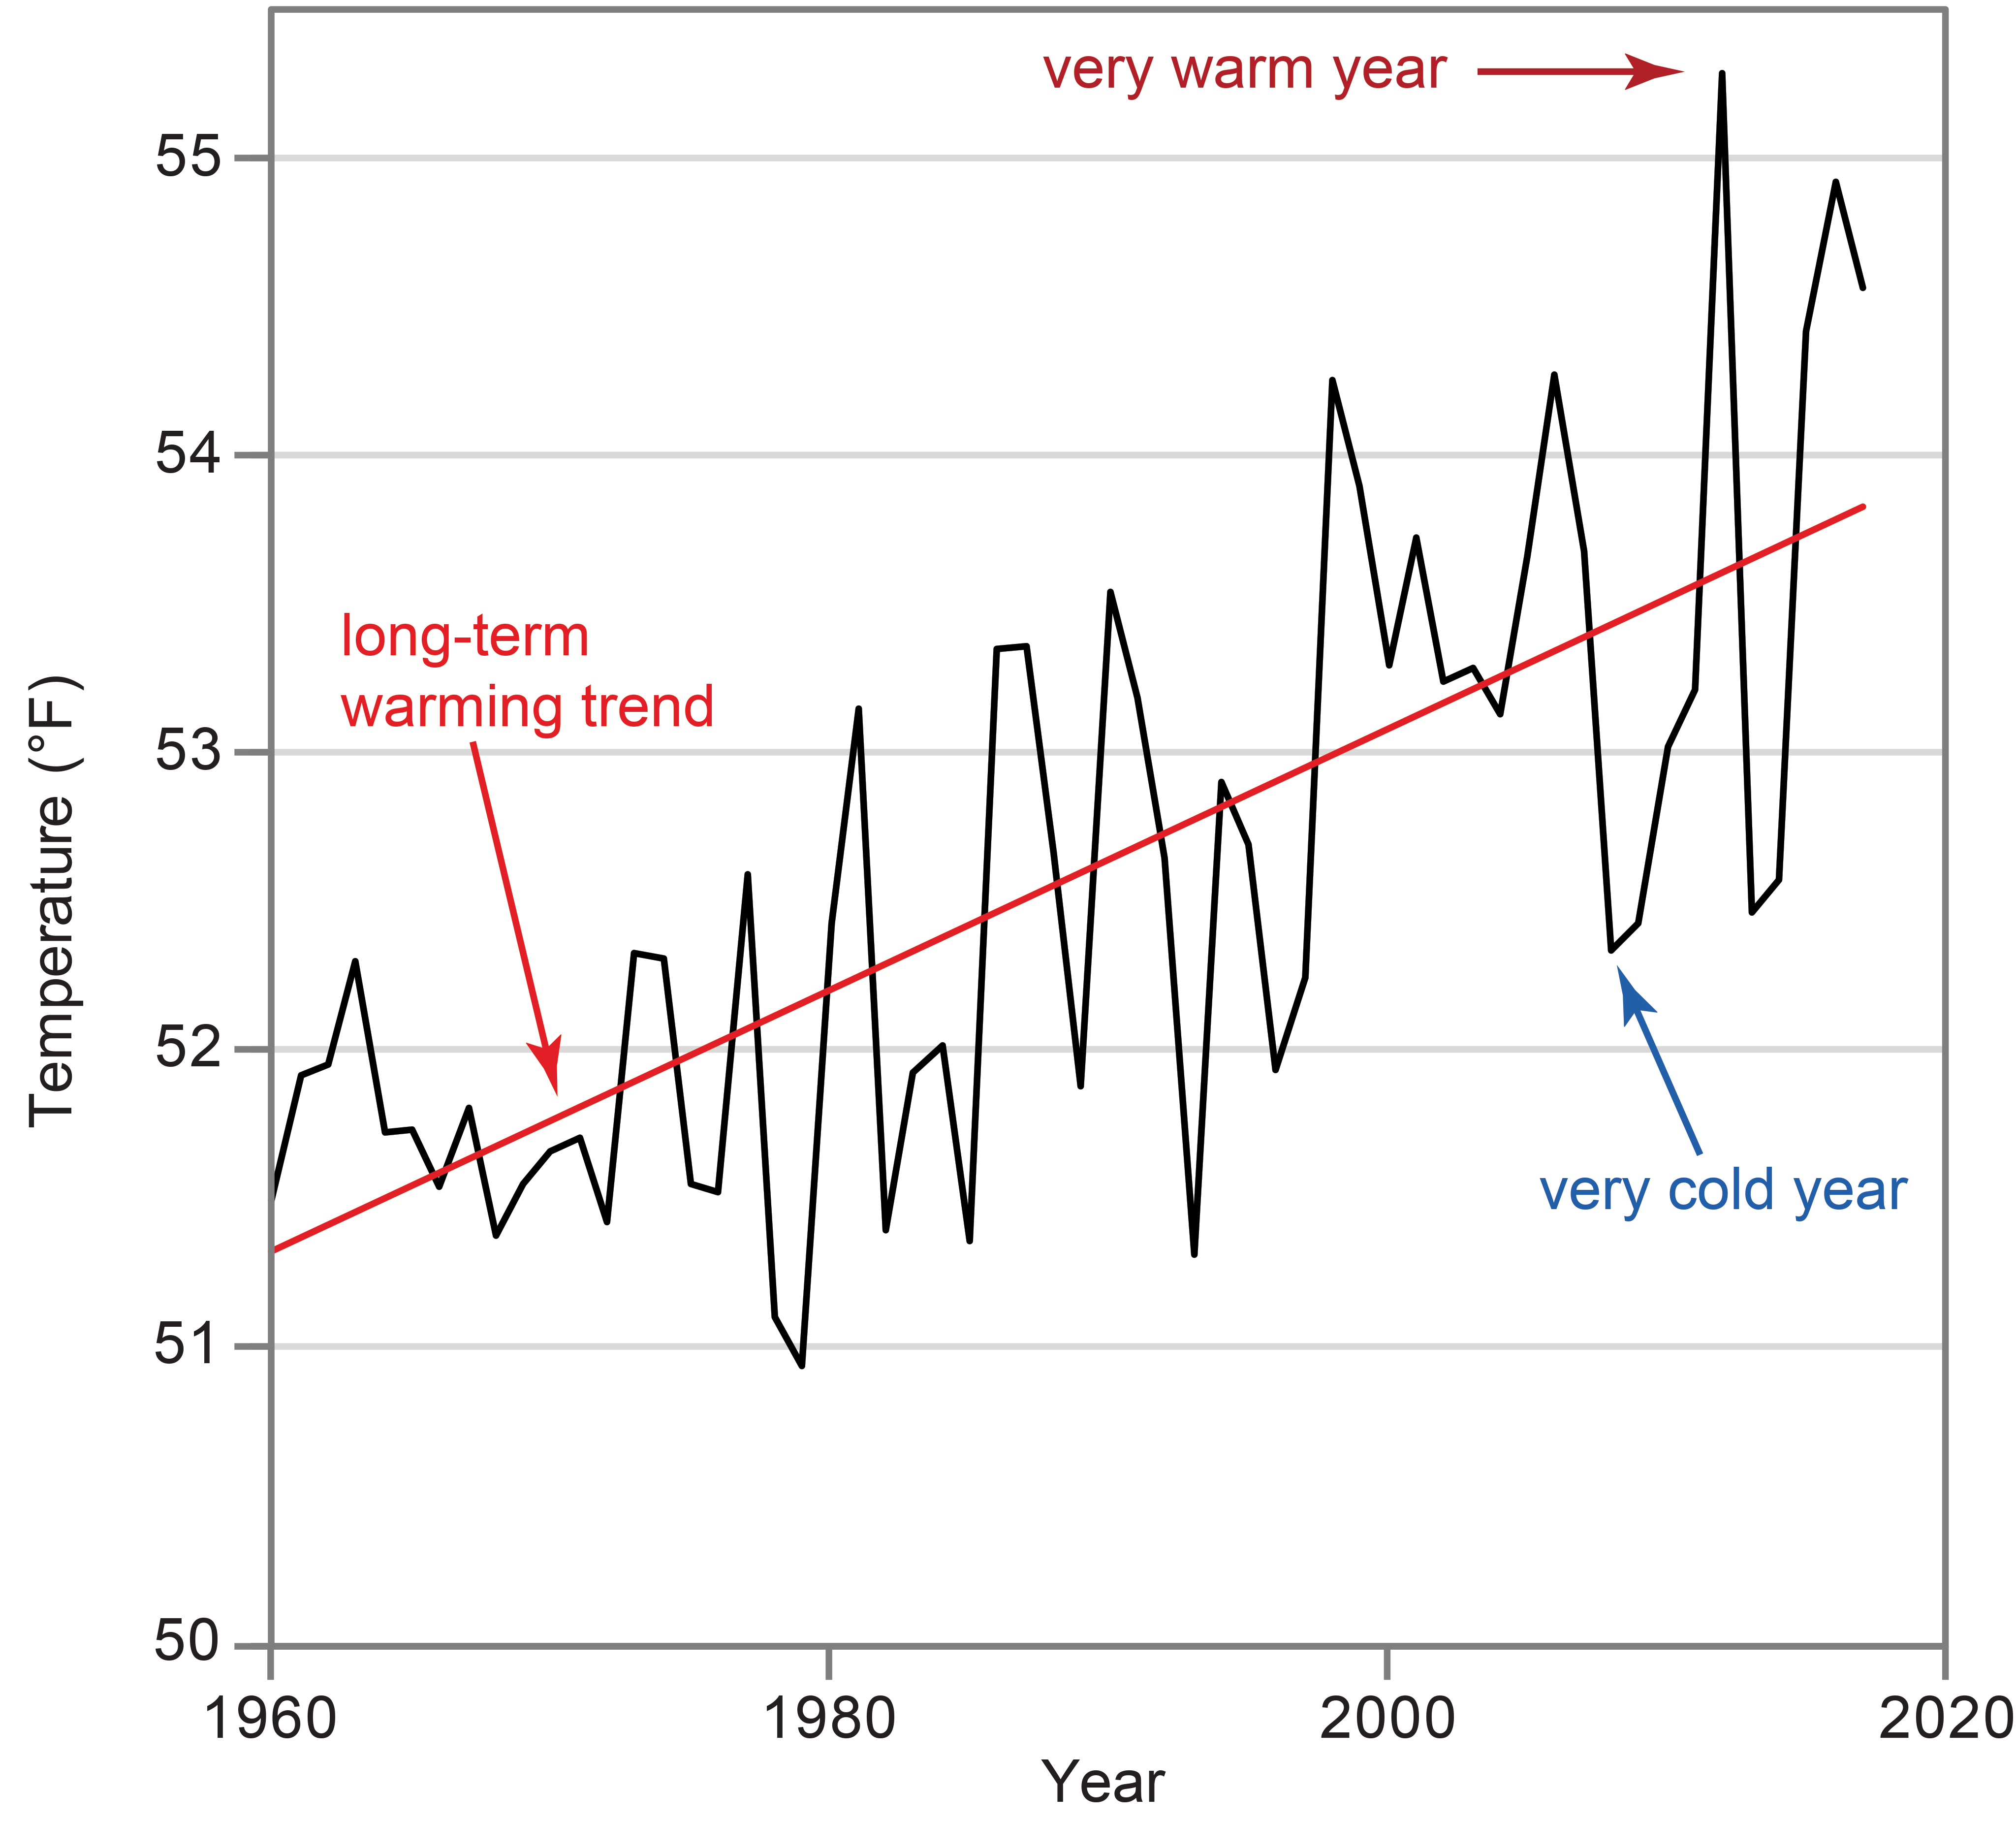
Because climate is the average weather at a given location over long periods of time (three decades or more), the range of possible climate conditions at a given location is much smaller than the range of possible weather conditions. For example, the daytime high temperature at a given location may vary by 30°F or more over the course of a day, while the annual average temperature over 30 years may vary by no more than a few degrees (Figure A5.17).
We can project how climate may change over time in response to natural forces, such as changes in incoming solar radiation, and in response to human activities, such as increasing the abundance of greenhouse gases (GHGs) or decreasing particle pollution. These projections are usually expressed in terms of probabilities describing a range of possible outcomes, not in the sort of exact (deterministic) language of many weather forecasts.
The difference between predicting weather and projecting climate is sometimes illustrated with a public health analogy. While it is impossible for us to determine the exact date and time when a particular individual will die, we can easily calculate the average age of death of all Americans for a time period in the past. In this case, weather is like the individual, while climate is like the average. To extend this analogy into the realm of climate change, we can also calculate the average life expectancy of Americans who smoke. We can predict that, on average, smokers will not live as long as nonsmokers. Similarly, we can project what the climate will be like if we emit lower levels of GHGs and what it will be like if we emit more.
Figure A5.17: U.S. Annual Average Temperature
Climate, Weather, and Extreme Events
Temperature records show that the long-term (30 years or longer) trend in increasing surface temperatures has not ceased. The rate of warming has been faster during some decades and slower during others, but these relatively short periods of time are not the basis for scientists’ conclusion that sustained global warming is occurring.
17. Was there a “hiatus” in global warming?
“Global warming” refers to the increase in global average surface temperature that has been observed for more than a century. This warming is clearly revealed in both the surface temperature record and in satellite measurements of lower-atmospheric (troposphere) temperature. While the long-term trend shows warming, scientists expect that the rate of warming will vary from year to year or decade to decade due to the variability inherent in the climate system, or due to short-term changes in climate forcings, such as aerosols (dust, pollution, or volcanic particles) or incoming solar energy (Figure A5.18).
Temporary slowdowns in the rate of warming have occurred earlier in the historical record, even as carbon dioxide concentrations continued to rise. Temporary speedups have also occurred, most notably from the early 1900s to the 1940s and from the 1970s to the late 1990s. Computer simulations of both historical and future climate produce similar variations in the rate of warming, making recent variations in short-term temperature trends unsurprising.
From the mid-1940s to the mid-1970s, there was almost no increase in global temperature, possibly related to an increase in volcanic activity and/or human-caused aerosol emissions. Most notably, for the 15 years following the 1997–1998 El Niño event, the observed rate of temperature increase was smaller than what was projected by some climate models. However, during this period other indicators of climate change continued previous trends associated with warming, such as increasing ocean heat content and decreasing arctic sea ice extent (Figure A5.19; see Wuebbles et al. 2017,4 Box 1.1).
Figure A5.18: Short-Term Variability Versus Long-Term Trend
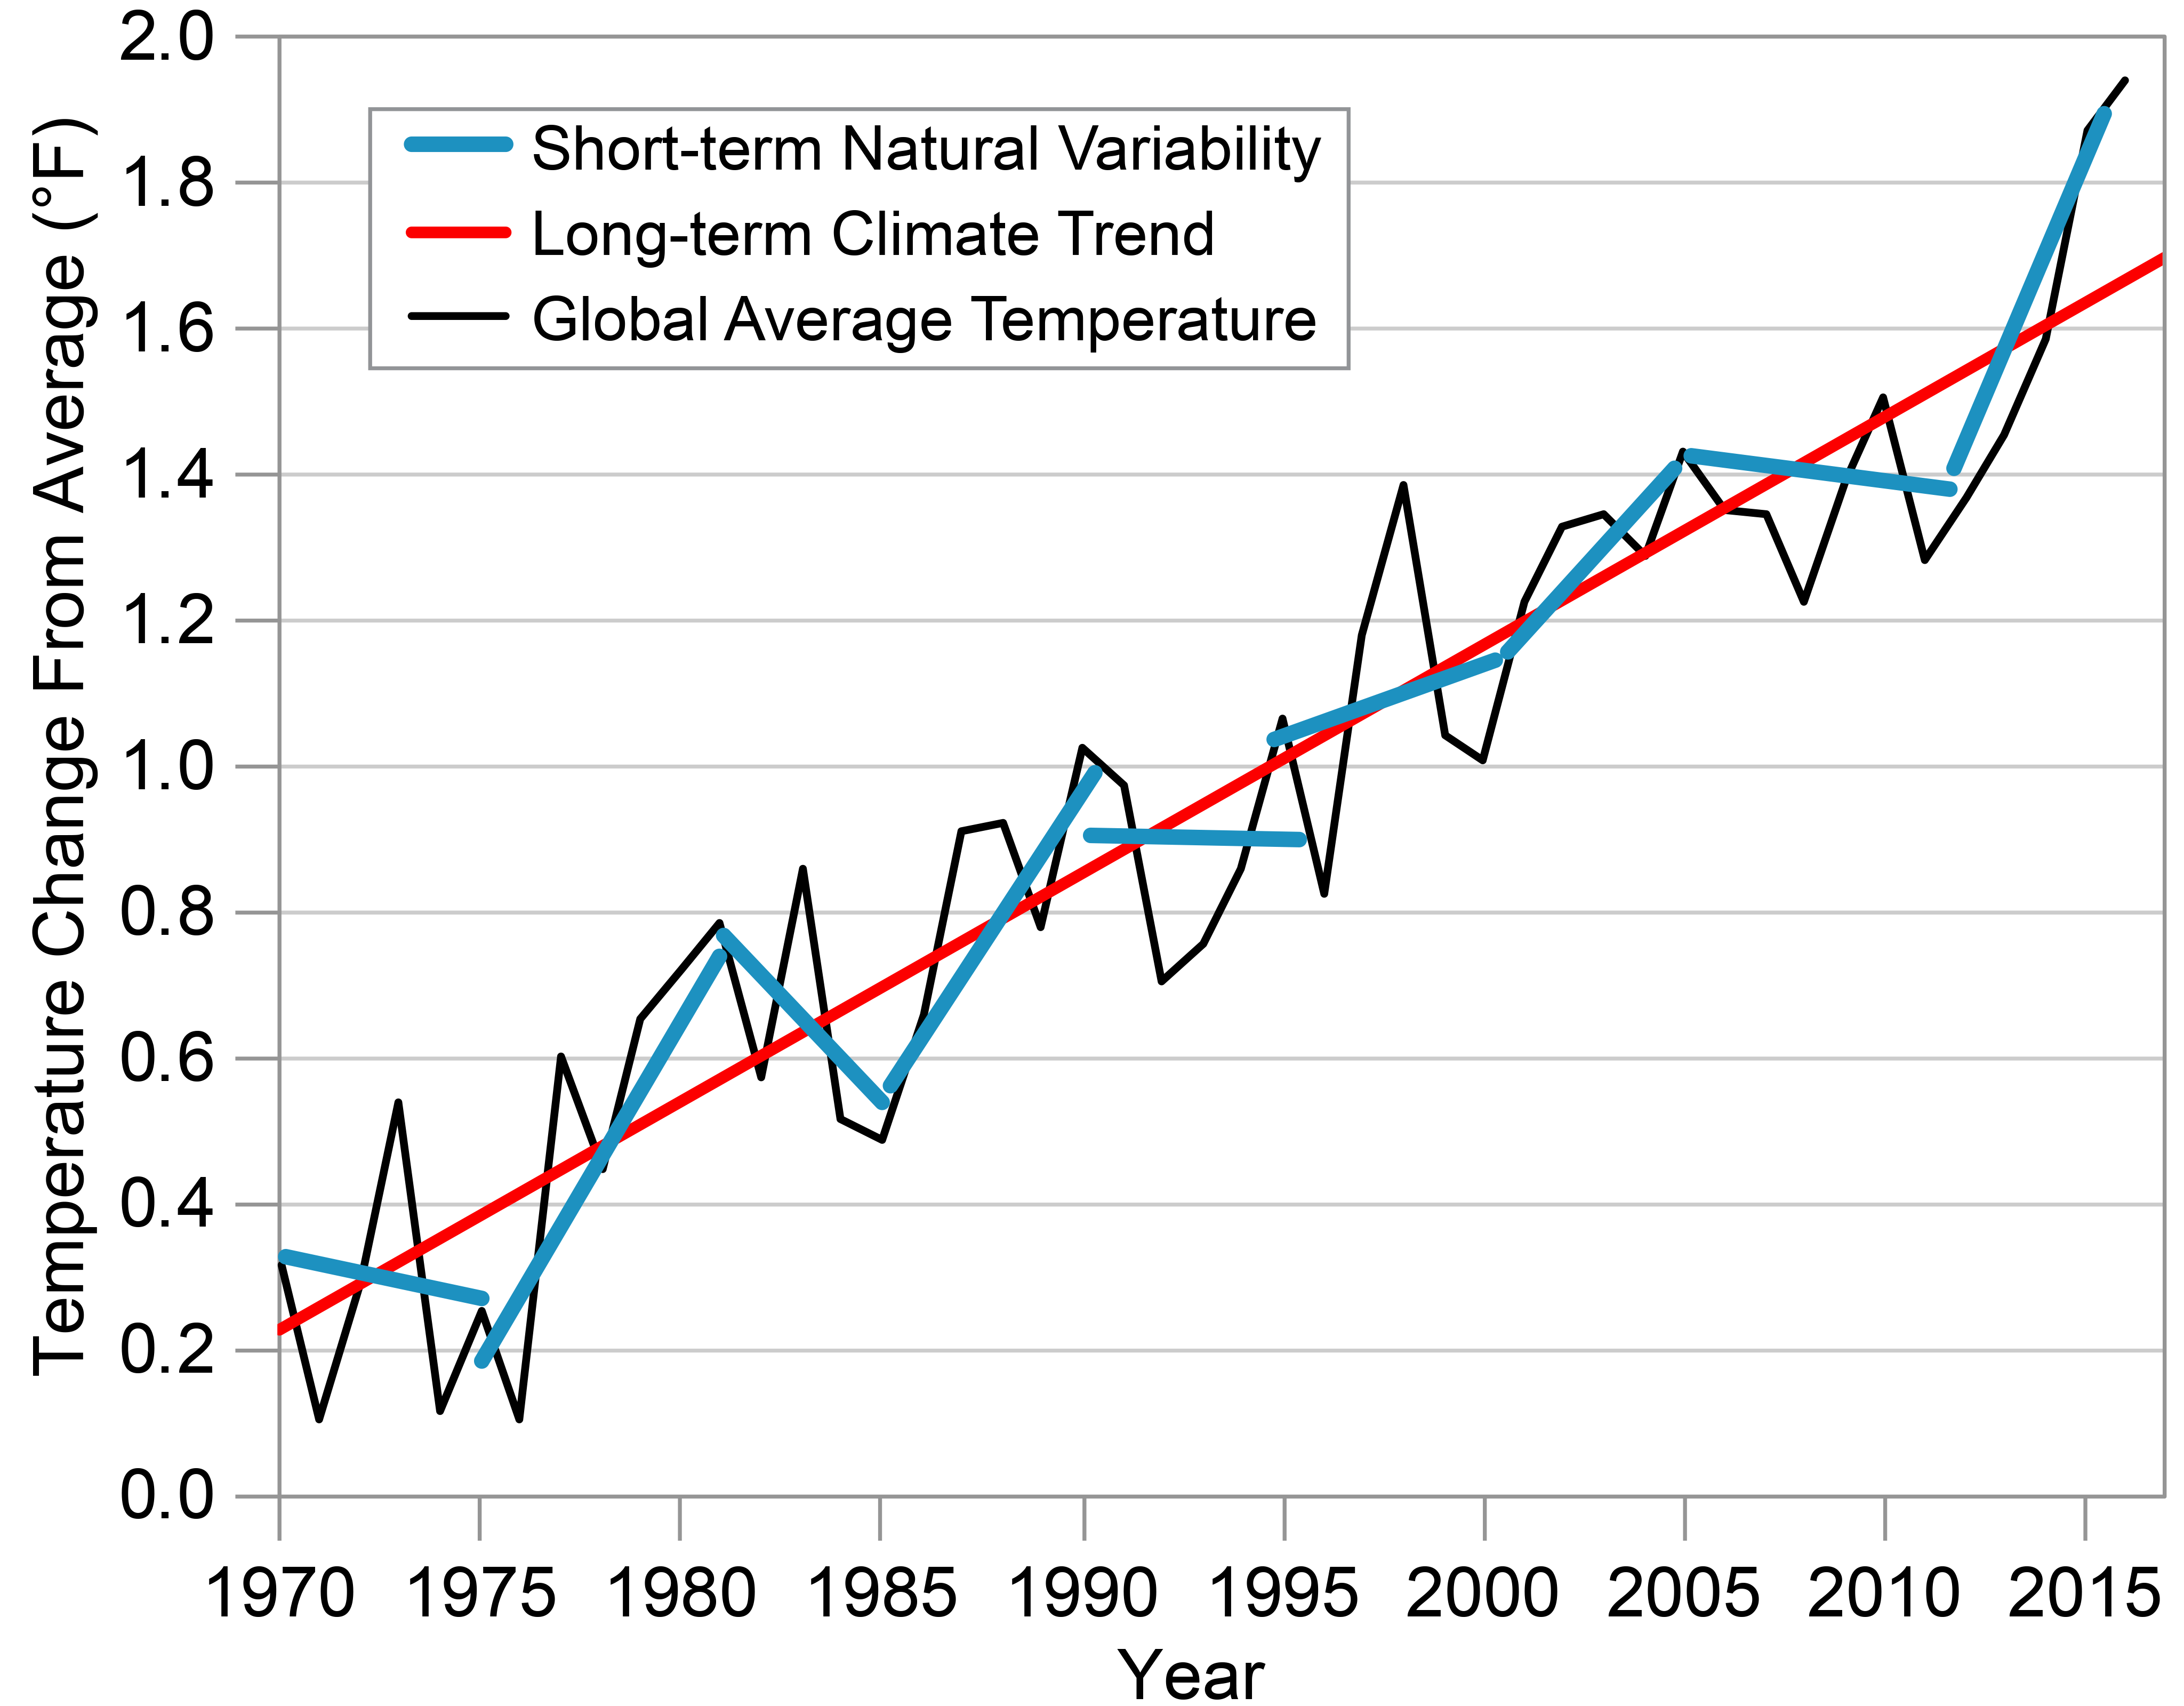
Figure A5.19: Speedups and Slowdowns in Warming

An extreme event is a weather or climate-related event that is particularly rare for a given time of year and location. These events include drought, wildfires, floods, severe storms (including hurricanes), heat waves, cold snaps, and heavy rains, and they can have devastating impacts on local communities, infrastructure, the economy, and the environment.
18. What is an extreme event?
Scientists determine if an event is extreme or not by comparing measurements of weather and climate variables (rainfall, wind speed, temperature, etc.) with thresholds. Events above or below these thresholds are considered rare occurrences, such as events that rank in the highest or lowest 5% of observed values. Several thresholds may be used to define if a single event is considered extreme, and the threshold may change depending on the period of interest (day, month, season, year, etc.) and the chosen reference period (for example, 1961–1990 versus 1900–2000).
It is possible for a single event to meet the definition of an extreme event but not have a large impact. Conversely, it is possible for several types of events that may not be considered extreme individually to cause catastrophic impacts when taken together, such as a sequence of hot days that occur during dry conditions that worsen a drought, or several rainfall events occurring one after another that produce flooding (see Wuebbles et al. 2017, Knutson et al 2017, and Kossin et al. 2017 for more detail on extreme events4,14,22).
Yes. Climate change can and has altered the frequency, intensity, duration, or timing of certain types of extreme weather events when compared to past time periods. The harmful effects of severe weather raise concerns about how climate change might alter the risk of such events.
19. Have there been changes in extreme weather events?
While there have always been extreme events due to natural causes, the frequency and severity of some types of events have increased due to climate change (Figure A5.20) (see also Ch. 2: Climate). As average temperatures have warmed due to emissions of greenhouse gases (GHGs) from human activities, extreme high temperatures have become more frequent and extreme cold temperatures less frequent. From 2001 to 2012, more than twice as many daily high temperature records, as compared to low temperature records, were broken in the United States. With continued increases in the level of GHGs in the atmosphere, the chances for extreme high temperature will continue to increase, with the occurrence of extreme low temperatures becoming less common. Even with much warmer average temperatures later in the century, there may still be occasional record cold snaps, though occurrences of record heat will be more common.
Because warmer air can hold more moisture, heavy rainfall events have become more frequent and severe in some areas and are projected to increase in frequency and severity as the world continues to warm. Both the intensity and rainfall rates of Atlantic hurricanes are projected to increase (see, for example, Ch. 2: Climate, Box 2.5), with the strongest storms getting stronger in a warming climate. Recent research has shown how global warming can alter atmospheric circulation and weather patterns such as the jet stream, affecting the location, frequency, and duration of these and other extremes.13
More research would be required to improve scientific understanding of how human-caused climate change will affect other types of extreme weather events important to the United States, such as tornadoes and severe thunderstorms. These events occur over much smaller scales of time and space, which makes observations and modeling more challenging. Projecting the future influence of climate change on these events can also be complicated by the fact that some of the risk factors for these events may increase while others may decrease.2,4,22
Figure A5.20: Extreme Temperature and Precipitation Events

While it is difficult to attribute a specific weather or climate-related event to any one cause, climate change can affect whether an event was more or less likely to occur. Climate change can also influence the severity of these events. Our ability to detect the influence of human-caused warming on particular kinds of extreme events depends both on the length and quality of our historical records of those events, as well as how well we can simulate the environmental processes that produce and sustain them.
20. Can specific weather or climate-related events be attributed to climate change?
Extreme event attribution is a relatively recent scientific advancement that seeks to determine whether climate change altered the likelihood of occurrence of a given extreme event.14,23 A long-term, high-quality record of a given type of event and a computer model capable of producing a realistic simulation of the event are needed in order to assess the influence of climate change. Because of these data and modeling constraints, our ability to detect the influence of human-caused global warming on heat waves and, to a lesser extent, heavy rainfall events is better at present than our ability to detect its influence on tornadoes or hurricanes. As scientists collect more data and develop more advanced tools, they will be able to better quantify cause-and-effect relationships in the climate system, which should improve their ability to attribute how much human-caused climate change contributes to specific weather and climate-related events.
One example of event attribution comes from the recent California drought, where scientists found that human-caused climate change contributed 8%–27% to the severity of the drought.24 Droughts are frequent in the Southwest and occur regardless of human activity, but human-caused climate change leads to increased evaporation and decreased soil moisture, intensifying droughts during periods of little rain.14
Atlantic hurricane activity has increased since the 1970s, but the relatively short length of high-quality hurricane records does not yet allow us to say how much of that increase is natural and how much may be due to human activity. With future warming, hurricane rainfall rates are likely to increase, as will the number of very intense hurricanes, according to both theory and numerical models. However, models disagree about whether the total number of Atlantic hurricanes will increase or decrease. Rising sea level will increase the threat of storm surge flooding during hurricanes.
21. Could climate change make Atlantic hurricanes worse?
Hurricane activity is undeniably linked to sea surface temperatures (see Ch. 2: Climate, Box 2.5 for a discussion on the 2017 Atlantic hurricane season). Other influences being equal, warmer waters yield stronger hurricanes with heavier rainfall. The tropical Atlantic Ocean has warmed over the past century, at least partly due to human-caused emissions of greenhouse gases. However, high-quality records of Atlantic hurricanes are too short to reliably separate any long-term trends in hurricane frequency, intensity, storm surge, or rainfall rates from natural variability.22 This does not mean that no trends exist, only that the data record is not long enough to determine the cause.
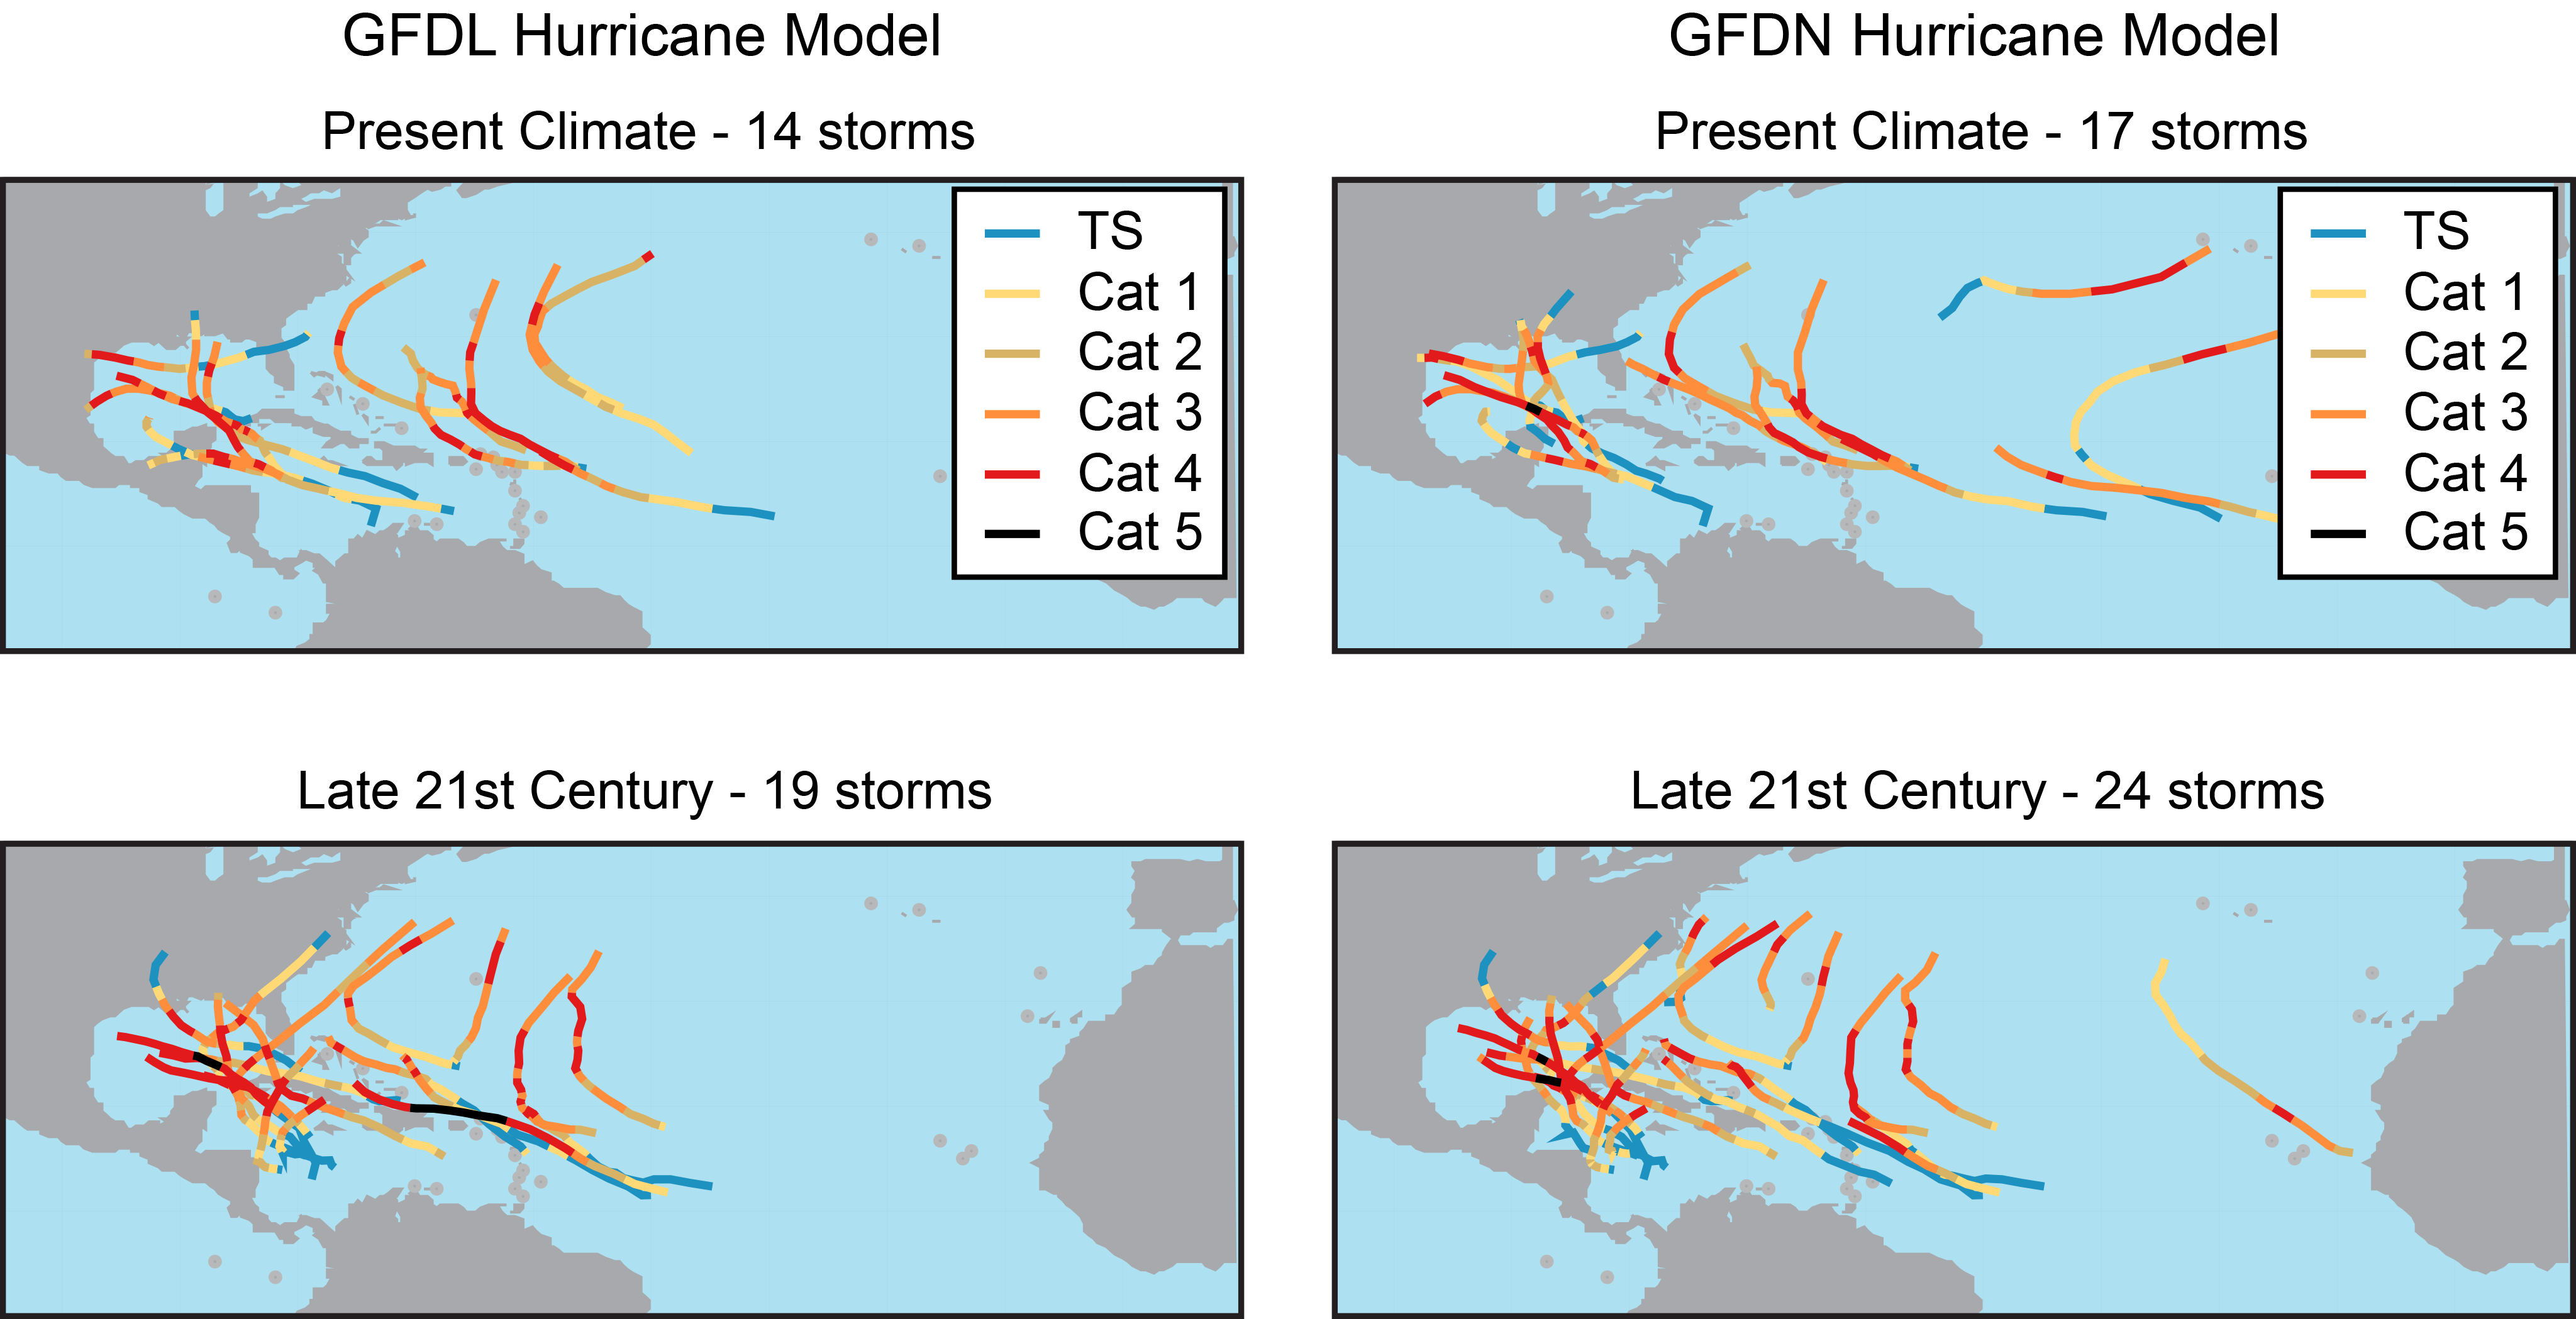
Most models agree that climate change through the 21st century is likely to increase the average intensity and rainfall rates of hurricanes in the Atlantic and other basins. Models are less certain about whether the average number of storms per season will increase or decrease. Early modeling raised the possibility of a significant future increase in the number of Category 4 and 5 storms in the Atlantic (Figure A5.21). While that remains possible, the most recent high-resolution modeling provides mixed messages: some models project increases in the number of the basin’s strongest storms, and others project decreases.22
Regardless of any human-influenced changes in storm frequency or intensity, rising sea level will increase the threat of storm surge flooding during hurricanes (Ch. 8: Coastal; Ch. 18: Northeast; Ch. 19: Southeast; Ch. 20: U.S. Caribbean; Ch. 23: S. Great Plains).
Figure A5.21: Category 4 and 5 Hurricane Formation: Now and in the Future
Societal Effects
Climate change is altering the world around us in ways that become increasingly evident with each passing decade. Natural and human systems that we rely on are being impacted by more intense precipitation events, rising sea level, and a warming ocean and will be impacted by projected increases in the frequency of droughts and heat waves and other extreme weather patterns.
22. How is climate change affecting society?
Many people are already being affected by the changes that are occurring, and more will be affected as these changes continue to unfold (Figure A5.22). In the Northeast and Northwest, fishing communities have to adapt to increasing ocean temperatures and acidification that impact fish and shellfish (Ch. 9: Oceans; Ch. 18: Northeast; Ch. 24: Northwest). Coastal communities, especially those located on islands, will need to confront rising sea levels, which are already contaminating freshwater supplies, flooding streets during high tides, and exacerbating storm surge flooding (Ch. 8: Coastal; Ch. 19: Southeast; Ch. 20: U.S. Caribbean; Ch. 27: Hawaiʻi and Pacific Islands). Shifts in the timing of the seasons and changes in the location of plants and animals affect communities dependent on those resources for tourism, economy, and/or cultural purposes (Ch. 7: Ecosystems; Ch. 15: Tribes; Ch. 26: Alaska).
Changes are not only happening in the oceans and along the coast. Farmers, the livestock they tend, and other outdoor laborers are expected to be adversely affected by warmer temperatures, an increasing frequency of heat waves, and an increasing number of warm nights (Ch. 10: Ag & Rural; Ch. 14: Human Health; Ch. 19: Southeast; Ch. 23: S. Great Plains). Some communities may have to adapt to both an increase in the frequency of drought and more rain falling as heavy precipitation, while deteriorating water infrastructure compounds those risks (Ch. 3: Water; Ch. 17: Complex Systems; Ch. 22: N. Great Plains; Ch. 25 Southwest). The geographic range and distribution of some pests and pathogens are projected to change in some regions, exposing livestock and crops to new or additional stressors and exposing more people to diseases transmitted by those pests (Ch. 14: Human Health; Ch. 21: Midwest).
Infrastructure across the country, which supports economic activity, is increasingly being tested and impacted by climate change, including airport runways affected by increased surface temperature and coastal streets inundated by high tide flooding (Ch. 12: Transportation). Much of the current built environment throughout the country has been developed based on the assumption that future climate will be similar to that of the past, which is no longer a valid assumption (Ch. 11: Urban). In general, the larger and faster the changes in climate, the more difficult it is for human and natural systems to adapt. Adaptation efforts not only help communities become more resilient, they may also create new jobs and help stimulate local economies (see FAQ “What are climate change mitigation, adaptation, and resilience?”).
Figure A5.22: Americans Respond to the Impacts of Climate Change
Click on a region to see more details on a regional impact and the actions taken to address it.
Northwest
Impact
Wildfire increases and associated smoke are affecting human health, water resources, timber production, fish and wildlife, and recreation.
Action
Federal forests have developed adaptation strategies for climate change that include methods to address increasing wildfire risks.
Northern Great Plains
Impact
Flash droughts and extreme heat illustrate sustainability challenges for ranching operations, with emergent impacts on rural prosperity and mental health.
Action
The National Drought Mitigation Center is helping ranchers plan to reduce drought and heat risks to their operations.
Midwest
Impact
Increasing heavy rains are leading to more soil erosion and nutrient loss on Midwestern cropland.
Action
Iowa State developed a program for using prairie strips in farm fields to reduce soil and nutrient loss while increasing biodiversity.
Northeast
Impact
Water, energy, and transportation infrastructure are affected by snow storms, drought, heat waves, and flooding.
Action
Cities and states throughout the region are assessing their vulnerability to climate change and making investments to increase infrastructure resilience.
Southwest
Impact
Drought in the Colorado River basin reduced Lake Mead by over half since 2000, increasing risk of water shortages for cities, farms, and ecosystems.
Action
Seven U.S. state governments and U.S. and Mexico federal governments mobilized users to conserve water, keeping the lake above a critical level.
Southern Great Plains
Impact
Hurricane Harvey’s landfall on the Texas coast in 2017 was one of the costliest natural disasters in U.S. history.
Action
The Governor’s Commission to Rebuild Texas was created to support the economic recovery and rebuilding of infrastructure in affected Texas communities.
Southeast
Impact
Flooding in Louisiana is increasing from extreme rainfall.
Action
The Acadiana Planning Commission in Louisiana is pooling hazard reduction funds to address increasing flood risk.
Alaska
Impact
The physical and mental health of rural Alaskans is increasingly challenged by unpredictable weather and other environmental changes.
Action
The Alaska Native Tribal Health Consortium's Center for Climate and Health is using novel adaptation strategies to reduce climate-related risks including difficulty in harvesting local foods and more hazardous travel conditions.
Hawaii and U.S.-Affiliated Pacific Islands
Impact
The 2015 coral bleaching event resulted in an average mortality of 50% of the coral cover in western Hawai‘i alone.
Action
A state working group generated management options to promote recovery and reduce threats to coral reefs.
U.S. Caribbean
Impact
Damages from the 2017 hurricanes have been compounded by the slow recovery of energy, communications, and transportation systems, impacting all social and economic sectors.
Action
The U.S. Virgin Islands Governor’s Office led a workshop aimed at gathering lessons from the initial hurricane response and establishing a framework for recovery and resilience.
The social cost of carbon is an estimate of the monetary value of the cumulative damages caused by long-term climate change due to an additional amount of carbon dioxide (CO2) emitted. This value quantifies the potential benefits of a reduction in CO2 emissions.
23. What is the social cost of carbon?
The social cost of carbon (SCC) includes the economic costs of climate change that will be felt in market sectors such as agriculture, energy services, and coastal resources, as well as nonmarket impacts on human health and ecosystems, to name a few.26 SCC values are computed by simulating the “causal chain” from greenhouse gas emissions to physical climate change to climate damages in order to estimate the additional damages over time incurred from an additional metric ton of CO2.27 This value can be used to inform climate risk management decisions at national, state, and corporate levels, as well as in regulatory impact analysis to evaluate benefits of marginal CO2 reductions—for example, in rules affecting appliance efficiency, power generation, industry, and transportation, such as the benefits of increased vehicle gas mileage standards. As with many complex, interacting systems, it is challenging to develop comprehensive SCC estimates, but this is an active area of research guided by recent recommendations from the National Academies of Sciences, Engineering, and Medicine to keep up with the current state of scientific knowledge, better characterize key uncertainties, and improve transparency.28 Notably, estimating the SCC depends on normative social values such as time preference, risk aversion, and equity considerations that can lead to a range of values. Ongoing interdisciplinary collaborations and research findings from the climate change impacts, adaptation, and vulnerability literature—including those discussed in the Fourth National Climate Assessment—are being used to improve the robustness of climate damage quantification and, thus, SCC estimates.
“Mitigation,” “adaptation,” and “resilience” are related but different terms in the context of climate change. Mitigation refers to actions that reduce the amount and speed of future climate change by reducing emissions of greenhouse gases (GHGs) or removing carbon dioxide from the atmosphere. Adaptation refers to adjustments in natural or human systems in response to a new or changing environment that exploit beneficial opportunities or moderate negative effects. Thus, adaptation is closely related to resilience, which is the capacity to prevent, withstand, respond to, and recover from a disruption with minimum damage to social well-being, the economy, and the environment.
24. What are climate change mitigation, adaptation, and resilience?
Mitigation efforts can reduce emissions or increase storage of GHGs. For example, shifting from fossil fuels to low-carbon energy sources will generally result in the reduction of GHG emissions into the atmosphere. Mass transit, energy-efficient buildings, and electric vehicles can be used instead of high-emission alternatives. Land-use changes that increase the amount of carbon stored in soil and biomass, as well as some geoengineering techniques, constitute mitigation efforts that take carbon dioxide (CO2) out of the atmosphere (see FAQ “Can geoengineering be used to remove carbon dioxide from the atmosphere or otherwise reverse global warming?”) (see also Ch. 29: Mitigation).
Adaptation involves policies, strategies, and technologies designed to reduce the risk of harm from climate-related impacts. Some adaptation actions are technical engineering solutions designed to address specific impacts, such as building a seawall in the face of sea level rise or breeding new crops that do well in the context of drought. Other adaptation actions involve decision-making processes, policies, or approaches that bring people together to support coordinated action (Ch. 28: Adaptation). Adaptation often involves incremental adjustments to current systems, but larger transformations may be necessary, especially as some systems cross thresholds or tipping points.
Adaptation and mitigation actions can be undertaken simultaneously to reduce concentrations of GHGs in the atmosphere while also reducing the risk of climate-related impacts. Both adaptation and mitigation can have co-benefits—societal benefits that are not necessarily related to climate change (Ch. 29: Mitigation). For example, a new coastal restoration project to plant a mangrove forest will remove CO2 from the atmosphere while providing valuable ecosystem services—a buffer against storm surges, reduced erosion, habitat for wildlife, and filtration of human pollutants (Ch. 8: Coastal).
Climate resilience refers to the capacity of a human or natural system to respond to and recover from climate-related hazards, such as droughts or floods, in ways that maintain their essential or valued identity, functions, and structure. Resilient systems respond to climate stressors or impacts with less harm while also improving their ability to absorb future impacts and maintaining capacity for adaptation and learning. A resilient rural community might have the capacity to share knowledge and resources to help farmers deal with droughts while improving their ability to absorb future impacts by building long-term structures to conserve water resources (Ch. 24: Northwest). Resilience can be bolstered by diversity (such as species diversity or employment diversity), redundancy (the ability for one part of the system to take over essential functions if another is damaged), social networks, knowledge sharing, and good governance (Ch. 7: Ecosystems).
Yes. The choices made today largely determine what impacts may occur in the future. Carbon dioxide can persist in the atmosphere for a century or more, so emissions released now will still be affecting climate for years to come. The sooner greenhouse gas (GHG) emissions are reduced, the easier it may be to limit the long-term costs and damages due to climate change. Waiting to begin reducing emissions is likely to increase the damages from climate-related extreme events (such as heat waves, droughts, wildfires, flash floods, and stronger storm surges due to higher sea levels and more powerful hurricanes).
25. Is timing important for climate mitigation?
The effect of increasing atmospheric concentrations of carbon dioxide (CO2) and other GHGs on the climate system can take decades to be fully realized. The resulting change in climate and the impacts of those changes can then persist for centuries. The longer these changes in climate continue, the greater the resulting impacts; some systems may not be able to adapt if the change is too much or too fast.
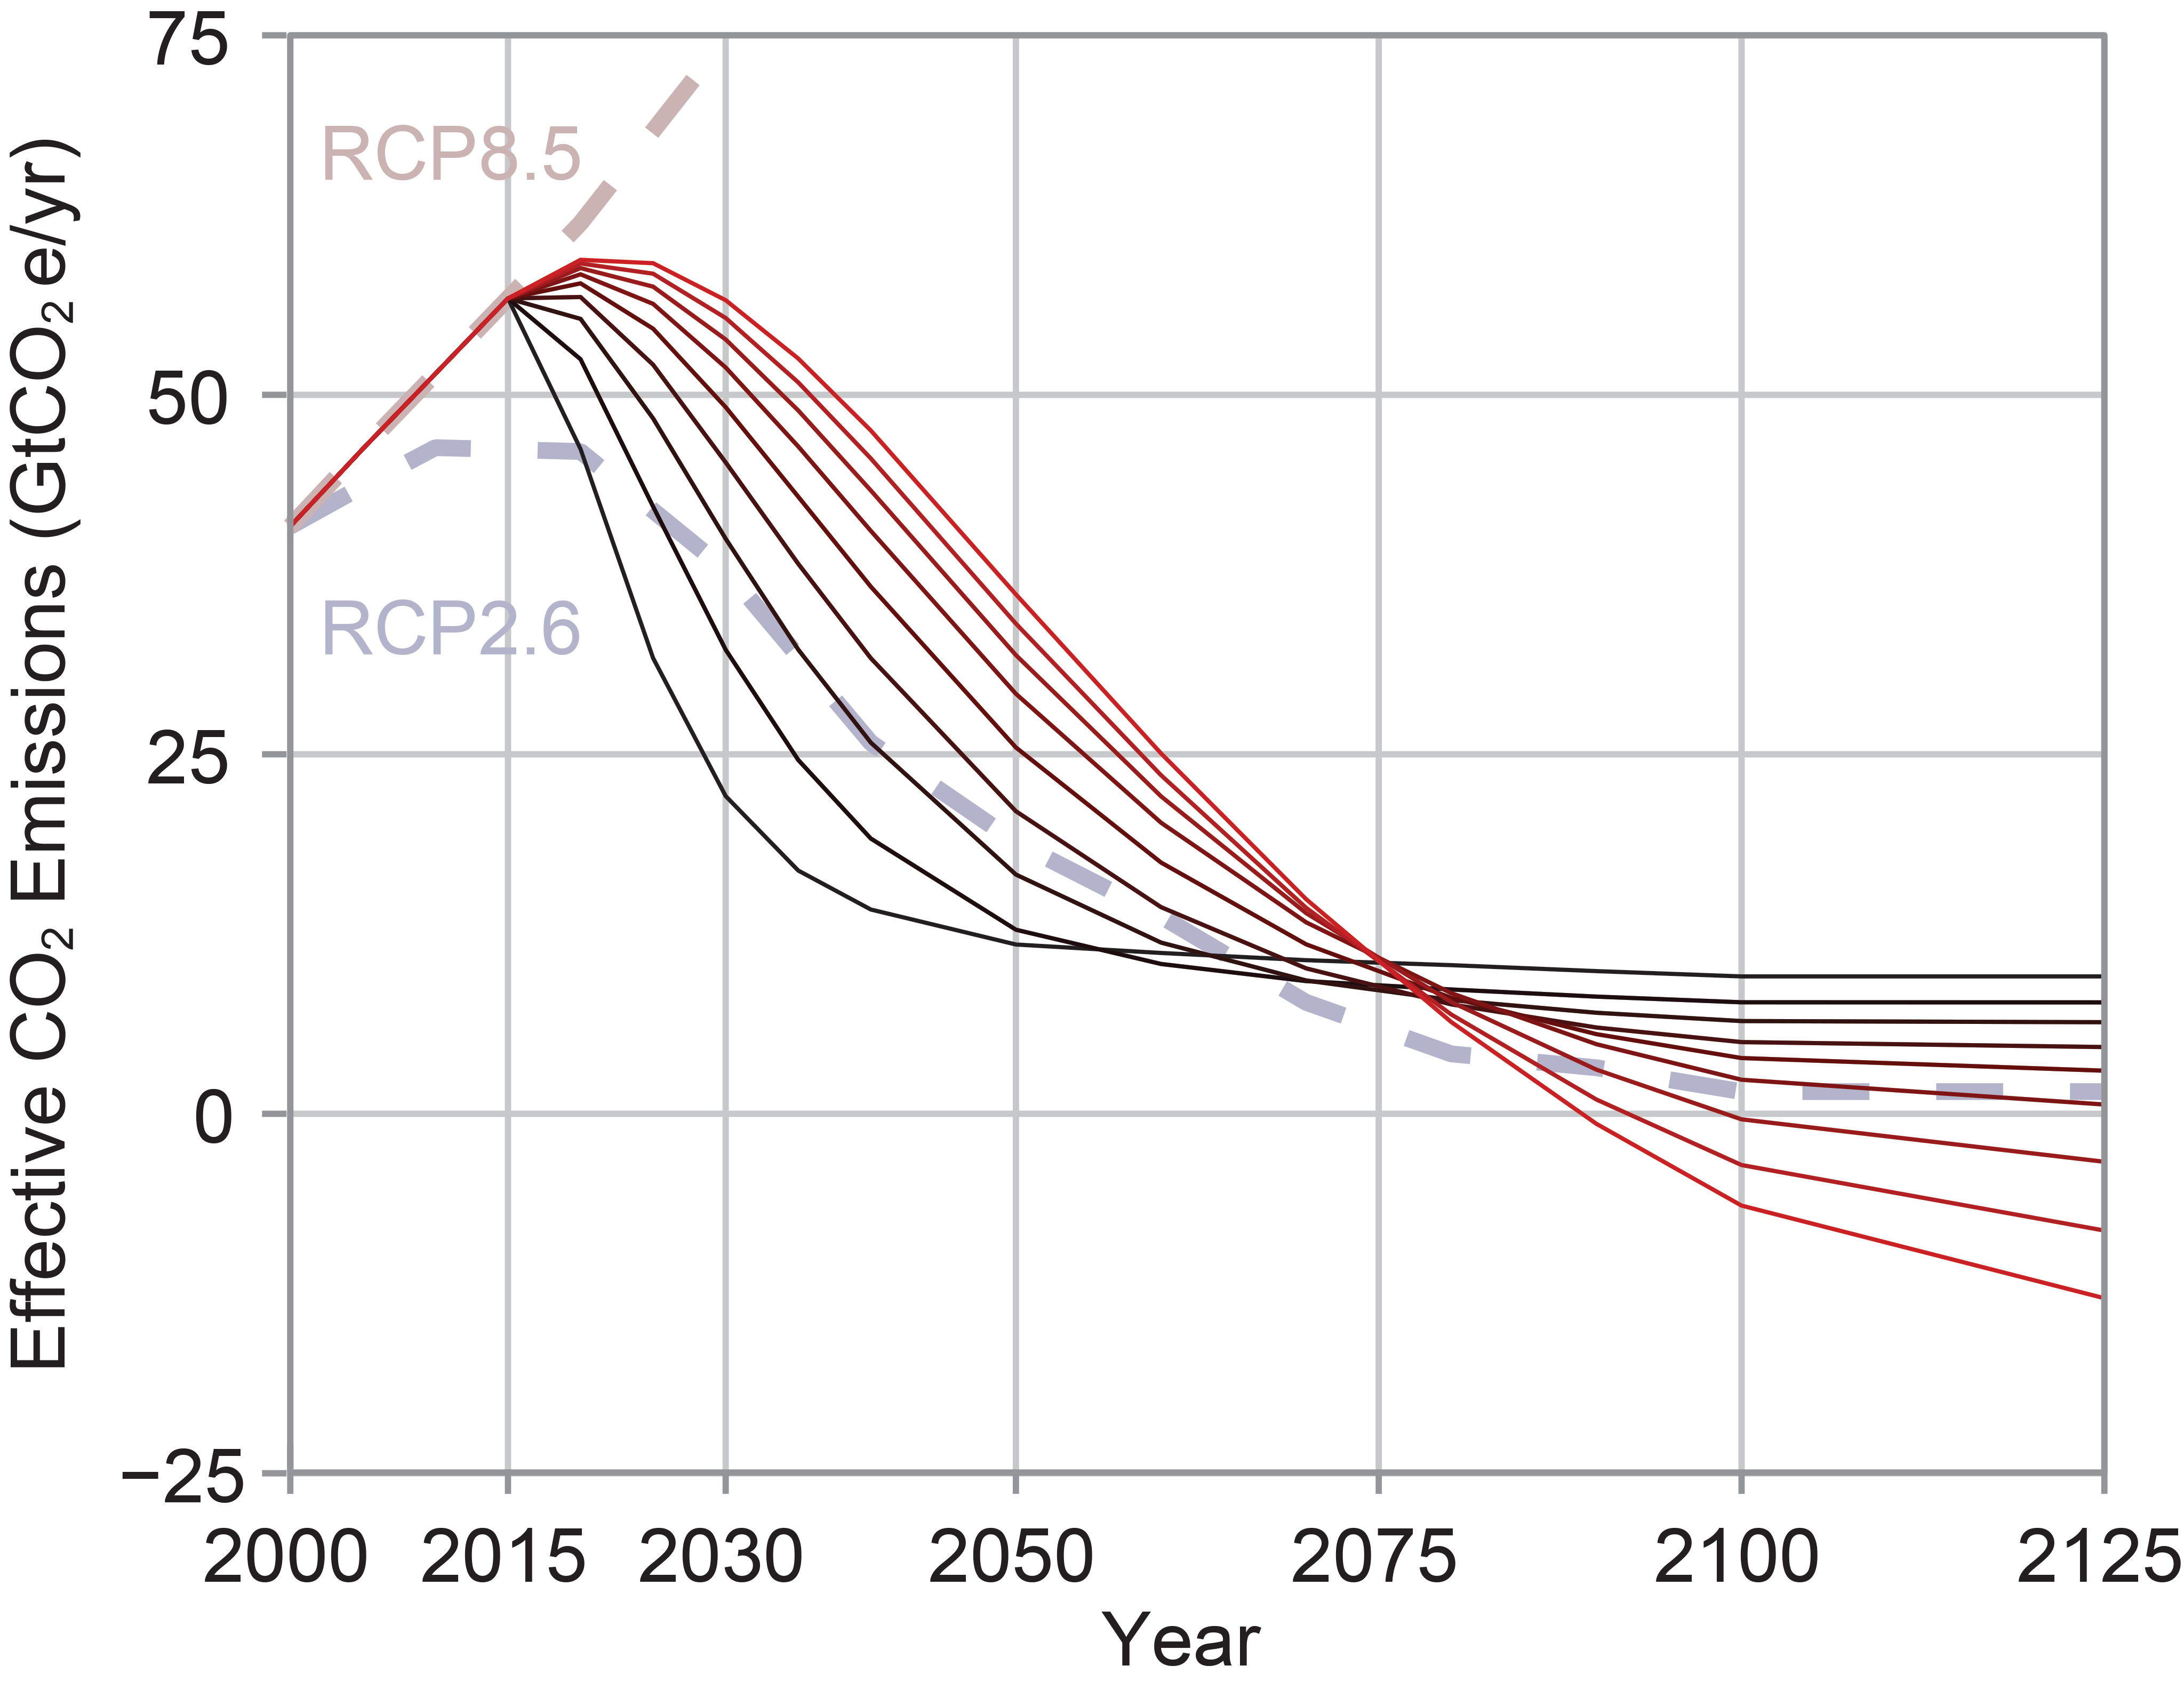
The long-term equilibrium temperature from GHG emissions will be a function of cumulative emissions over time, not the specific year-to-year emissions. Thus, staying within a specific warming target will depend on the total net emissions (including increases in carbon uptake) over a given future period.
However, the timing and nature of changes are important in both reducing short-term warming and meeting any particular long-term warming limit. Long-term reductions in the rate and magnitude of global warming can be made by reducing total emissions of CO2. Near-term reductions in the rate of climate change can be made by reducing human-caused emissions of short-lived but highly potent GHGs such as methane and hydrofluorocarbons. These pollutants remain in the atmosphere from weeks to about a decade—much shorter than CO2—but have a much greater warming influence than CO2 (Figure A5.23).17
Figure A5.23: Benefit of Earlier Action to Reduce Emissions
While some climate changes currently have beneficial effects for specific sectors or regions, many studies have concluded that climate change will generally bring more negative effects than positive ones in the future. For example, current benefits of warming include longer growing seasons for agriculture, more carbon dioxide for plants, and longer ice-free periods for shipping on the Great Lakes. However, longer growing seasons, along with higher temperatures and increased carbon dioxide levels, can increase pollen production, intensifying and lengthening the allergy season. Longer ice-free periods on the Great Lakes can result in more lake-effect snowfalls.
26. Are there benefits to climate change?
Many analyses of this question have concluded that climate change will, on balance, bring more negative effects than positive ones in the future. This is largely because our society and infrastructure have been built for the climate of the past, and changes from those historical climate conditions impose costs and management challenges (Ch. 11: Urban). For example, while longer warm seasons may provide a temporary economic boon to coastal communities reliant on tourism, many of these same areas are vulnerable not only to sea level rise but also to risks from ocean acidification and warmer waters that can impact the ecosystems (such as coral reefs) that bring people to the coasts (Ch. 8: Coastal). As another example, while some studies have shown that certain crops in certain regions may benefit from additional carbon dioxide (CO2) in the atmosphere (sometimes referred to as the CO2 fertilization effect), these potential gains are expected to be offset by crop stress caused by higher temperatures, worsening air quality, and strained water availability (see FAQ “How do higher carbon dioxide concentrations affect plant communities and crops?”) (see also Ch. 10: Ag & Rural). Furthermore, any accrued benefits are likely to be short-lived and depreciate significantly as warming continues through the century and beyond.
Yes. Climate change affects certain people and populations differently than others. Some communities have higher exposure and sensitivity to climate-related hazards than others. Some communities have more resources to prepare for and respond to rapid change than others. Communities that have fewer resources, are underrepresented in government, live in or near deteriorating infrastructure (such as damaged levees), or lack financial safety nets are all more vulnerable to the impacts of climate change.
27. Are some people more vulnerable to climate change than others?
Vulnerability here refers to the degree to which physical, biological, and socioeconomic systems are susceptible to and unable to cope with adverse impacts of climate change. Vulnerability encompasses sensitivity, adaptive capacity, exposure, and potential impacts. For example, older people living in cities with no air conditioning have less adaptive capacity and increased sensitivity and vulnerability to heat stress during extreme heat events (Ch. 14: Human Health). Communities that live on atolls in the Marshall Islands have high exposure and are acutely at risk to sea level rise and saltwater intrusion due to the low land height and small land area (Ch. 27: Hawai‘i & Pacific Islands). A history of neglect, political or otherwise, in a given neighborhood can result in dilapidated infrastructure, which in turn can lead to situations such as levee failures, making whole communities vulnerable to flooding and other potential impacts (Ch. 14: Human Health). Poverty can make evacuation during storm events challenging and can make rebuilding or relocating harder following an extreme event. In some Indigenous communities, lack of water and sanitation systems can put people at risk during drought (Ch. 15: Tribes). Additionally, some subpopulations are already more affected by environmental exposures, such as air pollution or extreme heat. If communities or individuals experience a combination of these vulnerability factors, they are at even greater risk. Vulnerable communities and individuals face these disparities today and will likely face increased challenges in the future under a changing climate.
Many impacts of climate change are expected to have negative effects on economic productivity, such as increased prices of goods and services. For example, increased exposure to extreme heat may reduce the hours some individuals are able to work. Physical capital—such as food, equipment, and property—that is derived from the production of goods and services may be impacted because of lower production and higher costs as a result of climate change. Sea level rise, stronger storm surges, and increased heavy downpours that cause flooding can disrupt supply chains or damage properties, structures, and infrastructure that form the backbone of the Nation’s economy.
28. How will climate change impact economic productivity?
High temperatures and storm intensity, which are both linked to more deaths and illness, are projected to increase due to climate change, which would in turn increase health care costs for medical treatment. At the same time, these health effects directly impact labor markets. Workers in industries with the greatest exposure to weather extremes may decrease the amount of time they spend at work, while workers across a wide range of sectors may find their productivity impaired while on the job (Ch. 14: Human Health). These labor market impacts translate into lower earnings for workers and firms.30,31
Climate change is likely to affect physical capital that serves as an important input to economic production. In farming, where weather is a key determinant of agricultural yield, increasing temperatures and drought may lead to net decreases in the amount of food that farms produce (Ch.10: Ag & Rural).32 Extreme heat can also cause manufacturing equipment to break down with greater frequency, while rising sea levels and increased storm intensity can destroy equipment and property across all types of economic activities along American coastlines.30,33
In addition to damaging private property, increased weather extremes can destroy vital public infrastructure, such as roads, bridges, and ports. Since this infrastructure is an integral part of supply chains that drive the American economy, a disruption in their accessibility—or even their destruction—can have large impacts on corporate profits, while their repairs require a diversion of resources away from other useful government projects or an increase in taxes to finance reconstruction (Ch. 11: Urban).34,35
Yes. While we cannot stop climate change overnight, or even over the next several decades, we can limit the amount of climate change by reducing human-caused emissions of greenhouse gases (GHGs). Even if all human-related emissions of carbon dioxide and other GHGs were to stop today, Earth’s temperature would continue to rise for a number of decades and then slowly begin to decline. Ultimately, warming could be reversed by reducing the amount of GHGs in the atmosphere. The challenge in slowing or reversing climate change is finding a way to make these changes on a global scale that is technically, economically, socially, and politically viable.
29. Can we slow climate change?
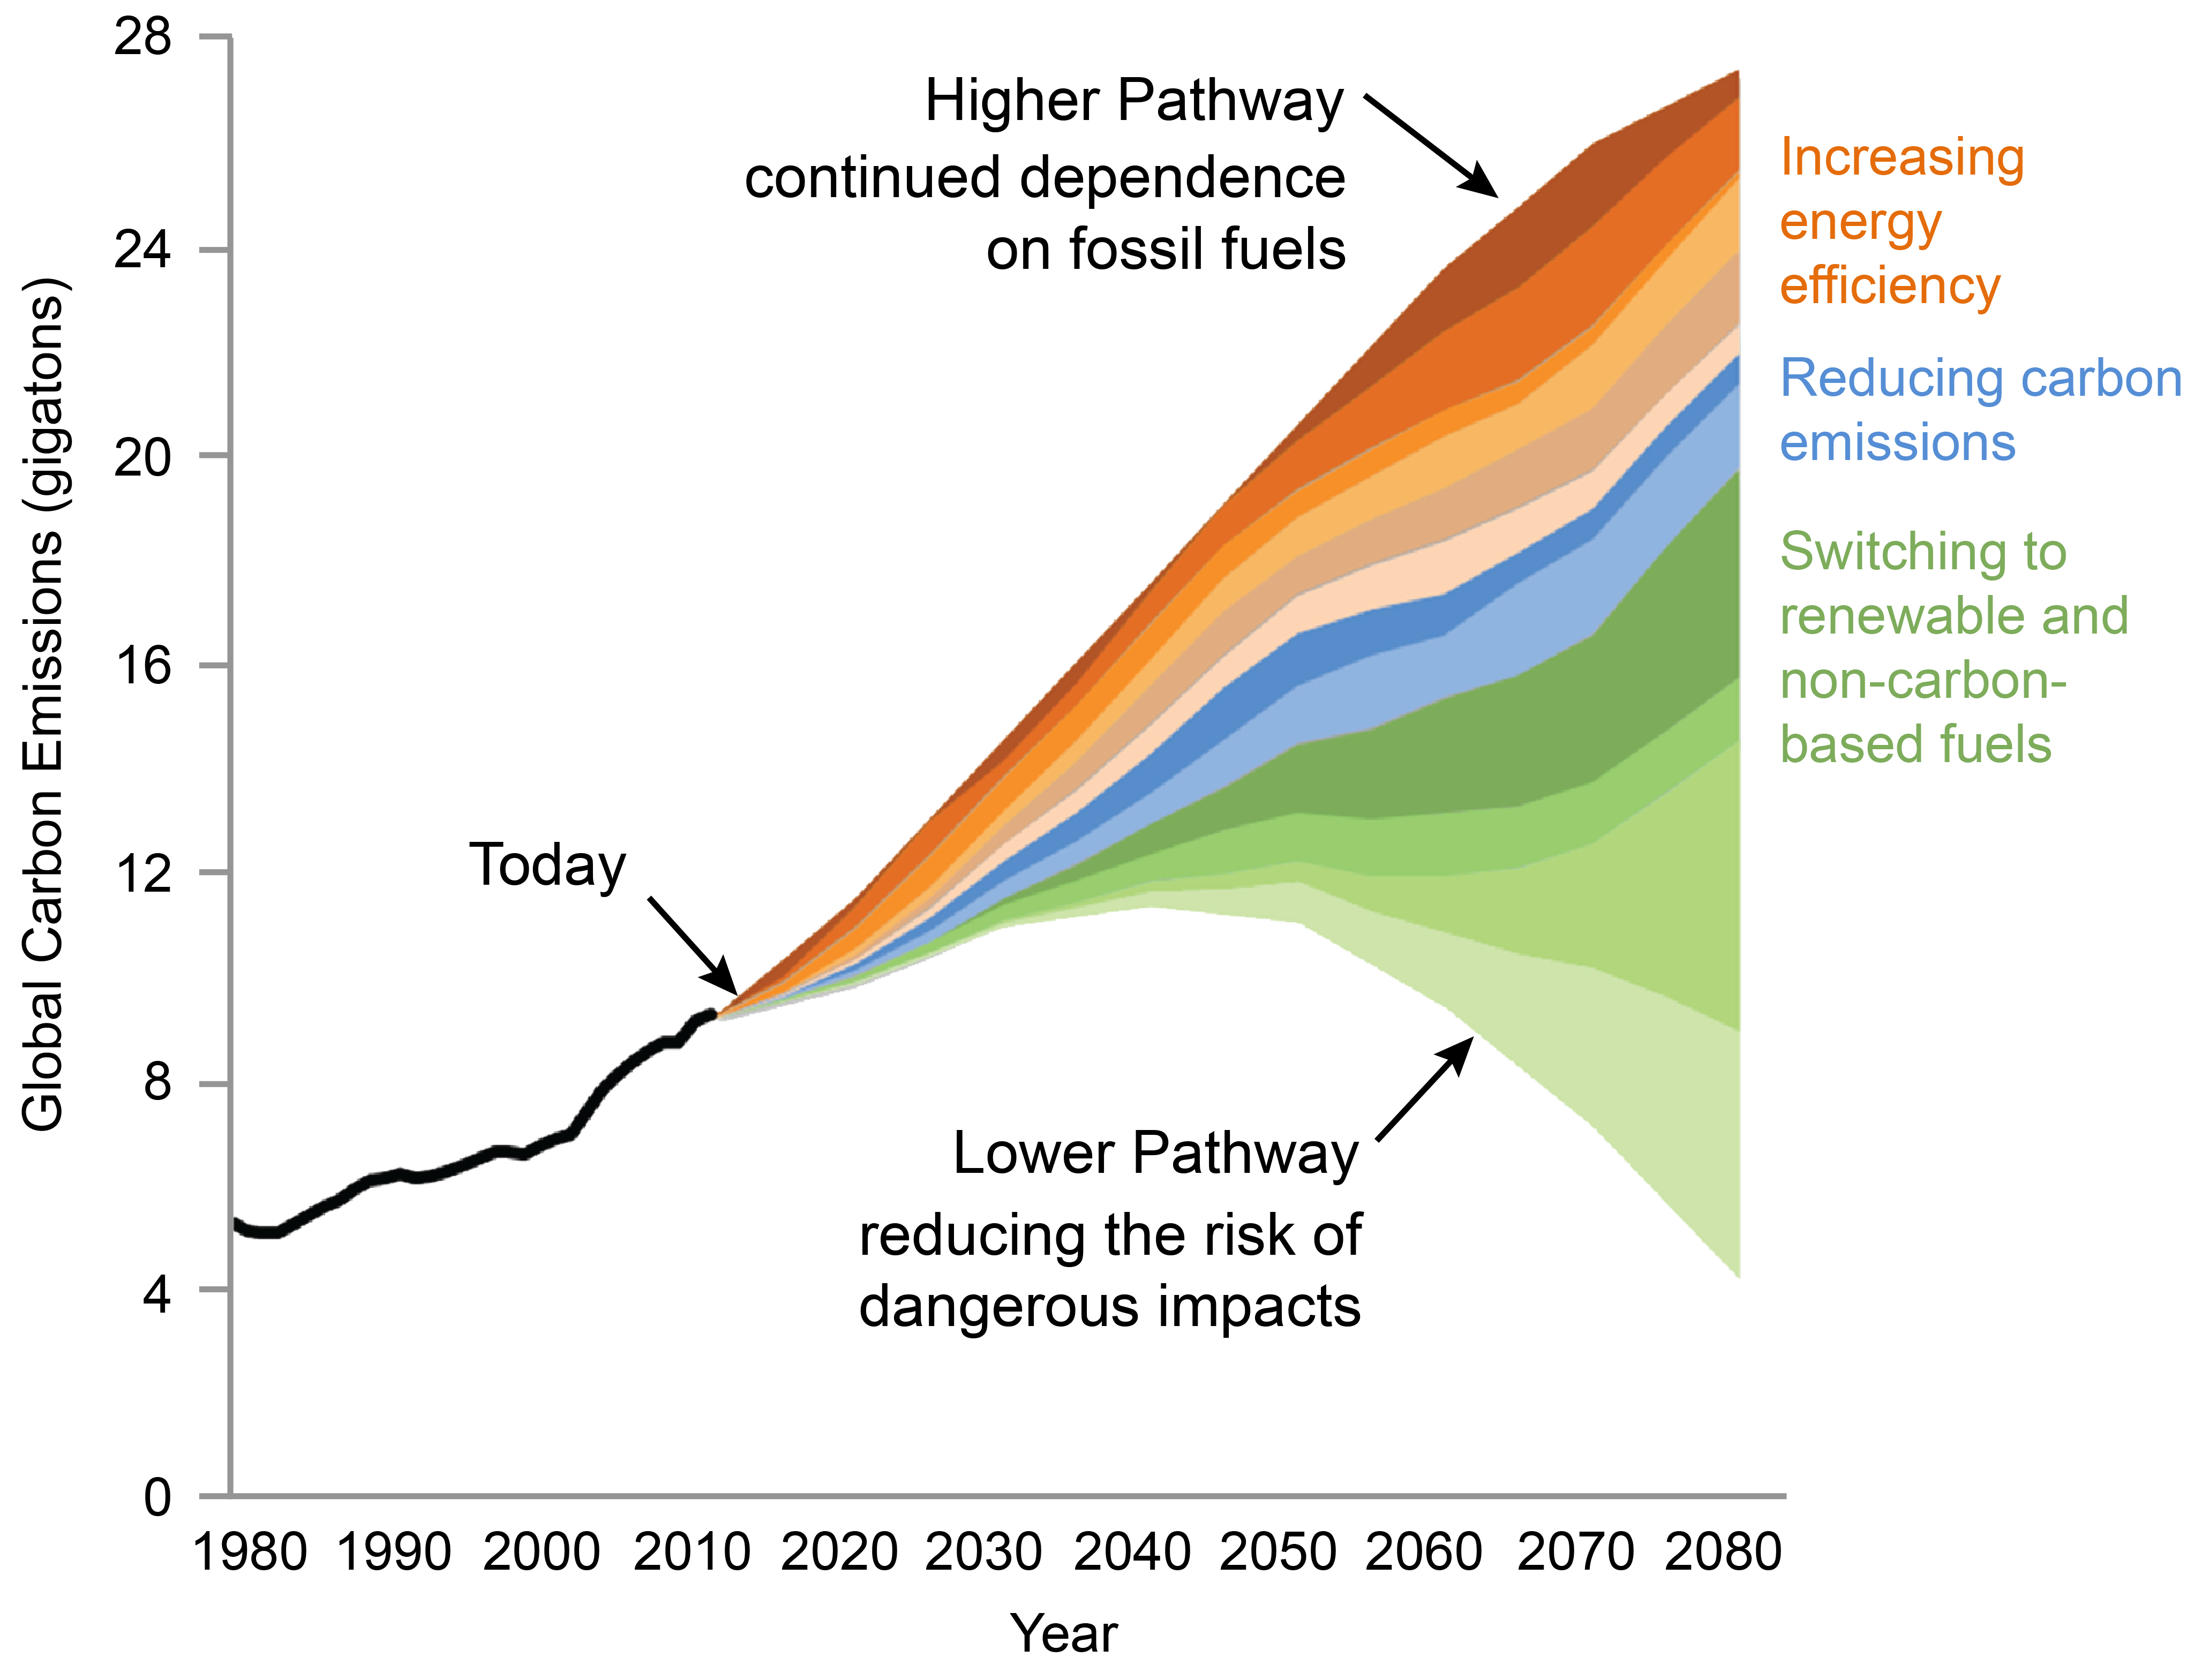
The most direct way to significantly reduce the magnitude of future climate change is to reduce the global emissions of GHGs. Emissions can be reduced in many ways, and increasing the efficiency of energy use is an important component of many potential strategies (Ch. 29: Mitigation). For example, because the transportation sector accounts for about 29% of the energy used in the United States, developing and driving more efficient vehicles and changing to fuels that do not contribute significantly to GHG emissions over their lifetimes would result in fewer emissions per mile driven. A large amount of energy in the United States is also used to heat and cool buildings, so changes in building design could dramatically reduce energy use (Ch 29: Mitigation). While there is no single approach that will solve all the challenges posed by climate change, there are many options that can reduce emissions and help prevent some of the potentially serious impacts of climate change (Figure A5.24).17
Figure A5.24: Pathways to Carbon Emissions Reduction
In theory, it may be possible to reverse some aspects of global warming through technological interventions called geoengineering, which can complement mitigation and adaptation. But many questions remain. Geoengineering approaches generally fall under two categories: 1) carbon dioxide removal and 2) reducing the amount of the sun’s energy that reaches Earth’s surface. Due to uncertain costs and risks of some geoengineering approaches, more traditional mitigation actions to reduce emissions of greenhouse gases (GHGs) are generally viewed as more feasible for avoiding the worst impacts from climate change currently. However, targeted studies to determine the feasibility, costs, risks, and benefits of various geoengineering techniques could help clarify the impacts.
30. Can geoengineering be used to remove carbon dioxide from the atmosphere or otherwise reverse global warming?
Removal of carbon dioxide (CO2) from the atmosphere could be undertaken by applying land management methods that increase carbon storage in forests, soils, wetlands, and other terrestrial or aquatic carbon reservoirs. Trees and plants draw down CO2 from the atmosphere during photosynthesis and store it in plant structures. Reforesting large tracts of deforested lands would help reduce atmospheric concentrations of CO2. New technologies could also be used to capture CO2 either directly from the atmosphere or at the point where it is produced (such as at coal-fired power plants) and store it underground. However, CO2 removal may be costly and has long implementation times, and the removal of CO2 from the atmosphere must be essentially permanent if climate impacts are to be avoided.17,36
Solar radiation management (SRM) is an intentional effort to reduce the amount of sunlight that reaches Earth’s surface by increasing the amount of sunlight reflected back to space. Since SRM does not reverse the increased concentrations of CO2 and other GHGs in the atmosphere, this approach does not address direct impacts from elevated CO2, such as damage to marine ecosystems from increasing ocean acidification.17,37 Instead, it introduces another human influence on the climate system that partially cancels some of the effects of increased GHGs in the atmosphere. SRM methods include making clouds brighter and more reflective, injecting reflective aerosol particles into the upper or lower atmosphere, or increasing the reflectivity of Earth’s surface. SRM can work in conjunction with CO2 removal and other mitigation efforts and can be phased out over time. Yet this method would require sustained costs, has not been well studied, and could have harmful unintended consequences, such as stratospheric ozone depletion.38
For more detailed information on geoengineering approaches please refer to the National Academies of Sciences, Engineering, and Math 2015 reports on Climate Intervention.
Ecological Effects
Global sea level is rising, primarily in response to two factors: 1) thermal expansion of ocean waters and 2) melting of land-based ice, both due to climate change. Thermal expansion refers to the physical expansion (or increase in volume) of water as it warms. Melting of mountain glaciers and the Antarctic and Greenland ice sheets contributes additional water to the oceans, thereby raising global average sea level. Global average sea level has risen 7–8 inches since 1880, and about 3 inches of that has occurred since 1993. Sea level rise will increasingly contribute to high tide flooding and intensify coastal erosion over the coming century.
31. What causes global sea level rise, and how will it affect coastal areas in the coming century?
At any given location, the situation is more complicated because other factors come into play. For example, coastlands are rising in some places and sinking in others due to both natural causes (such as tectonic shifts) and human activities (such as groundwater or hydrocarbon extraction). Where coastlands are rising as fast as (or faster than) sea level, relative local sea level may be unchanged (or decreasing). Where coastlands are sinking (called subsidence), relative local sea level may be rising faster than the global average (Figure A5.25) (see also Ch. 23: S. Great Plains). Other variables can influence relative sea level locally, including natural climate variability patterns (for example, El Niño/La Niña events) and regional shifts in wind and ocean current patterns.39
Global sea level rise is already affecting the U.S. coast in many locations (Ch. 8: Coastal). High tide flooding with little or no storm effects (also referred to as nuisance, sunny-day, or recurrent flooding), coastal erosion, and beach and wetland loss are all increasingly common due to decades of local relative sea level rise (Ch. 19: Southeast).39 Sea level is expected to continue rising at an accelerating rate this century under either a lower or higher scenario (RCP4.5 or RCP8.5), increasing the frequency of high tide flooding, intensifying coastal erosion and beach and wetland loss, and causing greater damage to coastal properties and structures due to stronger storm surges (Ch. 18: Northeast; Ch. 8: Coastal). Relative local sea level rise projections can be visualized at https://coast.noaa.gov/digitalcoast/tools/slr.html.
Figure A5.25: Relative Sea Level Projected to Rise Along Most U.S. Coasts
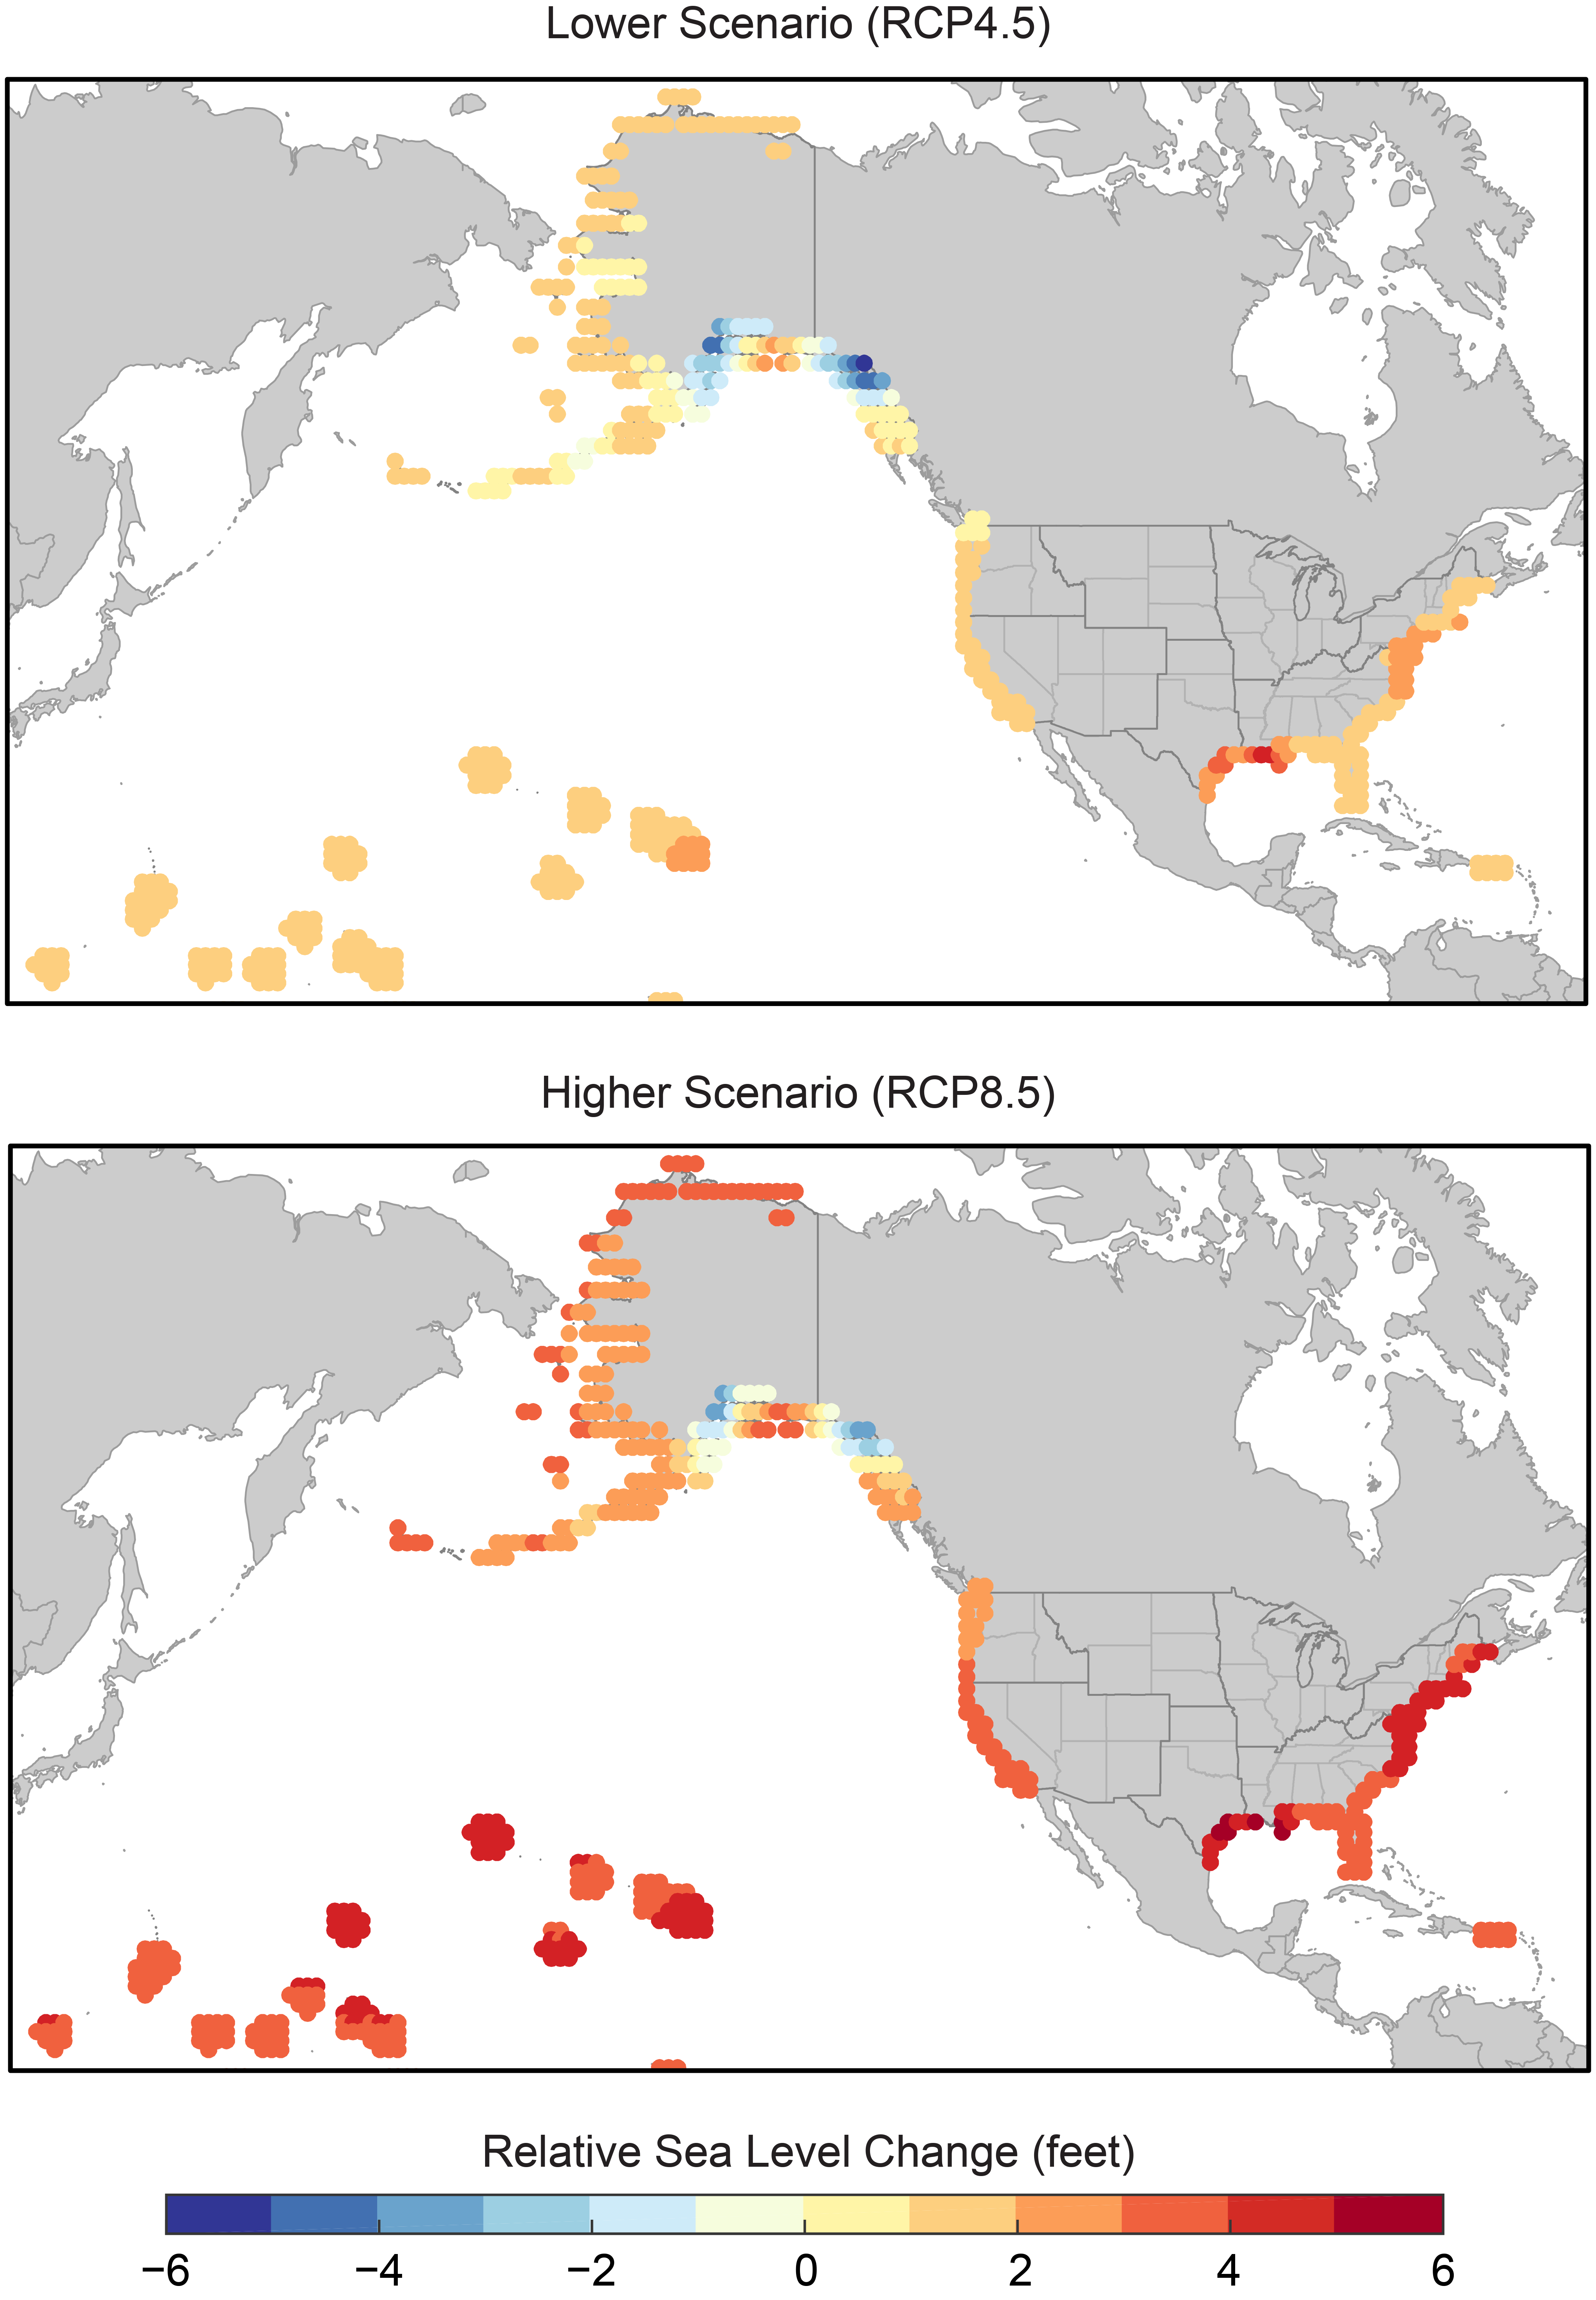
The Arctic region has warmed by about 3.6°F since 1900—double the rate of the global temperature increase. Consequently, sea ice cover has declined significantly over the last four decades. In the summer and fall, sea ice area has dropped by 40% and sea ice volume has dropped 70% relative to the 1970s and earlier. Decline in sea ice cover plays an important role in arctic ecosystems, ultimately impacting Alaska residents.
32. How does global warming affect arctic sea ice cover?
Arctic sea ice today is in the most reduced state since satellite measurements began in the late 1970s, and the current rate of sea ice loss is also unprecedented in the observational record (Figures A5.26 and A5.27) (see also Ch. 2: Climate). Arctic sea ice cover is sensitive to climate change because strong self-reinforcing cycles (positive feedbacks) are at play. As sea ice melts, more open ocean is exposed. Open ocean (a dark surface) absorbs much more sunlight than sea ice (a reflective white surface). That extra absorbed sunlight leads to more warming locally, which in turn melts more sea ice, creating a positive feedback (Ch. 2: Climate). Annual average arctic sea ice extent has decreased between 3.5% and 4.1% per decade since the early 1980s, has become thinner by 4.3 to 7.5 feet, and has started melting earlier in the year. September sea ice extent, when the arctic sea ice is at a minimum, has decreased by 10.7% to 15.9% per decade since the 1980s. Scientists project sea ice-free summers in the Arctic by the 2040s (Figure A5.27) (see Ch. 26: Alaska).2
Arctic sea ice plays a vital role in arctic ecosystems. Changes in the extent, duration, and thickness of sea ice, along with increasing ocean temperature and ocean acidity, alter the distribution of Alaska fisheries and the location of polar bears and walruses, all of which are important resources for Alaska residents, particularly coastal Native Alaska communities (Ch. 26: Alaska). Winter sea ice may keep forming in a warmer world, but it could be much reduced compared to the present (see Taylor et al. 20172 for more details).
Figure A5.26: Annual Minimum Sea Ice Extent Decreasing
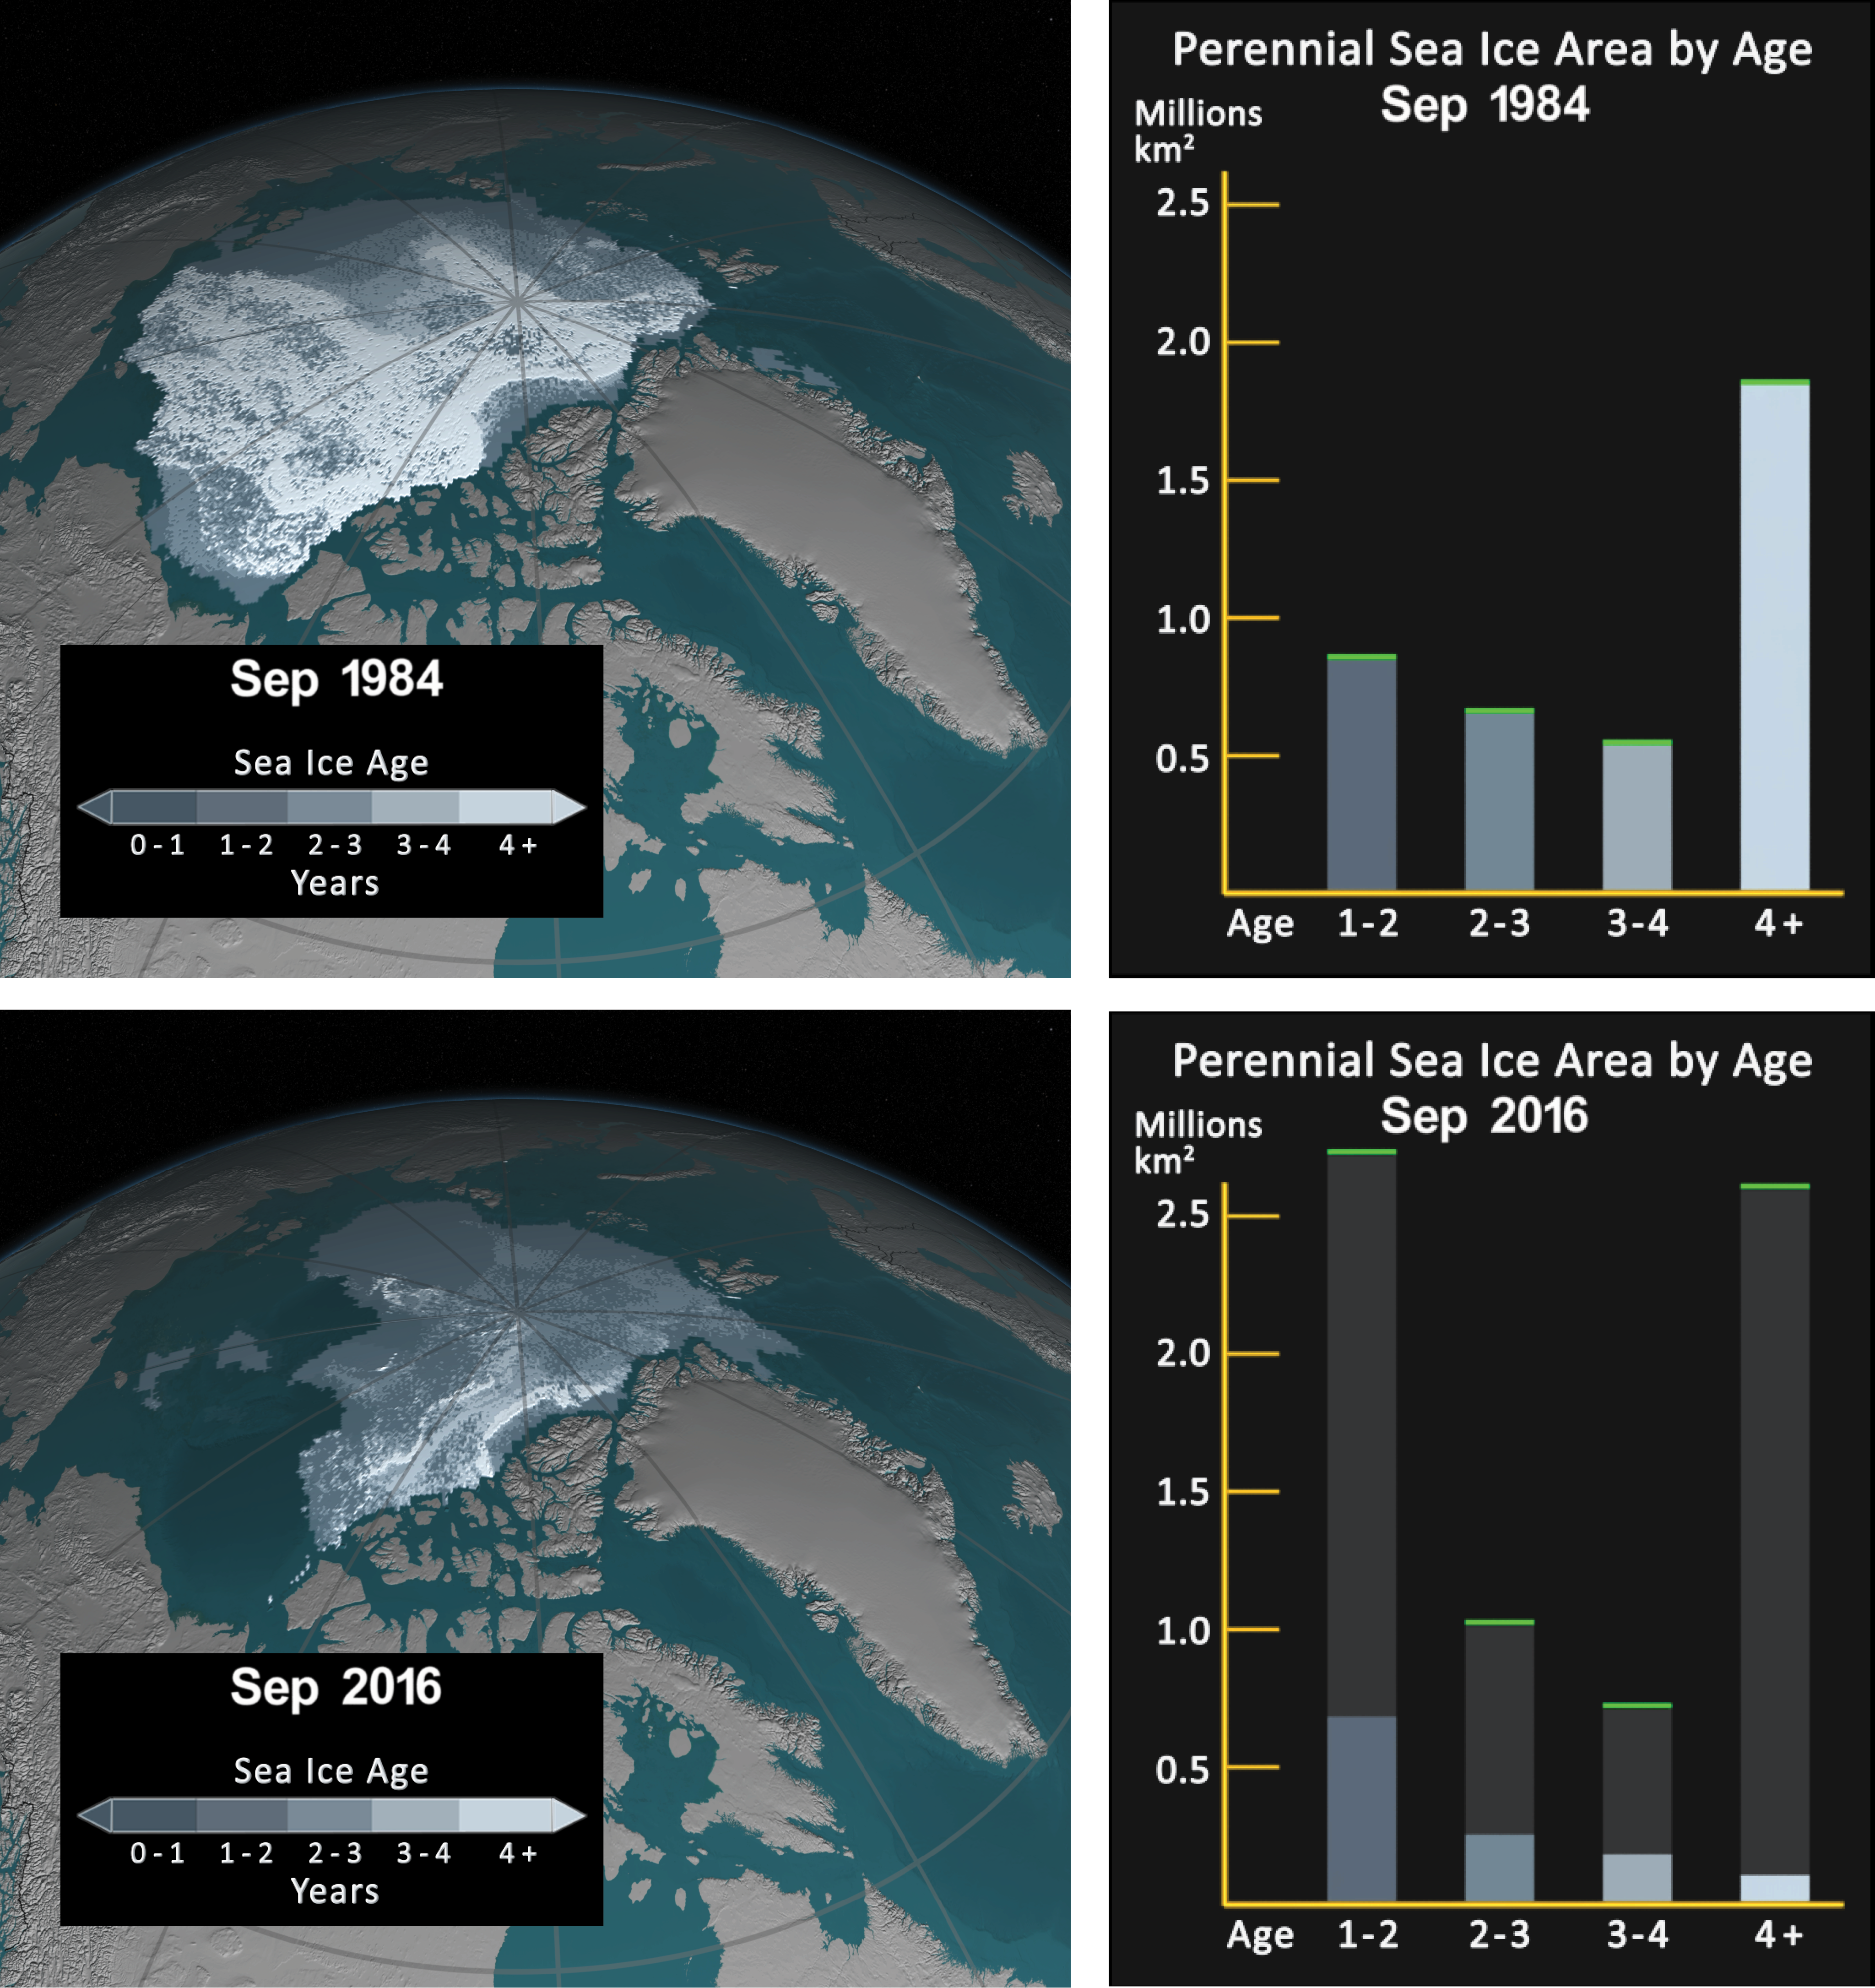
Figure A5.27: Decreasing Arctic Sea Ice Extent
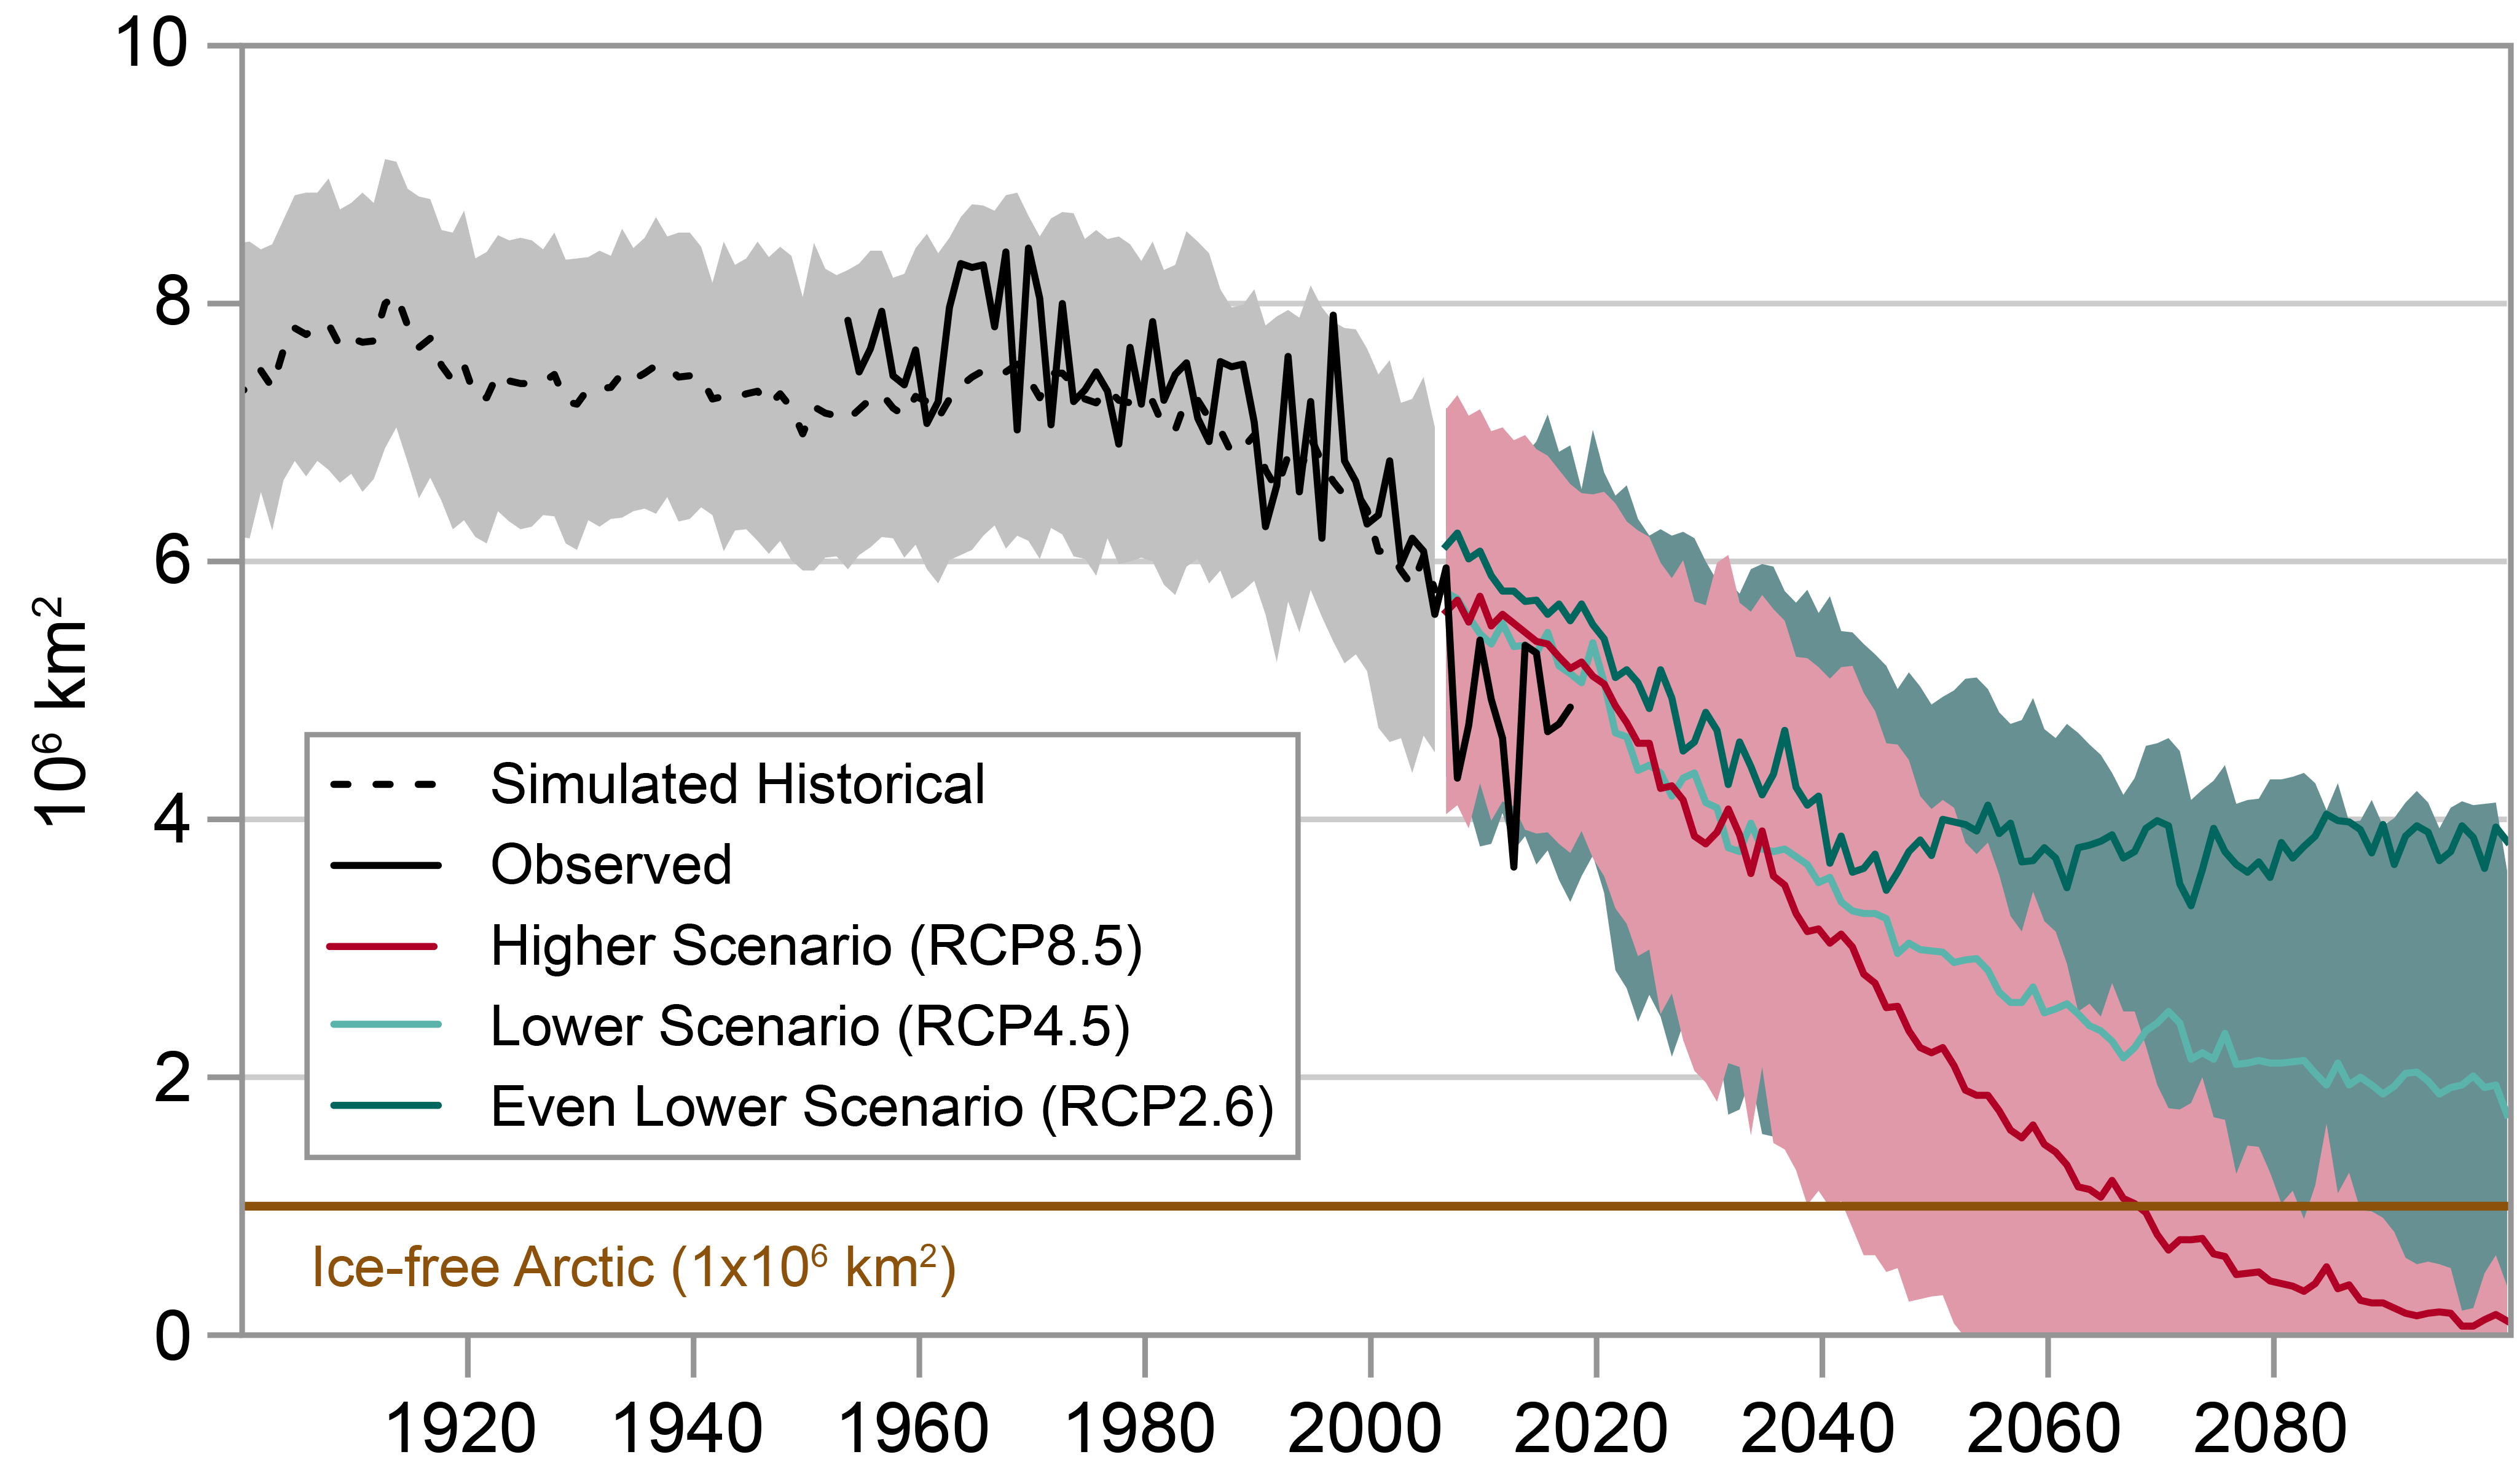
Yes. Overall, the ice sheets on both Greenland and Antarctica, the largest areas of land-based ice on the planet, are losing ice as the atmosphere and oceans warm. This ice loss is important both as evidence that the planet is warming and because it contributes to rising sea levels.
33. Is Antarctica losing ice? What about Greenland?
The Antarctic ice sheet is up to three miles deep and contains enough water to raise sea level about 200 feet. Because Antarctica is so cold, there is little melting of the ice sheet, even in summer. However, the ice flows towards the ocean where above-freezing ocean water speeds up the melting process, which breaks the ice into free-floating icebergs (a process called calving). Melting, calving, and the flow of ice into the oceans around Antarctica—especially on the Antarctic Peninsula—have all accelerated in recent decades, and the result is that Antarctica is losing about 100 billion tons of ice per year (contributing about 0.01 inch per year to sea level rise; Figure A5.28).39 While there has been slight growth in some parts of the Antarctic ice sheet, the gain is more than offset by ice mass loss elsewhere, especially in West Antarctica and along the Antarctic Peninsula. The West Antarctic ice sheet, which contains enough ice to raise global sea level by 10 feet, is likely to lose ice much more quickly if its ice shelves disintegrate. Additionally, warming oceans under the ice sheet are melting the areas where ice sheets go afloat in West Antarctica, exacerbating the risk of more rapid melt in the future.
Greenland contains only about one-tenth as much ice as the Antarctic ice sheet, but if Greenland’s ice sheet were to entirely melt, global sea level would still rise about 20 feet. (For additional information on the impacts of sea level rise on the United States directly, see Ch. 8: Coastal; Ch. 18: Northeast; Ch. 19: Southeast; and Ch. 20: U.S. Caribbean.) Annual surface temperatures in Greenland are warmer than Antarctica, so melting occurs over large parts of the surface of Greenland’s ice sheet each summer. Greenland’s melt area has increased over the past several decades (Figure A5.28). The Greenland ice sheet is presently thinning at the edges (especially in the south) and slowly thickening in the interior, increasing the steepness of the ice sheet, which has sped up the flow of ice into the ocean over the past decade. This trend will likely continue as the surrounding ocean warms. Greenland’s ice loss has increased substantially in the past decade, losing ice at an average rate of about 269 billion tons per year from April 2012 to April 2016 (contributing over 0.02 inch per year to sea level rise).4
Figure A5.28: Greenland and Antarctica Are Losing Ice

Glacier retreat is one of the most important lines of evidence for global warming. Around the world, glaciers in most mountain ranges are receding at unprecedented rates. Many glaciers have disappeared altogether this century, and many more are expected to vanish within a matter of decades. Glaciers will still be around within the next century, but they will be more isolated, closer to the poles, and at higher elevations.
34. How does climate change affect mountain glaciers?
Glaciers are critical freshwater reservoirs that slowly release water over warmer months, which helps sustain freshwater streamflows that provide drinking and irrigation water, as well as hydropower to downstream communities. However, increasing temperatures and decreasing amounts of precipitation falling as snow are major drivers of glacial retreat (see Ch. 2: Climate; Ch. 22: N. Great Plains; Ch. 24: Northwest; Ch. 26: Alaska). Glaciers retreat when melting and evaporation outpace the accumulation of new snow. Slope, altitude, ice flow, location, and volume also contribute to the speed and extent of glacial retreat, which complicates the relationship between increasing temperature and glacial melt. Due to these local factors, not all glaciers globally are retreating. For example, melting may slow as the glaciers retreat to the upper slopes, under headwalls and steep cliffs, and into more shaded areas.
In recent decades, the mountains of Glacier National Park (GNP) in Montana have experienced an increase in summer temperatures and a reduction in the winter snowpack that forms the mountain glaciers. The annual average temperature in GNP has increased by 2.4oF since 1900, spring and summer minimum temperatures have risen, and the percentage of precipitation that comes as rain rather than snow has increased.44,45,46 Mountain snowpacks now hold less water than they used to and have begun to melt at least two weeks earlier in the spring. This earlier melting alters glacier stability, as well as downstream water supplies, with implications for wildlife, agriculture, and fire management.
In a recent study, scientists looked at 39 glaciers in and around GNP and compared aerial photos and digital maps from 1966 to 2016. Currently, only 26 glaciers are bigger than 25 acres, the minimum size used for defining a glacier. When GNP was established early in 1910, it is estimated that there were 150 glaciers larger than 25 acres. Long-term studies of glacier size have shown that the rate of melting has fluctuated in response to decade-long climate cycles and that the melting rate has risen steeply since about 1980.47,48 Over the next 30 years, glaciologists project that most glaciers in GNP will melt to a point where they are too small to be active glaciers, and some may disappear completely. All glaciers in the park are under severe threat of completely melting by the end of the century.4
The oceans have absorbed over 90% of the excess heat energy and more than 25% of the carbon dioxide (CO2) that is trapped in the atmosphere as a result of human-produced greenhouse gases (GHGs). Due to this increase in GHGs in the atmosphere, all ocean basins are warming and experiencing changes in their circulation and seawater chemistry, all of which alter ecosystem structure and marine biodiversity.
35. How are the oceans affected by climate change?
The world’s oceans have been and will continue to be impacted by climate change. More than 50% of the world’s marine ecosystems are already exposed to conditions (temperature, oxygen, salinity, and pH) that are outside the normal range of natural climate variability, and this percentage will rise as the planet warms (Ch. 9: Oceans).1 Global warming will alter the ability of species to survive and can reorganize ecosystems, creating novel habitats and/or reducing biodiversity. Some species are responding to increased ocean temperatures by shifting their geographic ranges, generally to higher latitudes, or altering the timing of life stages (for example, spawning; Figure A5.29) (see Ch. 7: Ecosystems; Ch. 18: Northeast).49 Other species are unable to adapt as their habitats deteriorate (for example, due to loss of sea ice) or the rate of climate-related changes occurs faster than they can move (for example, in the case of sessile organisms, such as oysters and corals).
Physical changes to the ocean system will also occur. Observations and projections suggest that in the next 100 years, the Gulf Stream (part of the larger “ocean conveyor belt”) could slow down as a result of climate change, which could increase regional sea level rise and alter weather patterns along the U.S. East Coast.13,50
In addition to causing changes in temperature, precipitation, and circulation, increasing atmospheric levels of CO2 have a direct effect on ocean chemistry. The oceans currently absorb about a quarter of the 10 billion tons of CO2 emitted to the atmosphere by human activities every year. Dissolved CO2 reacts with seawater to make it more acidic. This acidification impacts marine life such as shellfish and corals, making it more difficult for these calcifying animals to make their hard external structures (Ch. 8: Oceans; Ch. 24: Northwest).
Over the last 50 years, inland seas, estuaries, and coastal and open oceans have all experienced major oxygen losses. A warmer ocean holds less oxygen. Warming also changes the physical mixing of ocean waters (for example, upwelling and circulation) and can interact with other human-induced changes. For example, fertilizer runoff entering the Gulf of Mexico through the Mississippi River can stimulate harmful algal blooms. These blooms eventually decay, creating large “dead zones” of water with very low oxygen, where animals cannot survive. Warmer conditions slow down the rate at which this oxygen can be replaced, exacerbating the impact of the dead zone. These are just a few of the changes projected to occur, as detailed in Chapter 9: Oceans.
Figure A5.29: Projected Changes in Maximum Fish Catch Potential
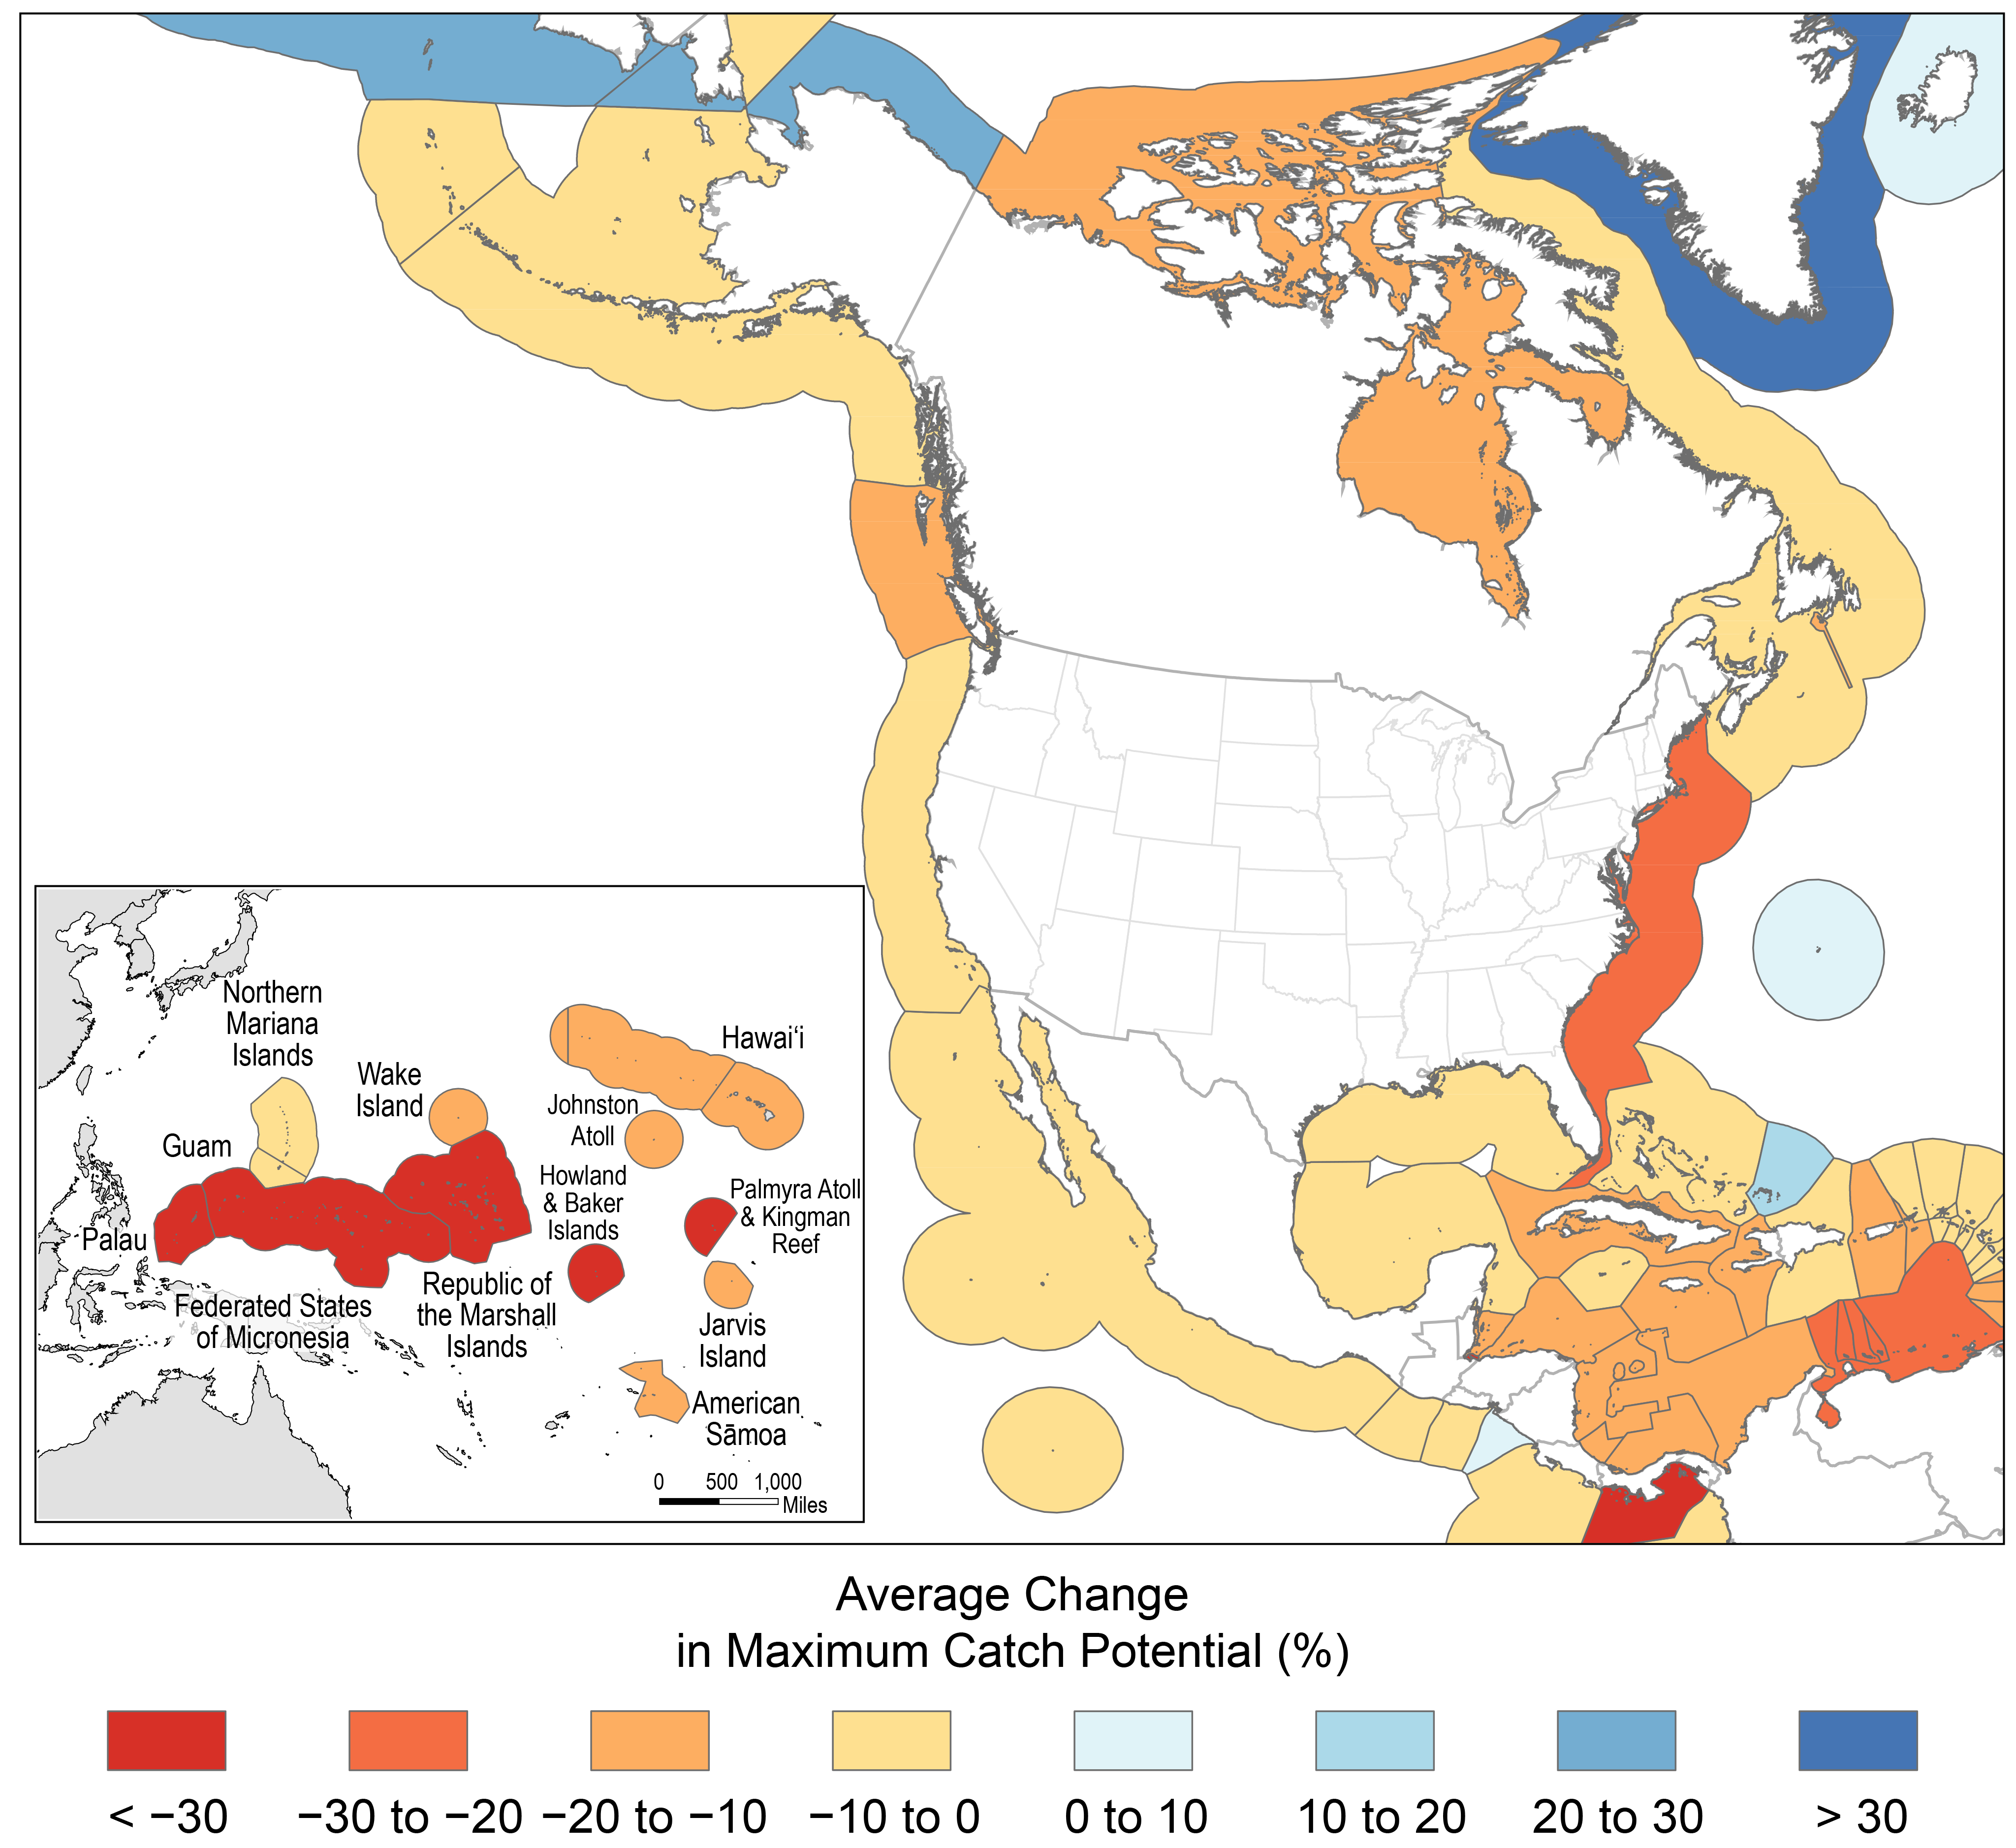
The oceans currently absorb more than a quarter of the 10 billion tons of carbon dioxide (CO2) released annually into the atmosphere from human activities. CO2 reacts with seawater to form carbonic acid, so more dissolved CO2 increases the acidity of ocean waters. When seawater reaches a certain acidity, it eats away at, or corrodes, the shells and skeletons made by shellfish, corals, and other species—or impedes the ability of organisms to grow them in the first place.
36. What is ocean acidification, and how does it affect marine life?
Since the beginning of the Industrial Revolution, the acidity of surface ocean waters has increased approximately 30%. The oceans will continue to absorb CO2 produced by human activities, causing acidity to rise further (Figure A5.30). Ocean waters are not acidifying at the same rate around the globe, largely due to differences in ocean temperature. Warmer, low-latitude waters naturally hold less CO2 and therefore tend to be less acidic. Colder, high-latitude waters naturally hold more CO2, have increased acidity, and are closer to the threshold where shells and skeletons tend to corrode. Coastal and estuarine waters are also acidified by local phenomena, such as freshwater runoff from land, nutrient pollution, and upwelling.1
In the past five years, scientists have found that the shells of small planktonic snails (called pteropods) are already partially dissolved in locations where ocean acidification has made ocean waters corrosive, such as in the Pacific Northwest and near Antarctica. Pteropods are an important food source for Pacific salmon, so impacts to pteropods could cause changes up the food chain. Acidification has also affected commercial oyster hatcheries in the Pacific Northwest, where acidified waters impaired the growth and survival of oyster larvae (Ch. 24: Northwest).
Because marine species vary in their sensitivity to ocean acidification, scientists expect some species to decline and others to increase in abundance in response to this environmental change. Relative changes in species performance can ripple through the food web, reorganizing ecosystems as the balance between predators and prey shifts and habitat-forming species increase or decline. Habitat-forming species, such as corals and oysters, that grow by using minerals from the seawater to build mass are particularly vulnerable. It is difficult to predict exactly how ocean acidification will change ecosystems. Scientists and managers are now using computer models to project potential consequences to fisheries, protected species, and habitats (see Ch. 9: Oceans for more details).
Figure A5.30: Projected Change in Surface Ocean Acidity
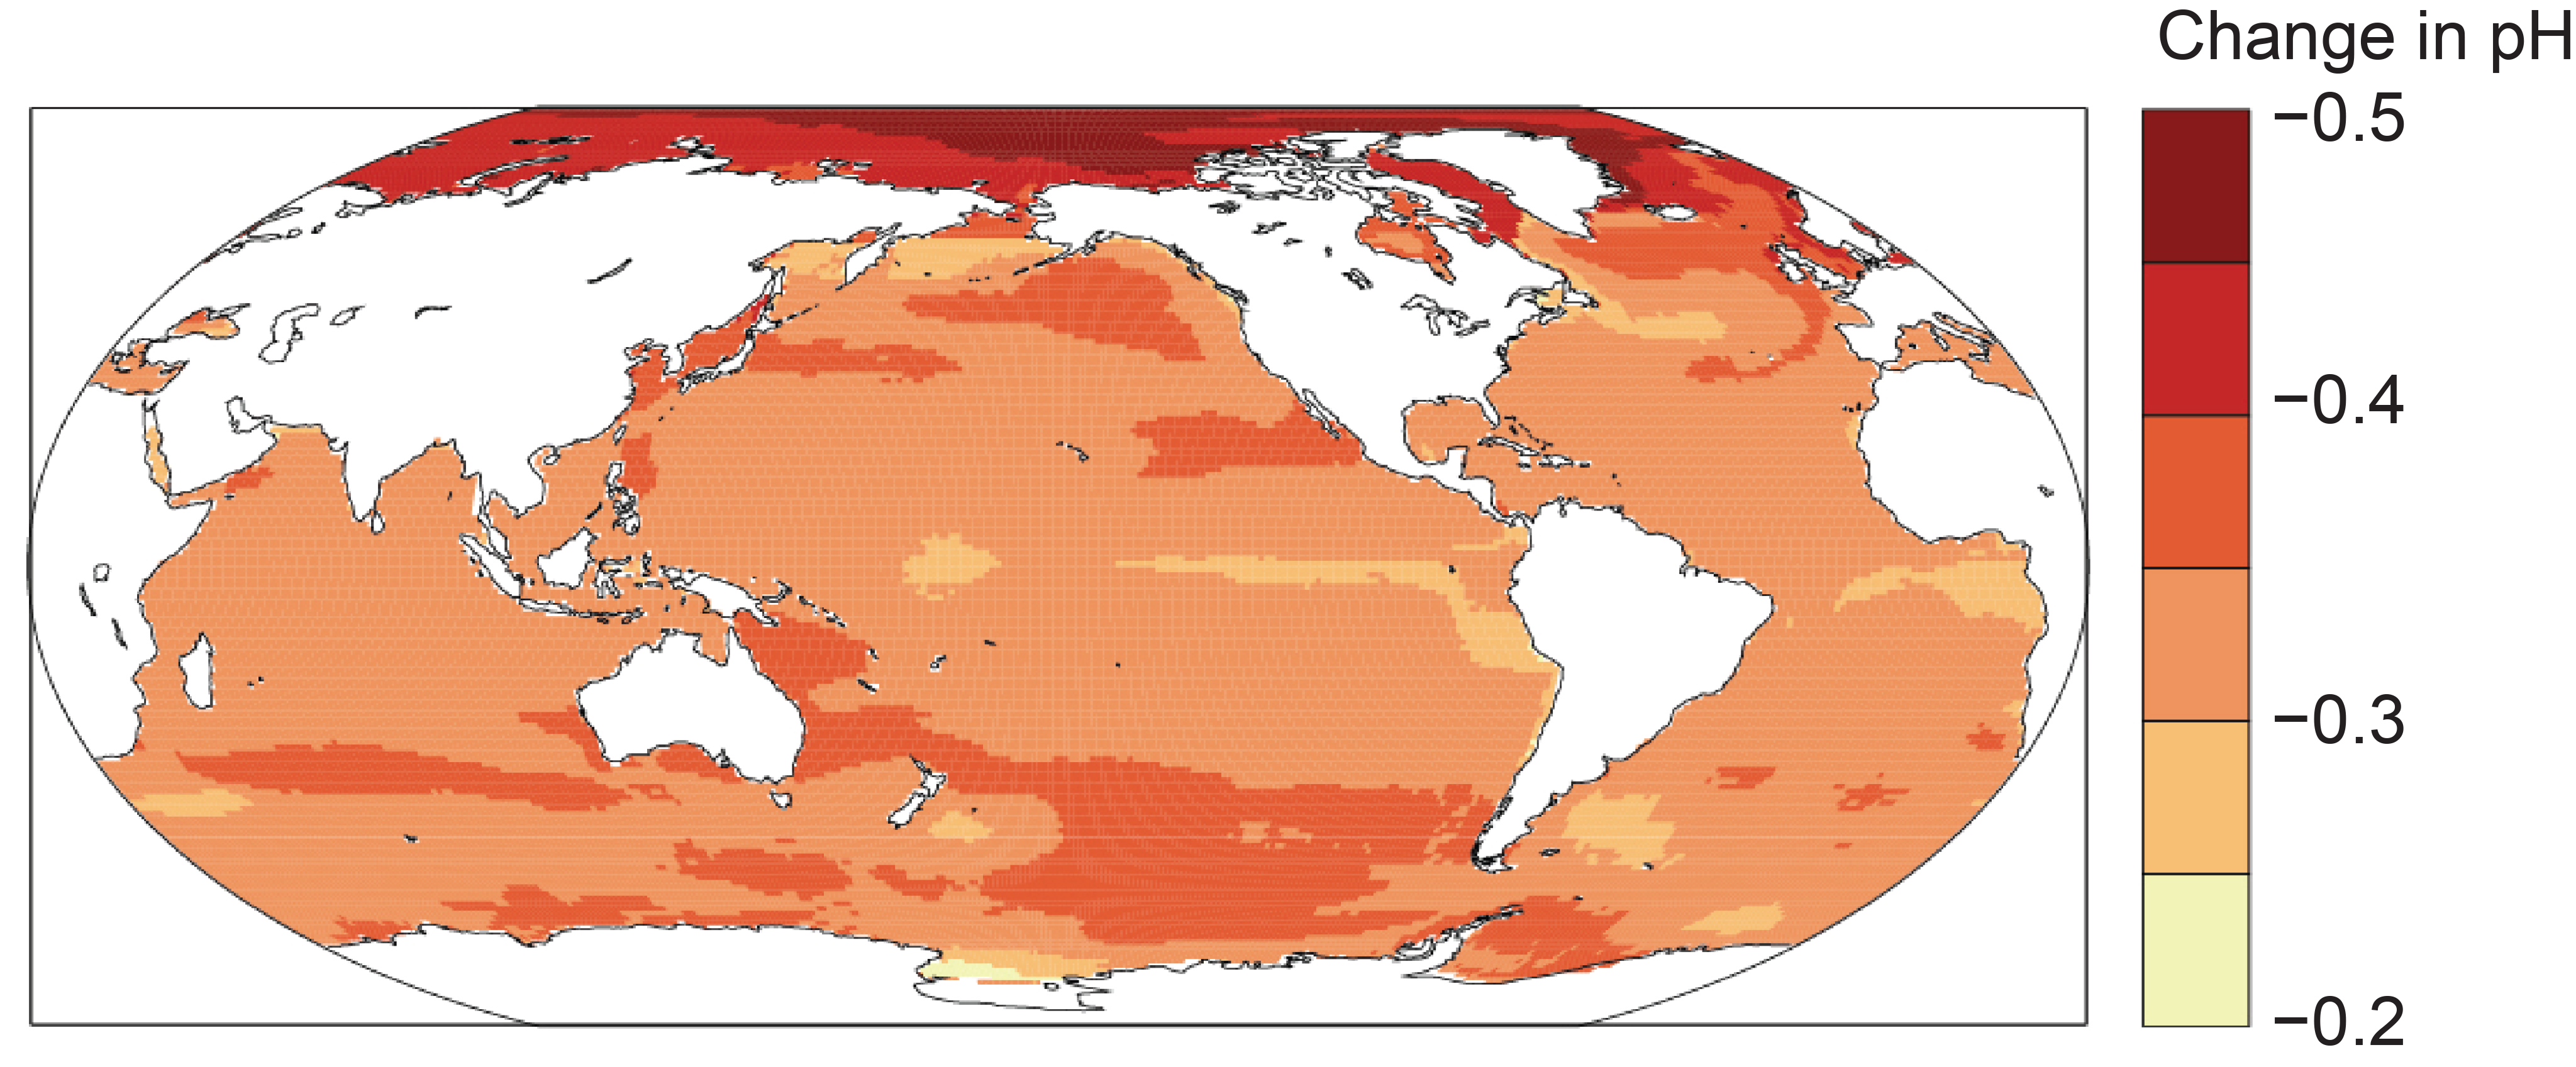
Plant communities and crops respond to higher atmospheric carbon dioxide concentrations in multiple ways. Some plant species are more responsive to changes in carbon dioxide than others, which makes projecting changes difficult at the plant community level. For approximately 95% of all plant species, an increase in carbon dioxide represents an increase in a necessary resource and could stimulate growth, assuming other factors like water and nutrients are not limiting and temperatures remain in a suitable growing range.
37. How do higher carbon dioxide concentrations affect plant communities and crops?
Along with water, nutrients, and sunlight, carbon dioxide (CO2) is one of four resources necessary for plants to grow. At the level of a single plant, all else being equal, an increase in CO2 will tend to accelerate growth because of accelerated photosynthesis, but a plant’s ability to respond to increased CO2 may be limited by soil nutrients. Exactly how much growth stimulation will occur varies significantly from species to species. However, the interaction between plants and their surrounding environment complicates the relationship. As CO2 increases, some species may respond to a higher degree and become more competitive, which may lead to changes in plant community composition. For example, loblolly pine and poison ivy both grow in response to elevated CO2; however, poison ivy responds more and becomes more competitive.53
The expected effects of increased CO2 in agricultural plants are in line with these same patterns. Some crops that are not experiencing stresses from nutrients, water, or biotic stresses such as pests and disease are expected to benefit from CO2 increases in terms of growth. However, the quality of those crops can suffer, as rising levels of atmospheric CO2 can decrease dietary iron and other micronutrients (Ch. 14: Human Health). Plants often become less water stressed as CO2 levels increase, because high atmospheric CO2 allows plants to photosynthesize with lower water losses and higher water-use efficiencies. The magnitude of the effect varies greatly from crop to crop. However, for many crops in most U.S. regions, the benefits will likely be mostly or completely offset by increased stresses, such as higher temperatures, worsening air quality, and decreased ground moisture (Ch. 10: Ag & Rural). If crops and weeds are competing, then rising CO2, in general, is more likely to stimulate the weed than the crop, with negative effects on production unless weeds are controlled.54 Controlling weeds, however, is slightly more difficult, as rising CO2 can reduce the efficacy of herbicides through enhanced gene transfer between crops and weedy relatives.54
Downstream impacts of rising CO2 on plants can be significant. Increasing CO2 concentrations provide an opportunity for cultivators to select plants that can exploit the higher CO2 conditions and convert it to additional seed yield.55 However, an area of emerging science suggests that rising CO2 can reduce the nutritional quality (protein and micronutrients) of major crops.56 In addition, rising CO2 can reduce the protein concentration of pollen sources for bees.57 Climate change also influences the amount and timing of pollen production. Increased CO2 and temperature are correlated with earlier and greater pollen production and a longer allergy season (Ch. 13: Air Quality).
Please see Chapter 10: Ag & Rural, Chapter 6: Forests, and Ziska et al. (2016)56 for more information on how climate change affects crops and plants.
It is difficult to determine how much of a role climate change has played in affecting recent wildfire activity in the United States. However, climate is generally considered to be a major driver of wildfire area burned. Over the last century, wildfire area burned in the mountainous areas of the western United States was greater during periods of low precipitation, drought, and high temperatures. Increased temperatures and drought severity with climate change will likely lead to increased fire area burned in fire-prone regions of the United States.
38. Is climate change affecting U.S. wildfires?
Climate is a major determinant of vegetation composition and productivity, which directly affect the type, amount, and structure of fuel available for fires. Climate also affects fuel moisture and the length of the season when fires are likely. Higher temperatures and lower precipitation result in lower fuel moisture, making fire spread more likely when an ignition occurs (if fuel is available). In mountainous areas, higher temperatures, lower snowpack, and earlier snowmelt lead to a longer fire season, lower fuel moisture, and higher likelihood of large fires.58,59 Forest management practices are also a factor in determining the likelihood of ignition, as well as fire duration, extent, and intensity (Ch. 6: Forests).23
Long records of fire provided by tree-ring and charcoal evidence show that climate is the primary driver of fire on timescales ranging from years to millennia.60 During the 20th century in the western United States, warm and dry conditions in spring and summer generally led to greater area burned in most places, particularly more mountainous and northerly locations (Figure A5.31).60 The frequency of large forest fires (greater than 990 acres) has increased since the 1970s in the Northwest (1,000%) and Northern Rocky Mountains (889%), followed by forests in the Southwest (462%), Southern Rocky Mountains (274%), and Sierra Nevada (256%).59 Dry forests in these regions account for about half of the total forest area burned since 1984. Globally, the length of the fire season (the time of year when climate and weather conditions are conducive to fire) has increased by 19% between 1979 and 2013, and it has become significantly longer over this period in most of the United States.61
With climate change, higher temperatures and more severe drought will likely lead to increased area burned in many ecosystems of the western and southeastern United States. By the mid-21st century, annual area burned is expected to increase 200%–300% in the contiguous western United States and 30% in the southeastern United States.62 Over time, warmer temperatures and increased area burned can alter vegetation composition and productivity, which in turn affect fire occurrence. In arid regions, vegetation productivity may decrease sufficiently that fire will become less frequent. In other regions, climate may become less of a limiting factor for fire, and fuels may become more important in determining fire severity and extent.63 In a warmer climate, wildfire is expected to be a catalyst for ecosystem change in all fire-prone ecosystems.
Figure A5.31: Area Burned by Large Wildfires Has Increased

Yes. Climate change can contribute to the spread of mosquitoes and ticks. A warmer climate enhances the suitability of habitats that were formerly too cold to support mosquito and tick populations, thus allowing these vectors, and the diseases they transmit, to invade new areas.
39. Does climate change increase the spread of mosquitoes or ticks?
Mosquitoes and ticks are dependent on external sources for body heat, thus they develop from egg to adult more quickly under warmer conditions, producing more generations in a shorter time. Warming also speeds up population growth of the parasites and pathogens that mosquitoes transmit (including the agents of Zika virus, dengue fever, West Nile virus, and malaria), as well as the rate at which mosquitoes bite people and other hosts. Additionally, warmer conditions facilitate the spread of mosquitoes by increasing the length of the growing season and by decreasing the likelihood of winter die-offs due to extreme cold (Ch. 14: Human Health).65
Blacklegged (deer) ticks are the main vector (or transmitter) of Lyme disease in the United States. These ticks require a minimum number of days above freezing to persist. As a result, some northern and high-elevation areas cannot be invaded because the warm season is too short to allow each life stage to find an animal host before it needs to retreat underground. But as higher-latitude and higher-altitude areas continue to warm, blacklegged ticks may expand their range northward and higher in elevation (Figure A5.32) (see also Ch. 14: Human Health).66,67 Studies show that ticks emerge earlier in the spring under warmer conditions, suggesting that the main Lyme disease season will move earlier in the spring.65 Thus, earlier onset of warm spring conditions and warm summers and falls increase the establishment and resilience of tick populations.
