The chapter lead authors were identified in October 2016, and the author team was recruited in October and November 2016. Authors were selected for their interest and expertise in areas critical to the Midwest with an eye on diversity in expertise, level of experience, and gender. The writing team engaged in conference calls starting in December 2016, and calls continued on a regular basis to discuss technical and logistical issues related to the chapter. The Midwest chapter hosted an engagement workshop on March 1, 2017, with the hub in Chicago and satellite meetings in Iowa, Indiana, Michigan, and Wisconsin. The authors also considered other outreach with stakeholders, inputs provided in the public call for technical material, and incorporated the available recent scientific literature to write the chapter. Additional technical authors were added as needed to fill in the gaps in knowledge.
Discussion amongst the team members, along with reference to the Third National Climate Assessment and conversations with stakeholders, led to the development of six Key Messages based on key economic activities, ecology, human health, and the vulnerability of communities. In addition, care was taken to consider the concerns of tribal nations in the northern states of the Midwest. The Great Lakes were singled out as a special case study based on the feedback of the engagement workshop and the interests of other regional and sector chapters.
Interaction between the lakes and the atmosphere in the Great Lakes region (e.g., through ice cover, evaporation rates, moisture transport, and modified pressure gradients) is crucial to simulating the region’s future climate (i.e., changes in lake levels or regional precipitation patterns).315,316 Globally recognized modeling efforts (i.e., the Coupled Model Intercomparison Project, or CMIP) do not include a realistic representation of the Great Lakes, simulating the influence of the lakes poorly or not at all.192,198,317,318,319 Ongoing work to provide evaluation, analysis, and guidance for the Great Lakes region includes comparing this regional model data to commonly used global climate model data (CMIP) that are the basis of many products practitioners currently use (i.e., NCA, IPCC, NOAA State Climate Summaries). To address these challenges, a community of regional modeling experts are working to configure and utilize more sophisticated climate models that more accurately represent the Great Lakes’ lake–land–atmosphere system to enhance the understanding of uncertainty to inform better regional decision-making capacity (see http://glisa.umich.edu/projects/great-lakes-ensemble for more information).
Key Message 1: Agriculture
The Midwest is a major producer of a wide range of food and animal feed for national consumption and international trade. Increases in warm-season absolute humidity and precipitation have eroded soils, created favorable conditions for pests and pathogens, and degraded the quality of stored grain (very likely, very high confidence). Projected changes in precipitation, coupled with rising extreme temperatures before mid-century, will reduce Midwest agricultural productivity to levels of the 1980s without major technological advances (likely, medium confidence).
Description of evidence base
Humidity is increasing. Feng et al. (2016)3 show plots of trends in surface and 850 hPa specific humidity of 0.4 and 0.2 g/kg/decade, respectively, from 1979–2014 for the April–May–June period across the Midwest. These represent increases of approximately 5% and 3% per decade, respectively. Automated Surface Observing Stations in Iowa320 having dew point records of this length and season show dew point temperature increases of about 1°F per decade. Brown and DeGaetano (2013)49 show increasing dew points in all seasons throughout the Midwest. Observed changes in annual average maximum temperature for the Midwest over the 20th century (Vose et al. 2017,54 Table 6.1) have been less than 1°F. However, future projected changes in annual average temperature (Vose et al. 2017,54 Table 6.4), as well as in both warmest day of the year and warmest 5-day 1-in-10 year events (Vose et al. 2017,54 Table 6.5), are higher for the Midwest than in any other region of the United States.
Garbrecht et al. (2007)321 state that precipitation changes are sufficient to require U.S. policy changes for agricultural lands. The Soil Erosion Site (http://soilerosion.net/water_erosion.html) describes the soil erosion process and provides links to soil erosion models.322 Nearing et al. (2004)44 report that global climate models project increases in erosivity (the ability or power of rain to cause soil loss) across the northern states of the United States over the 21st century.
Spoilage in stored grain is caused by mold growth and insect activity, which are related to the moisture content and temperature of the stored grain.323 The ability of fungi to produce mycotoxins, including aflatoxin and fumonisins, is largely influenced by temperature, relative humidity, insect attack, and stress conditions of the plants.57,324 Humidity has a determining influence on the growth rate of these degradation agents.325
Germination of wheat declined in storage facilities where moisture level increased with time.326 Freshly harvested, high-moisture content grain must be dried to minimize (or prevent) excessive respiration and mold growth on grains.327 The storage life of grain is shortened significantly when stored at warm temperatures. One day of holding warm, wet corn before drying can decrease storage life by 50%.45
Feng et al. (2016)3 show humidity is rising in the Midwest in the warm season. Cook et al. (2008)4 show that the factors leading to these humidity increases (warming Gulf of Mexico and strengthening of the Great Plains Low-Level Jet) will increase in a warming climate.
The ability of fungi to produce mycotoxins is largely influenced by temperature, relative humidity, insect attack, and stress conditions of the plants.324 More extreme rainfall events would favor formation of Deoxynivalenol, also known as vomitoxin.57
Hatfield et al. (2011,50 Table 1) give the relationships between temperature and vegetative function as well as reproductive capacity. This work was expanded and updated in Walthall et al. (2012).328
Mader et al. (2010)74 report a comprehensive climate index for describing the effect of ambient temperature, relative humidity, radiation, and wind speed on environmental stress in animals. St-Pierre et al. (2003)329 provide tables estimating economic losses in dairy due to reduced reproduction. The data show a strong gradient across the Midwest (with losses in Iowa, Illinois, and Indiana being three times the losses in Minnesota, Wisconsin, and Michigan under the current climate). Temperature and humidity increases projected for the Midwest will increase economic losses across the entire region. Lewis and Bunter (2010)330 document heat stress effects of temperature on pig production and reproduction.
St-Pierre et al. (2003)329 provide tables estimating economic losses in dairy, beef, swine, and poultry, resulting in declines from both meat/milk/egg production. The data show a strong gradient across the Midwest (with losses in Iowa, Illinois, and Indiana being twice the losses in Minnesota, Wisconsin, and Michigan under the current climate). Temperature and humidity increases projected for the Midwest will increase losses across the entire region. Babinszky et al. (2011)75 identified temperature thresholds for meat/egg/milk production, beyond which performance declines. The adverse effects of heat stress include high mortality, decreased feed consumption, poor body weight gain and meat quality in broiler chickens, and poor laying rate, egg weight, and shell quality in laying hens.76
Takle et al. (2013)65 found that by mid-century, yields of corn and soybean are projected to fall well below projections based on extrapolation of trends since 1970 even under an optimistic economic scenario, with larger interannual variability in yield and total production. Liang et al. (2017)2 report that the ratio of measured agricultural output to measured inputs would drop by an average 3% to 4% per year under medium to high emissions scenarios and could fall to pre-1980 levels by 2050 even when accounting for present rates of innovation. Schauberger et al. (2017)66 found that the impact of exposure to temperatures from 30°C to 36°C projected for the end of the century under RCP8.5 creates yield losses of 49% for maize and 40% for soybean.
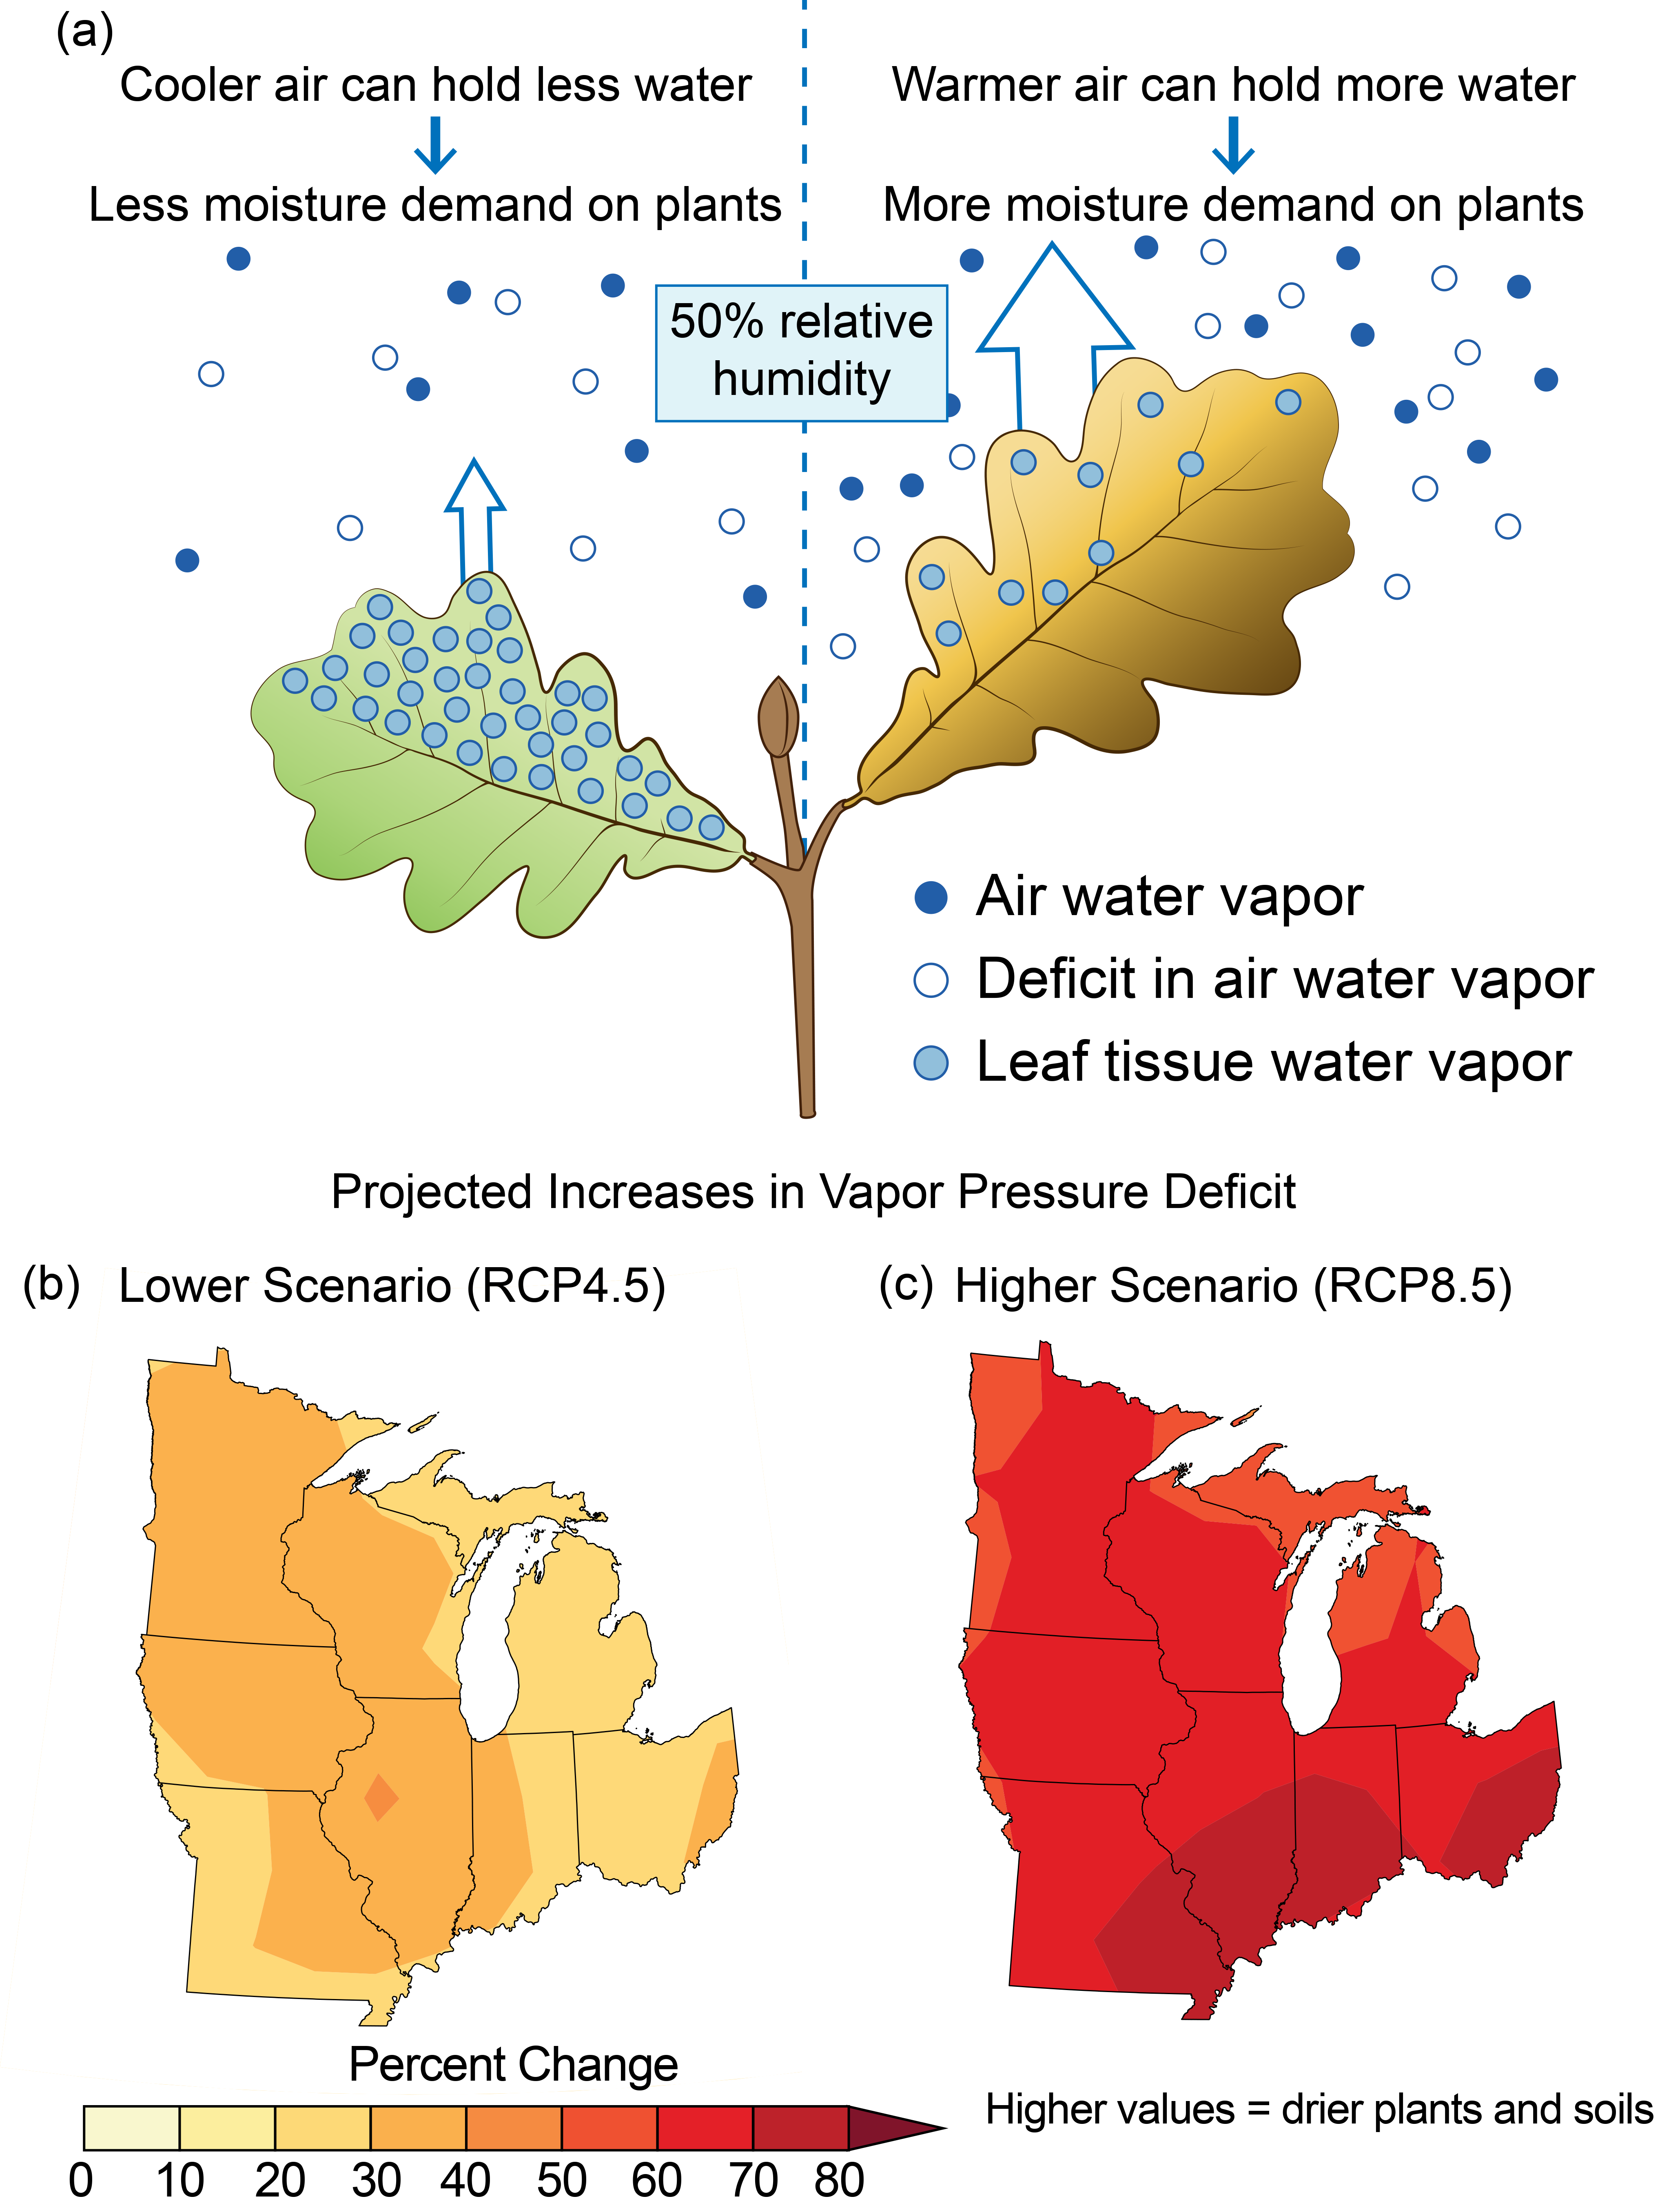
According to Easterling et al. (2017),193 evidence suggests that droughts have become less frequent in the Midwest as the region has become wetter. However, they note that “future higher temperatures will likely lead to greater frequencies and magnitudes of agricultural droughts throughout the continental United States as the resulting increases in evapotranspiration outpace projected precipitation increases.”
Major uncertainties
Global and regional climate models do not simulate well the dynamical structure of mesoscale convective systems in the Midwest, which are the critical “end processes” that create intense precipitation from increasing amounts of moisture evaporated over the Gulf of Mexico and transported by low-level jets (LLJs) into the Midwest. Secondly, the strengthening of future LLJs depends on strengthening of both the Bermuda surface high pressure and the lee surface low over the eastern Rocky Mountains. Confirming simulations of this in future climates are needed. Global and regional climate models do simulate future scenarios having increasing temperatures for the region with high confidence (a necessary ingredient for increased humidity). There is uncertainty of the temperature thresholds for crops because, as pointed out by Schauberger et al. (2017),66 some negative impacts of higher temperatures can be overcome through increased water availability. Agricultural yield models, productivity models, and integrated assessment models each provide different ways of looking at agricultural futures, and each of these three types of models has high levels of uncertainty. However, all point to agriculture futures that fail to maintain upward historical trends.
Description of confidence and likelihood
There is very high confidence that increases in warm-season absolute humidity and precipitation very likely have eroded soils, created favorable conditions for pests and pathogens, and degraded quality of stored grain. There is medium confidence that projected increases in moisture, coupled with rising mid-summer temperatures, likely will be detrimental to crop and livestock production and put future gains in commodity grain production at risk by mid-century. Projected changes in precipitation, coupled with rising extreme temperatures, provide medium confidence that by mid-century Midwest agricultural productivity likely will decline to levels of the 1980s without major technological advances.
Key Message 2: Forestry
Midwest forests provide numerous economic and ecological benefits, yet threats from a changing climate are interacting with existing stressors such as invasive species and pests to increase tree mortality and reduce forest productivity (likely, high confidence). Without adaptive actions, these interactions will result in the loss of economically and culturally important tree species such as paper birch and black ash (very likely, very high confidence) and are expected to lead to the conversion of some forests to other forest types (likely, high confidence) or even to non-forested ecosystems by the end of the century (as likely as not, medium confidence). Land managers are beginning to manage risk in forests by increasing diversity and selecting for tree species adapted to a range of projected conditions.
Description of evidence base
Multiple ecosystem vulnerability assessments that have been conducted for major forested ecoregions within the Midwest89,90,91,92,93 suggest that climate change is expected to have significant direct impacts to forests through effects of warming and changes in the timing and amounts of precipitation.96,98,103,104
Significant indirect impacts to forests are expected as warming increases the negative effects of invasive plants, insect pests, and tree pathogens of forests.105,106 Increasing stress on individual trees from climate changes (warming temperatures, drought, and frost damage) increases the susceptibility of trees to the impacts from invasive plants, insect pests, and disease agents.109,111
Direct and indirect impacts of climate change may lead to the decline of culturally88,127 and economically important tree species,125 as well as leading to shifts in major forest types and altered forest composition as tree species at the northern limits of their ranges decline and southern species experience increasing suitable habitat.120 These shifts raise the possibility of future losses of economic and cultural benefits of forests due to conversion to different forest types or the change to non-forest ecosystems.119,123,124
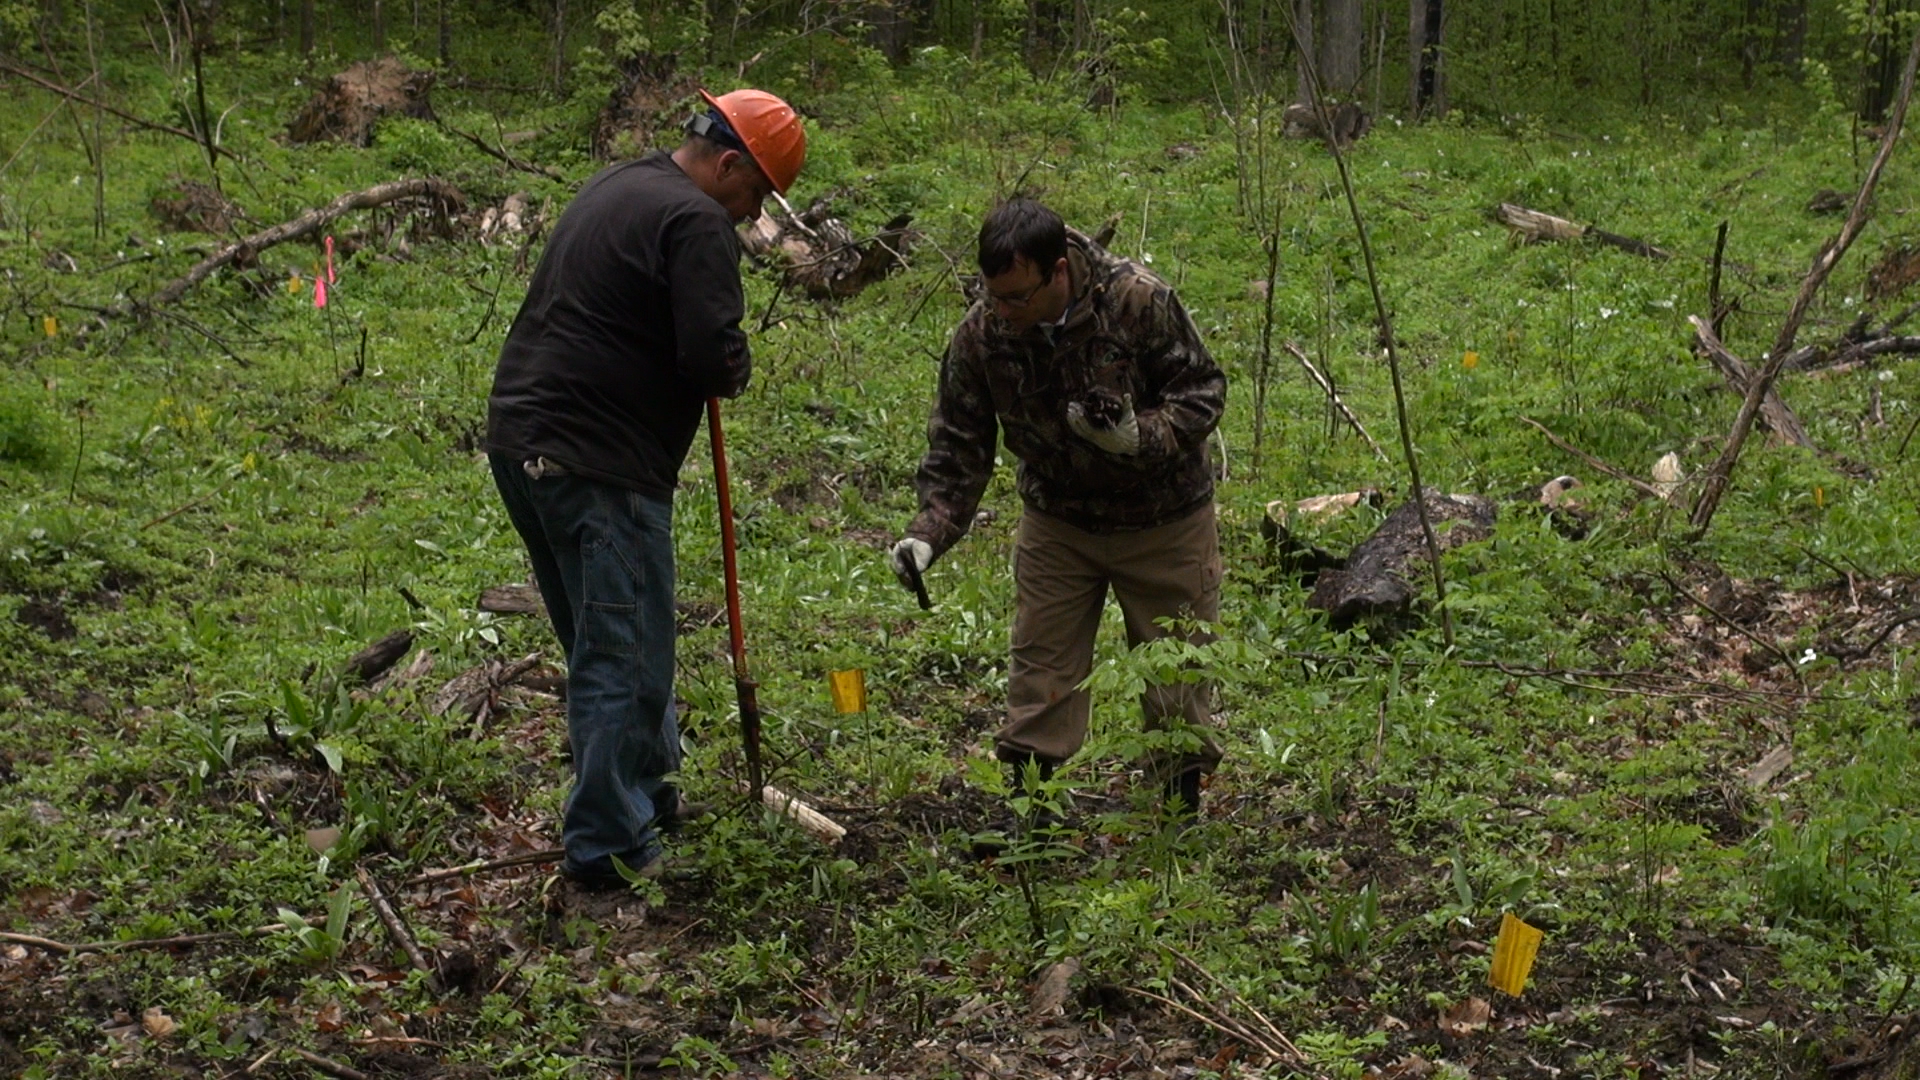
Many examples of land managers implementing climate adaptation in forest management exist, suggesting significant willingness to address the impacts of a changing climate across diverse land ownerships in managed forests134 and urban forests.133 Forest management strategies to adapt to a changing climate highlight the importance of increasing forest diversity and managing for tree species adapted to a range of climate conditions.8 The importance of Traditional Ecological Knowledge for informing approaches for climate adaptation on tribal lands and within ceded territory is recognized.331
Major uncertainties
There is significant uncertainty surrounding the ability of tree species migration rates to keep pace with changes in climate (based on temperature and precipitation) due to existing forest fragmentation and loss of habitat. Uncertainty in forest management responses, including active and widespread adaptation efforts that alter forest composition, add to the uncertainty of tree species movements. This leads to considerable uncertainty in the extent to which shifts in tree species ranges may lead to altered forest composition or loss of forest ecosystems in the future.
Due to the complex interactions among species, there is uncertainty in the extent that longer growing seasons, warming temperatures, and increased CO2 concentrations will benefit tree species, due to both limitations in available water and nutrients, as well as limited benefits for trees relative to the positive influences of these changes on stressors (invasives, insect pests, pathogens).
Description of confidence and likelihood
There is high confidence that the interactions of warming temperatures, precipitation changes, and drought with insect pests, invasive plants, and tree pathogens will likely lead to increased tree mortality of some species, reducing productivity of some forests. There is very high confidence that these interactions will very likely result in the decline of some economically or culturally important tree species. Additionally, there is high confidence that suitable habitat conditions for tree species will change as temperatures increase and precipitation patterns change, making it likely that forest composition will be altered and forest ecosystems may shift to new forest types. Due to uncertainties on species migration rates and forest management responses to climate changes, there is medium confidence that by the end of the century, some forest ecosystems are as likely as not to convert to non-forest ecosystems.
Key Message 3: Biodiversity and Ecosystems
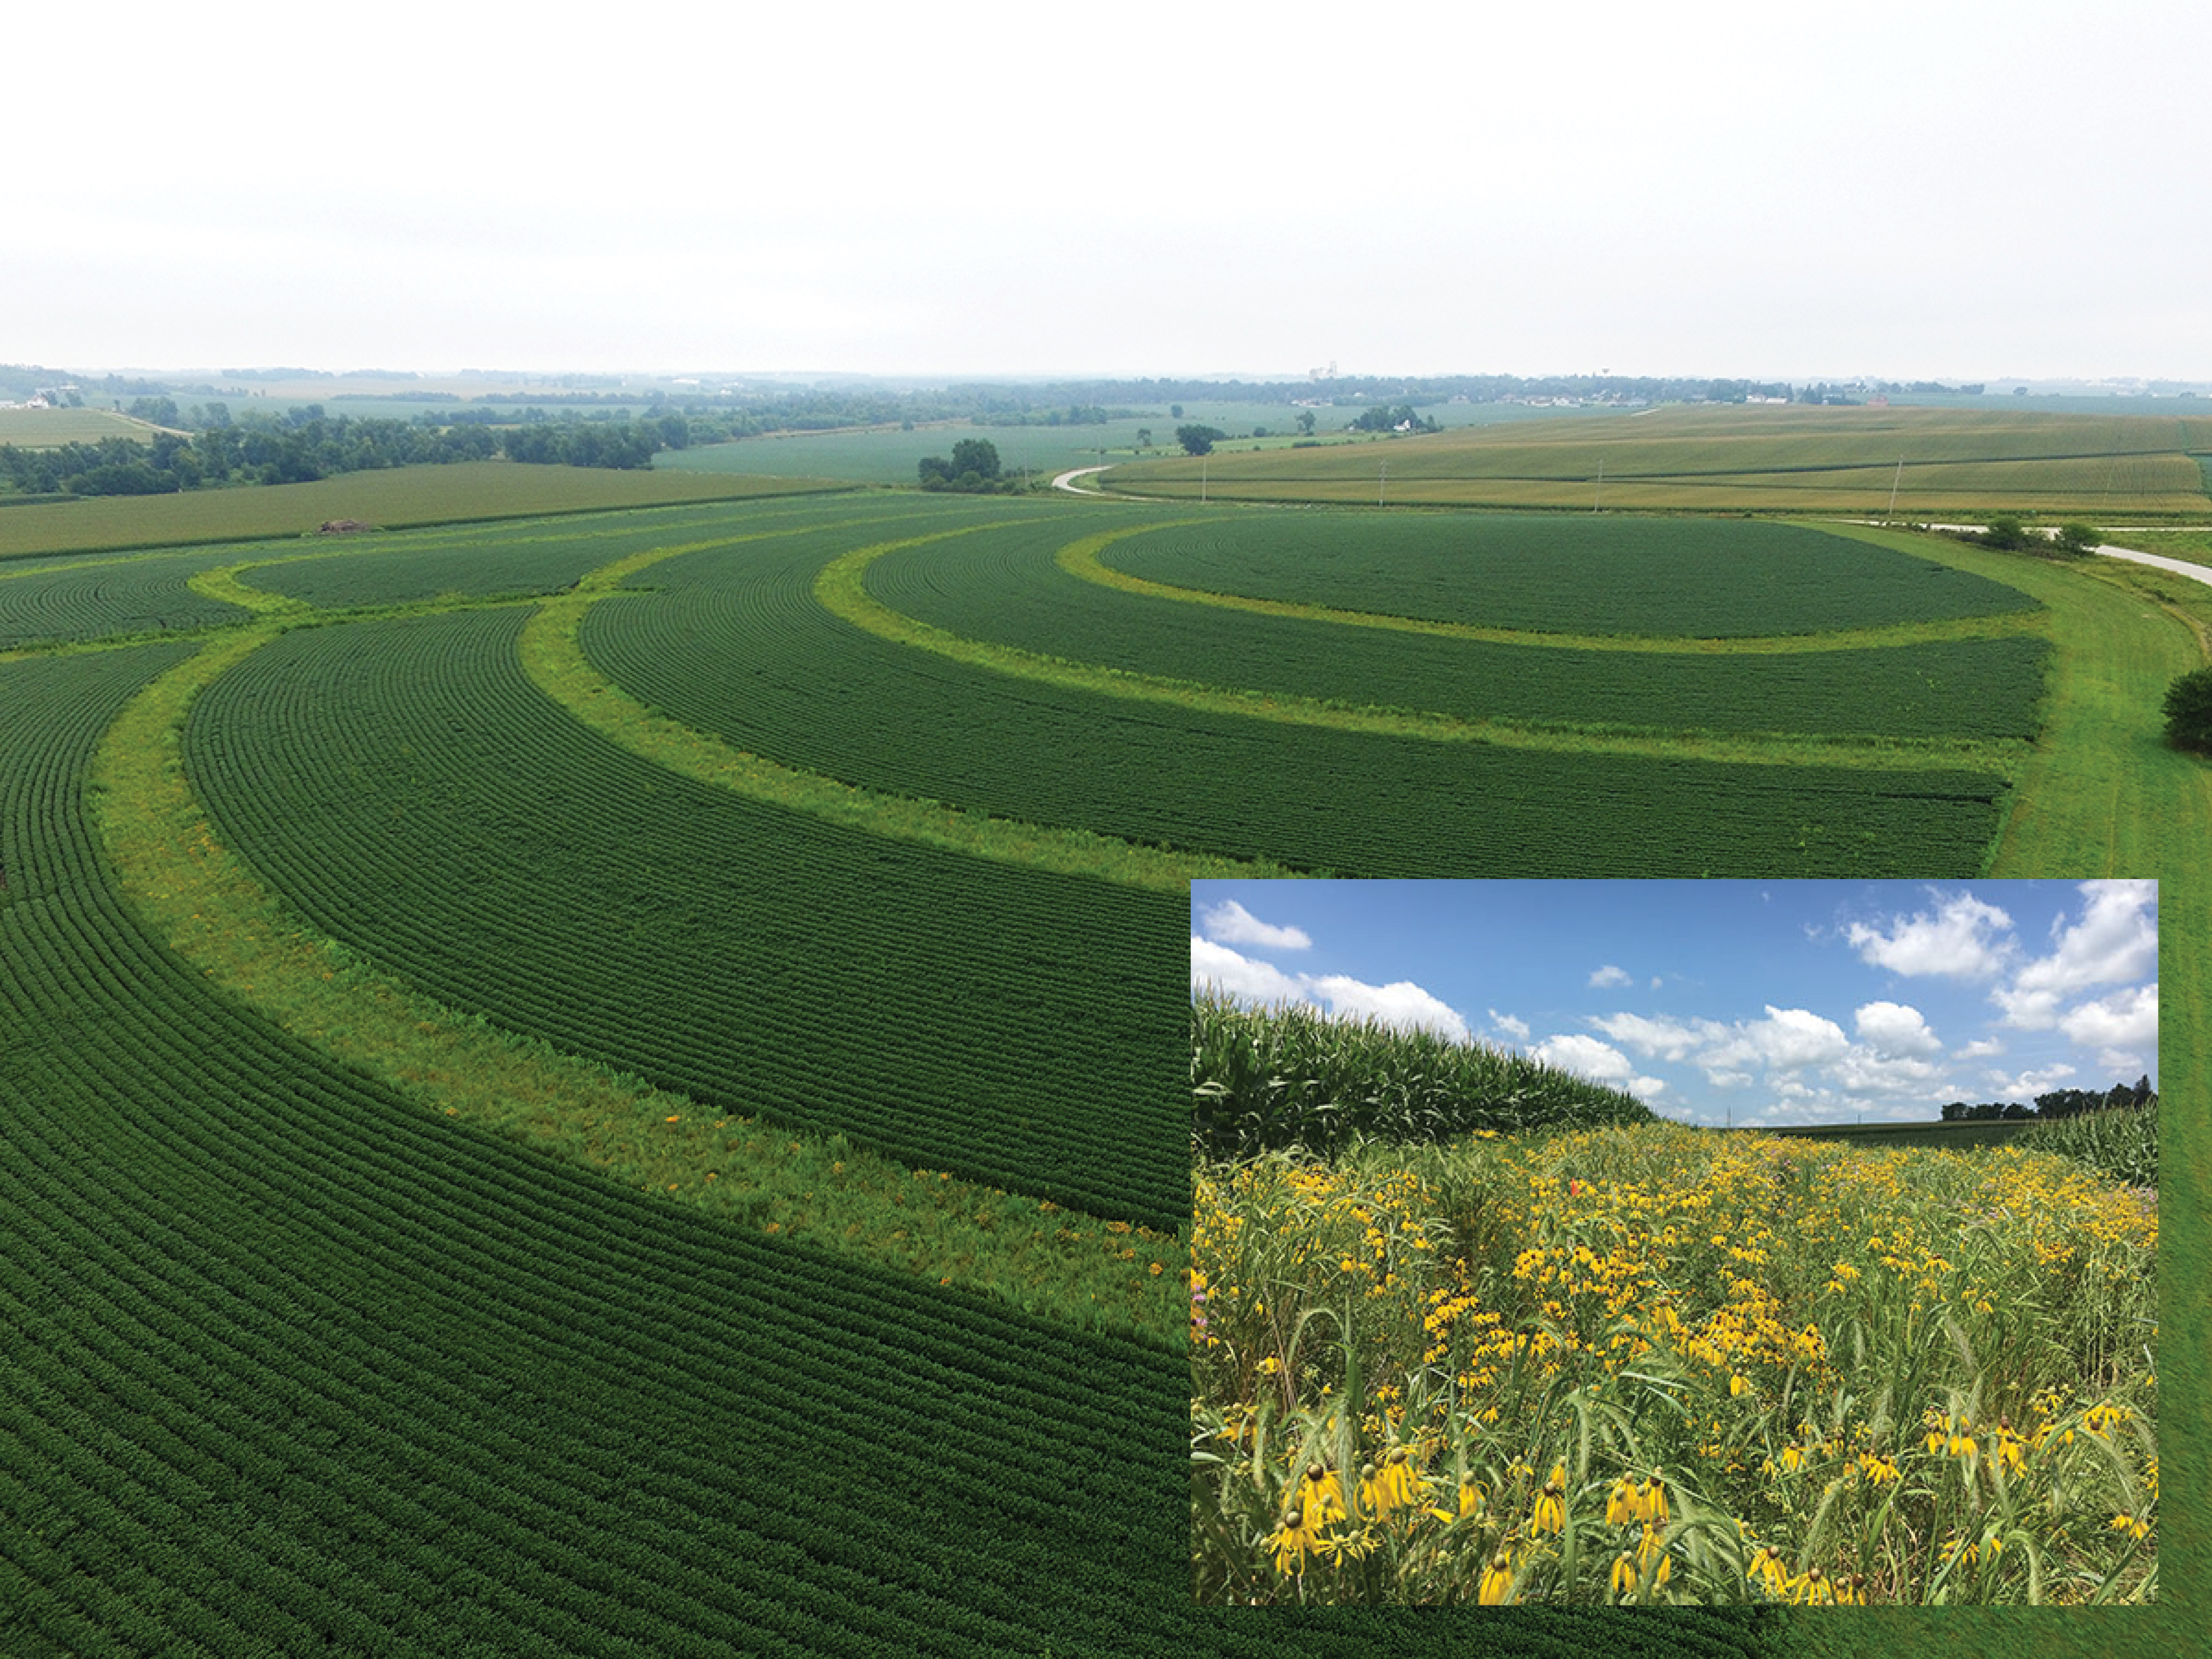
The ecosystems of the Midwest support a diverse array of native species and provide people with essential services such as water purification, flood control, resource provision, crop pollination, and recreational opportunities. Species and ecosystems, including the important freshwater resources of the Great Lakes, are typically most at risk when climate stressors, like temperature increases, interact with land-use change, habitat loss, pollution, nutrient inputs, and nonnative invasive species (very likely, very high confidence). Restoration of natural systems, increases in the use of green infrastructure, and targeted conservation efforts, especially of wetland systems, can help protect people and nature from climate change impacts (likely, high confidence).
Description of evidence base
Changes in climate will very likely stress many species and ecological systems in the Midwest. As a result of increases in climate stressors, which typically interact with multiple other stressors, especially in the southern half of the Midwest region, both the ecological systems and the ecological services (water purification, pollination of crops and wild species, recreational opportunities, etc.) they provide to people are at risk. We draw from a wide range of national and global scale assessments of risks to biodiversity (e.g., Maclean and Wilson 2011, Pearson et al. 2014, and the review by Staudinger et al. 2013 that covered literature included in the Third National Climate Assessment20,18,22), which all agree that on the whole, we are highly likely to see increases in species declines and extinctions as a result of climate change. It is very challenging to say specifically what combination of factors will drive these responses, but the weight of evidence suggests very high confidence in the overall trends. The link to interactions with other stressors is also very strong and is described in Brook et al. (2008)157 and Cahill et al. (2013),17 among others. Terrestrial ecosystem connectivity, thought to be important for the adaptive capacity of many species, is very low in the southern half of the Midwest region.158,159 This may limit the movement of species to more suitable habitats or for species from the southern United States to migrate into the Midwest. These connectivity/movement potential studies also support the idea that land-use change will constrain the potential for retaining function and overall diversity levels. The last section refers to the benefits of restoration as a mechanism for protecting people and nature from climate change impacts. While it is not possible to fully demonstrate that protection of people and nature is indeed occurring now from climate change impacts (we would need attribution of current floods, etc.), there is strong evidence that actions like restoring wetlands can reduce flooding impacts182 and that protecting forests protects water quality and supply.
Major uncertainties
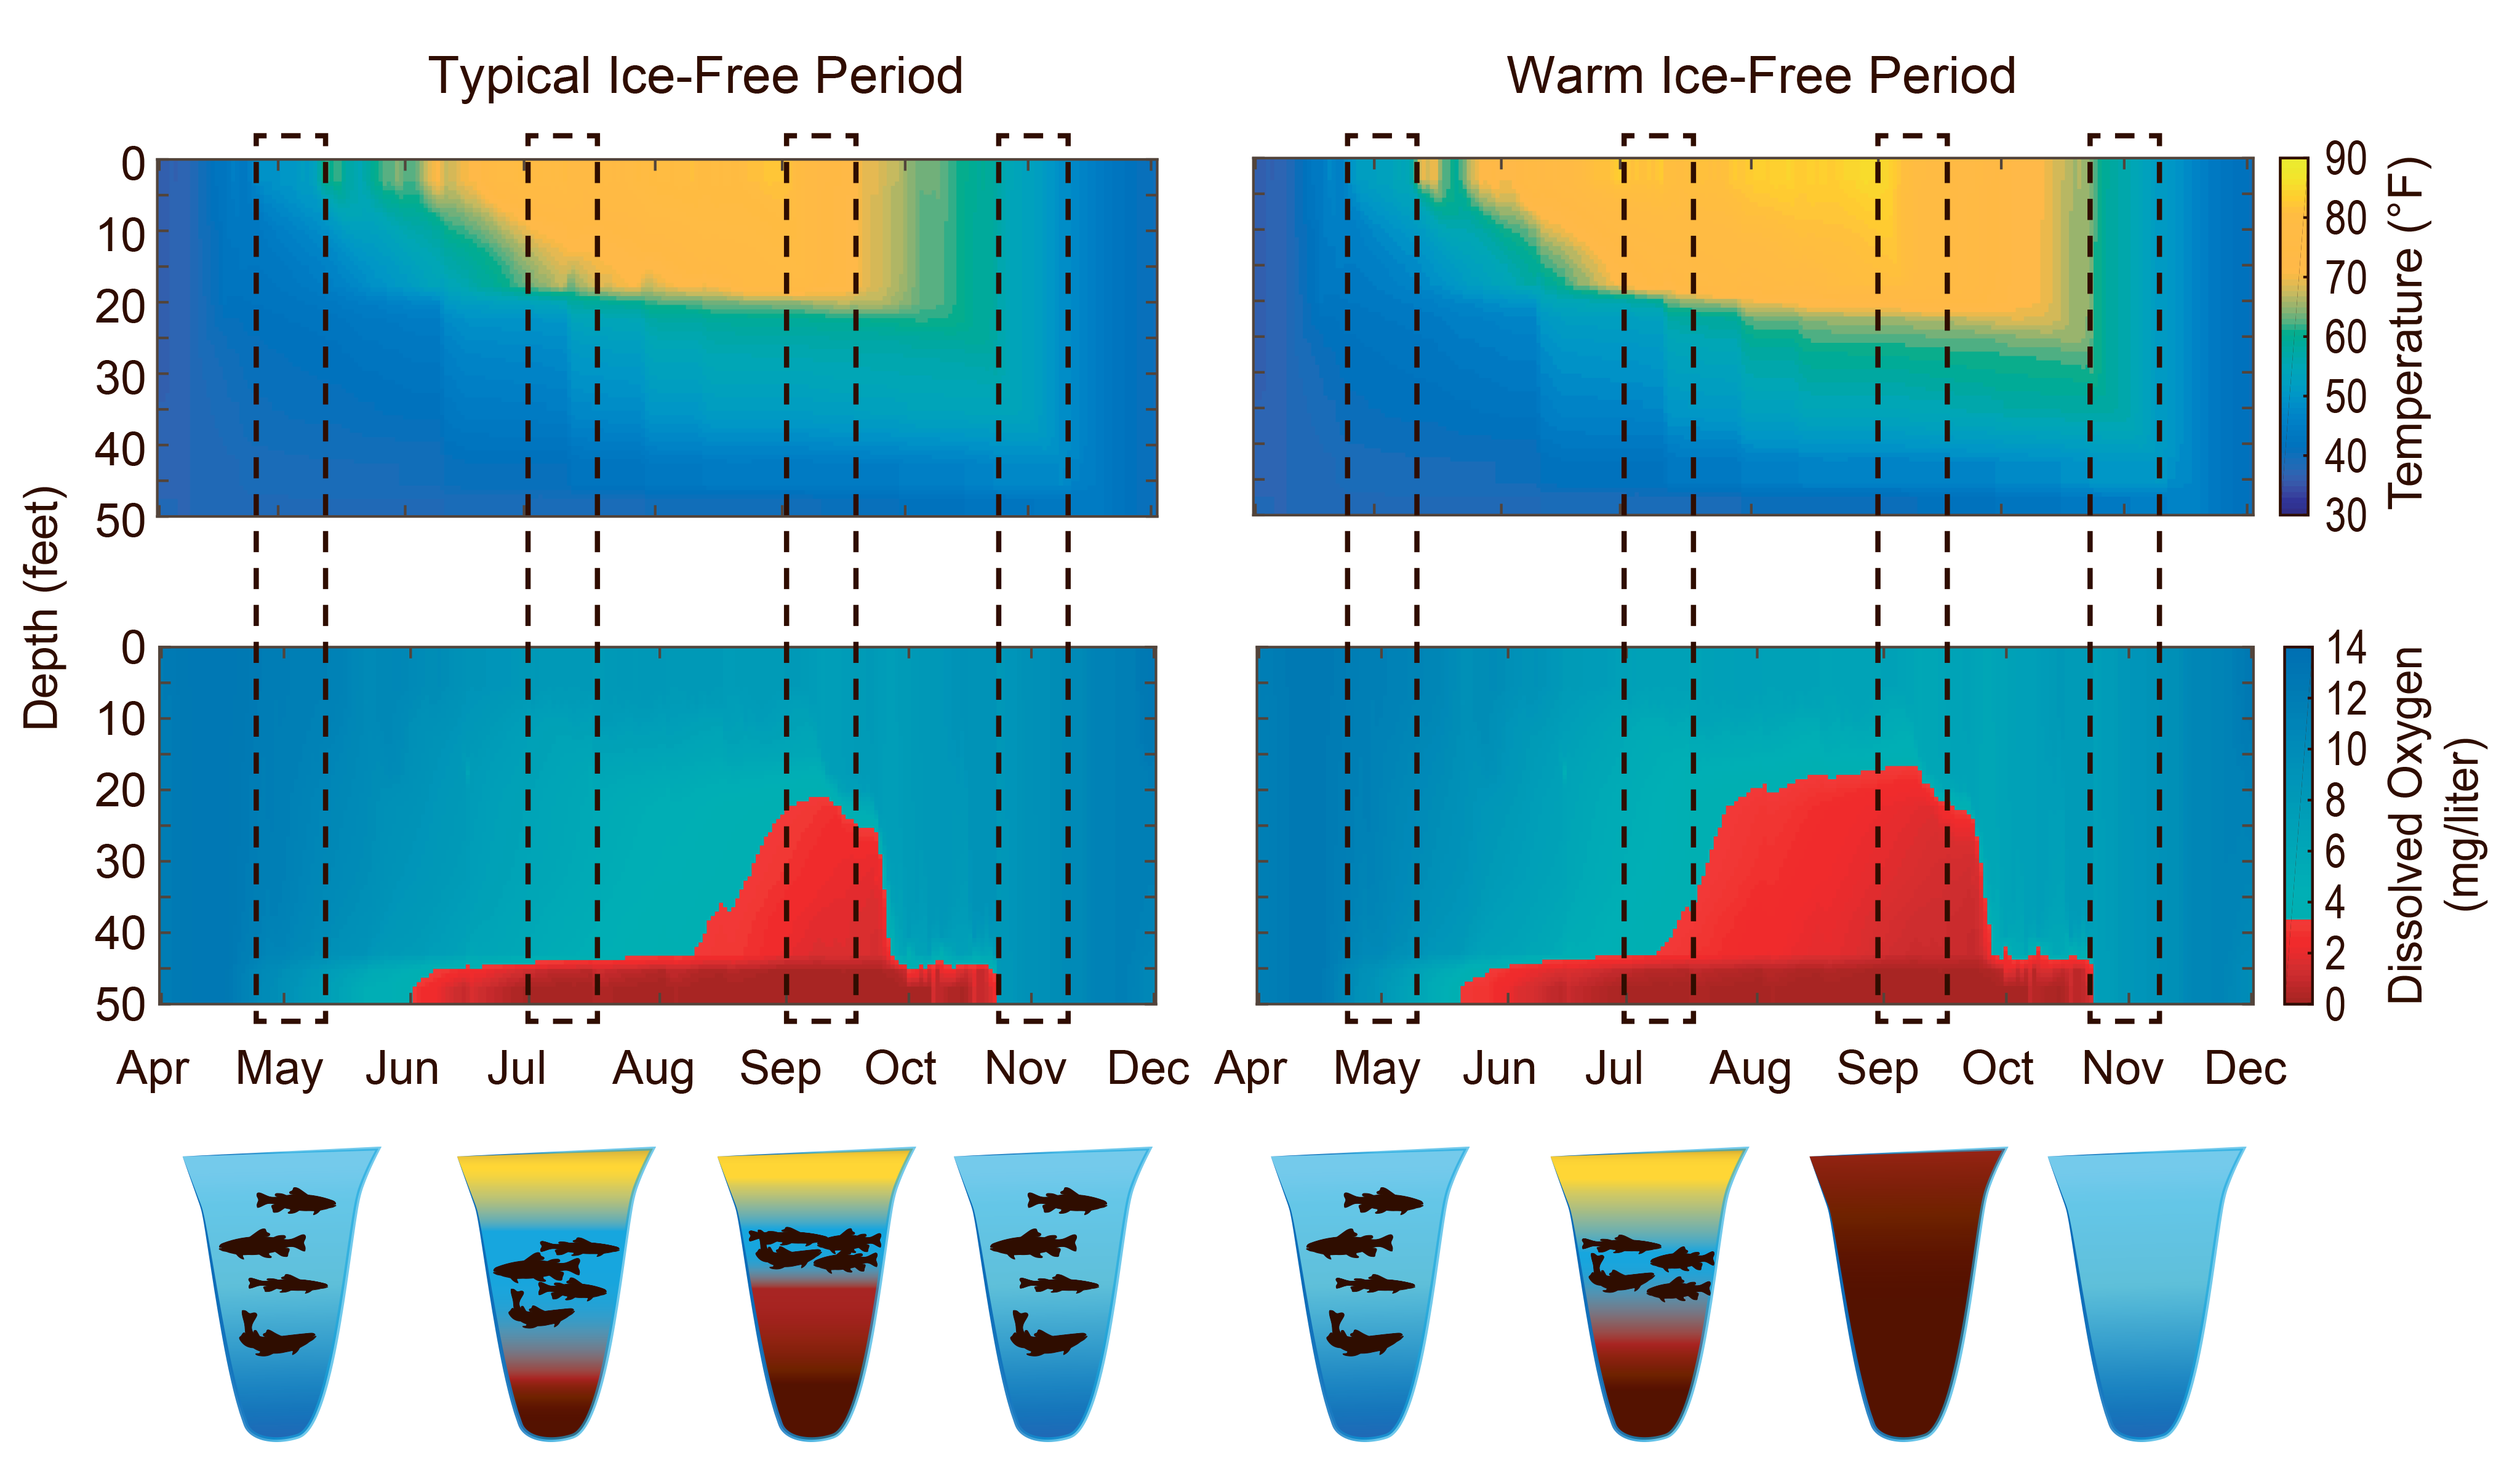
There is significant uncertainty surrounding the ability of species and ecosystems to persist and thrive under climate change, and we expect to see many different types of responses (population increases, declines, local and regional extinctions).17 In some cases, climate change does have the potential to benefit species; for example, fish in the coldest regions of the Great Lakes (i.e., Lake Superior) are likely to show increases in productivity, at least in the short run.332 However, as a whole, given the environmental context upon which climate change is operating, and the presence of many cold-adapted species that are close to the southern edge of their distributional range, we expect more declines than increases.
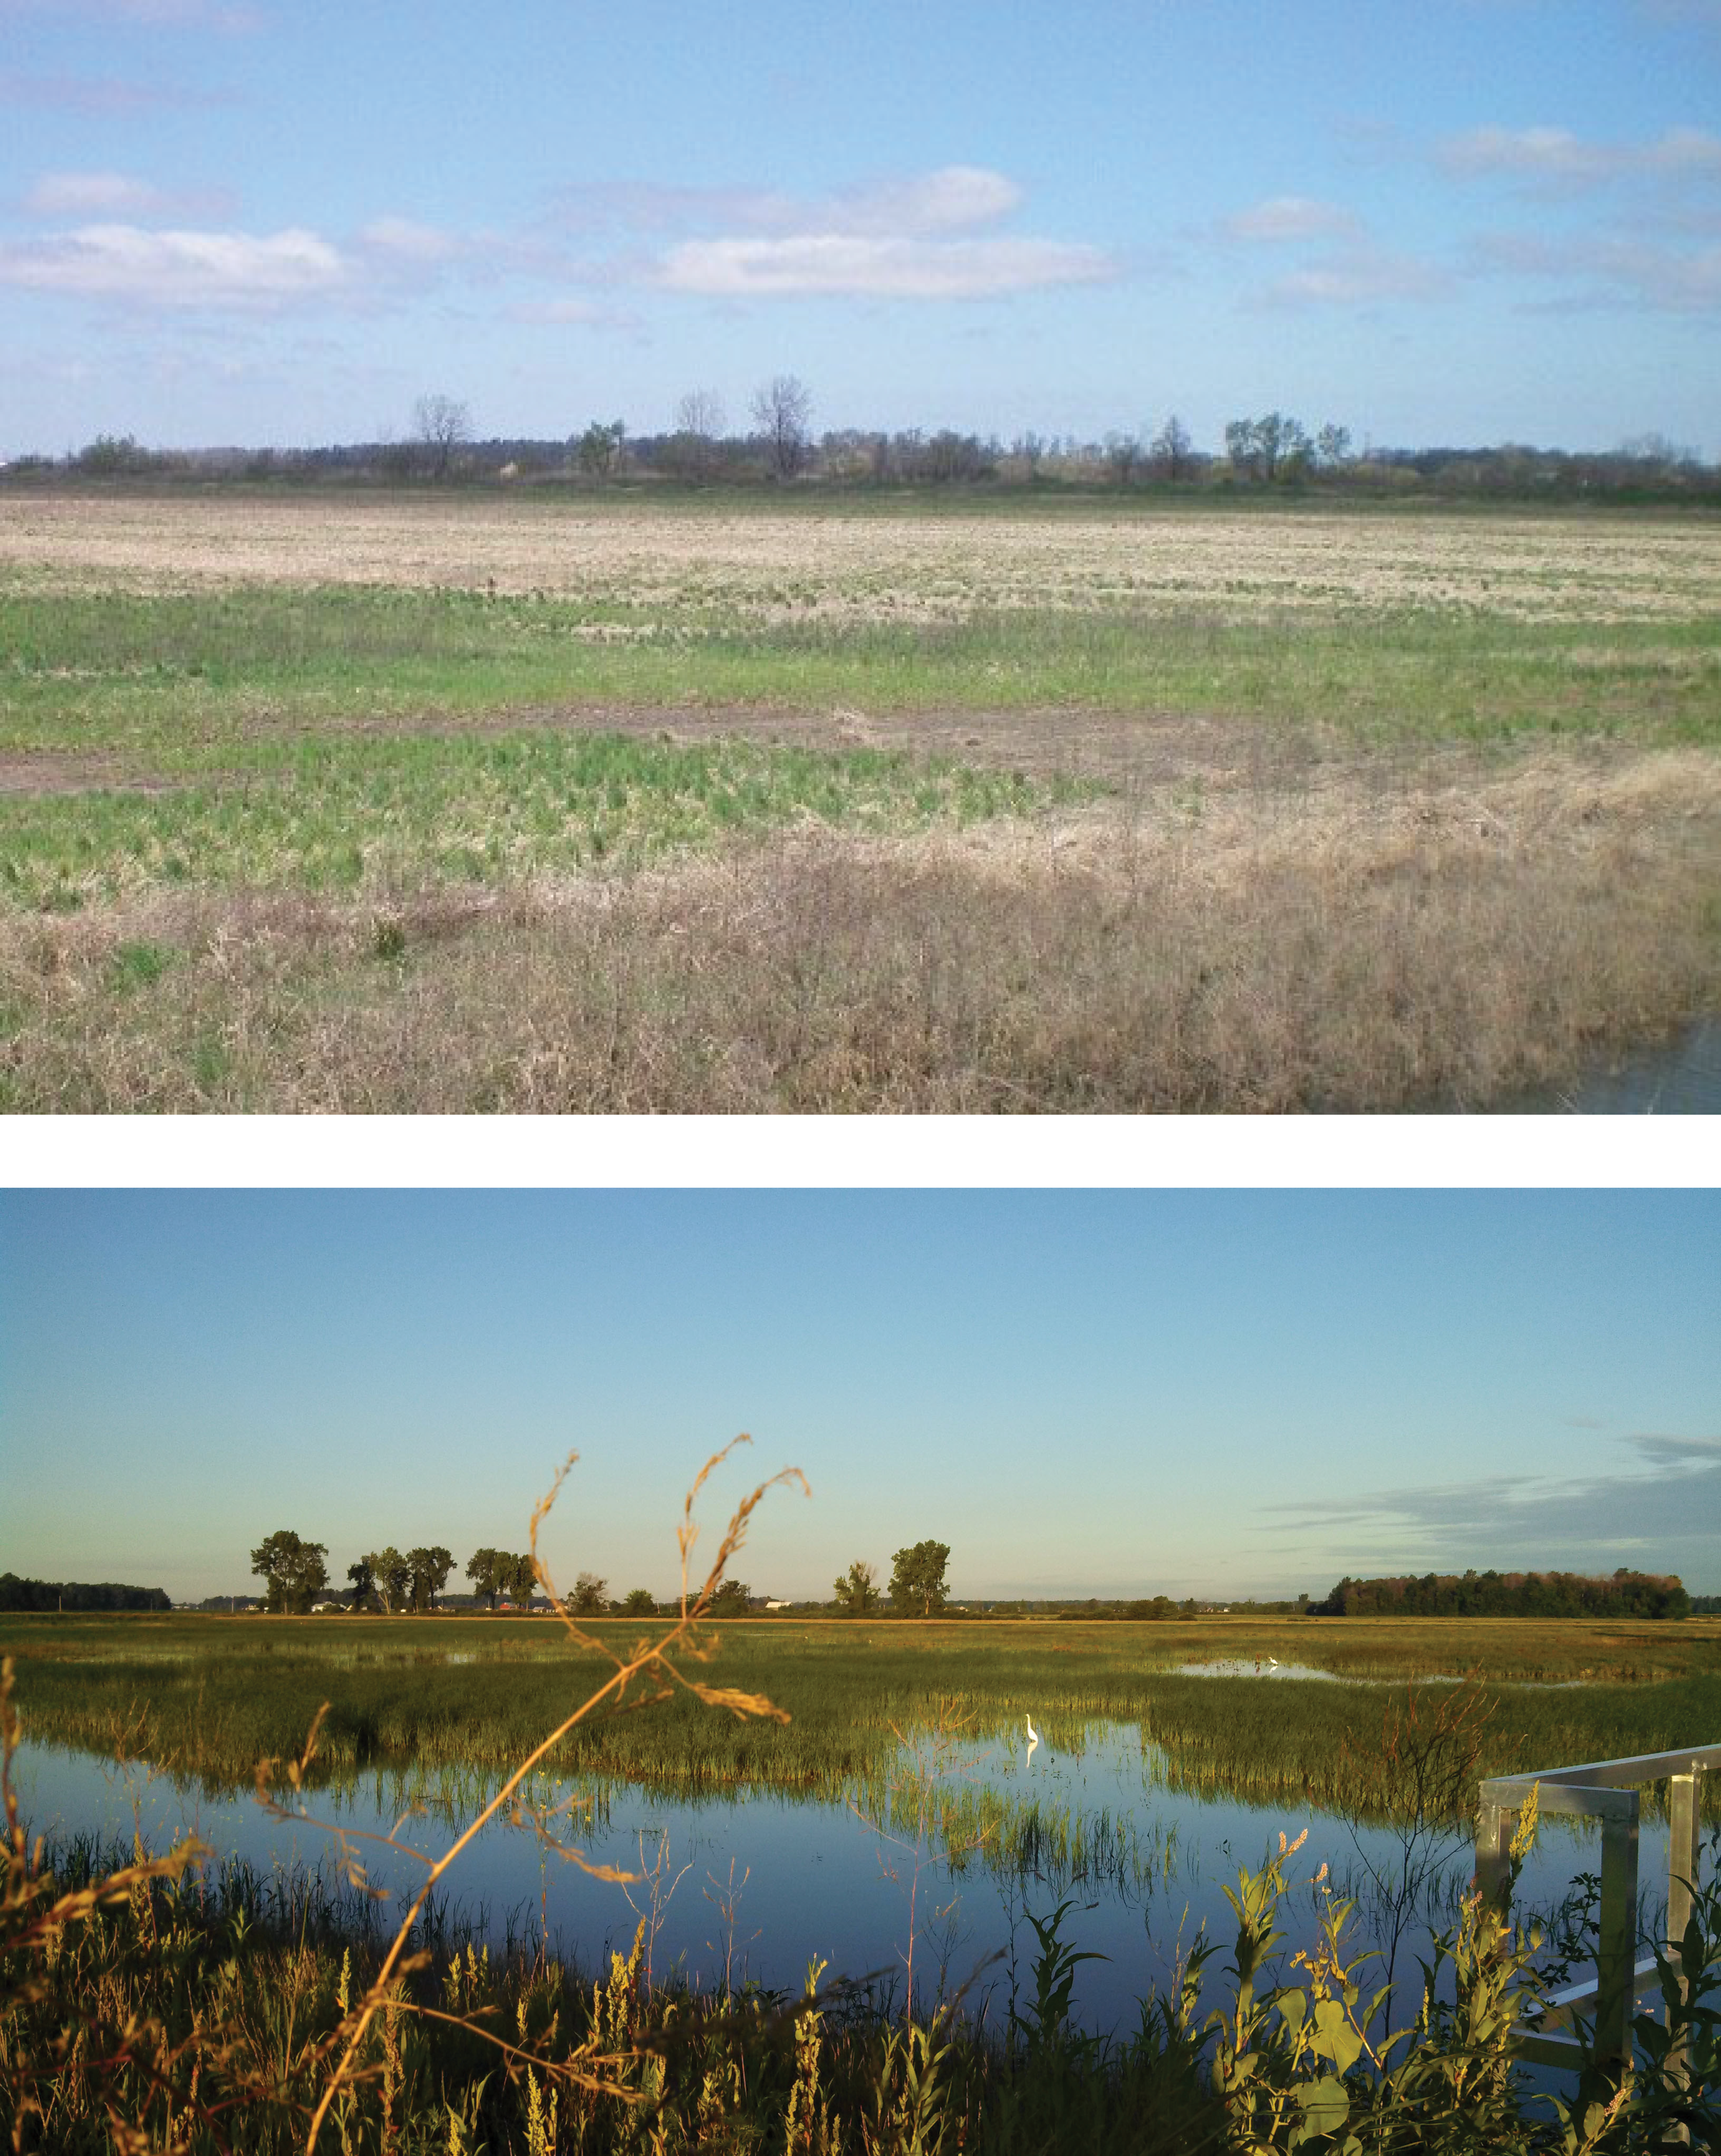
The last section of the Key Message focuses on land protection and restoration—conservation strategies intended to reduce the impacts of land-use change. Many modeling studies have called out loss of habitat in the Midwest as a key barrier to both local survival and species movement in response to climate change (Schloss et al. 2012 and Carroll et al. 2015 are two of the most recent158,158). Restoring habitat can restore connectivity and protect key ecological functions like pollination services and water purification. Restoring wetlands also can help protect ecosystems and people from flooding, which is the rationale for the last line in the Key Message.
Description of confidence and likelihood
In the Midwest, we already have seen very high levels of habitat loss and conversion, especially in grasslands, wetlands, and freshwater systems. This habitat degradation, in addition to the pervasive impacts of invasive species, pollution, water extraction, and lack of connectivity, all suggest that the adaptive capacity of species and systems is compromised relative to systems that are more intact and under less stress. Over time, this pervasive habitat loss and degradation has contributed to population declines, especially for wetland, prairie, and stream species. A reliance on cold surface-water systems, which often have compromised connectivity (due to dams, road-stream crossings with structures that impede stream flow, and other barriers) suggests that freshwater species, especially less mobile species like mussels, which are already rare, are at particular risk of declines and extinction. Due to the variety of life histories and climate sensitivities of species within the region, it is very challenging to specify what mechanisms will be most important in terms of driving change. However, knowing that drivers like invasive species, habitat loss, pollution, and hydrologic modifications promote species declines, it is very likely that the effects of climate change will interact, and we have very high confidence that these interactions will tend to increase, rather than decrease, stresses on species that are associated with these threats. While there is strong evidence that investments in restoring habitat can benefit species, we currently do not have strong observational evidence of the use of these new habitats, or benefits of restored wetlands, in response to isolated climate drivers. Thus, the confidence level for this statement is lower than for the first half of the message.
Key Message 4: Human Health
Climate change is expected to worsen existing conditions and introduce new health threats by increasing the frequency and intensity of poor air quality days, extreme high temperature events, and heavy rainfalls; extending pollen seasons; and modifying the distribution of disease-carrying pests and insects (very likely, very high confidence). By mid-century, the region is projected to experience substantial, yet avoidable, loss of life, worsened health conditions, and economic impacts estimated in the billions of dollars as a result of these changes (likely, high confidence). Improved basic health services and increased public health measures—including surveillance and monitoring—can prevent or reduce these impacts (likely, high confidence).
Description of evidence base
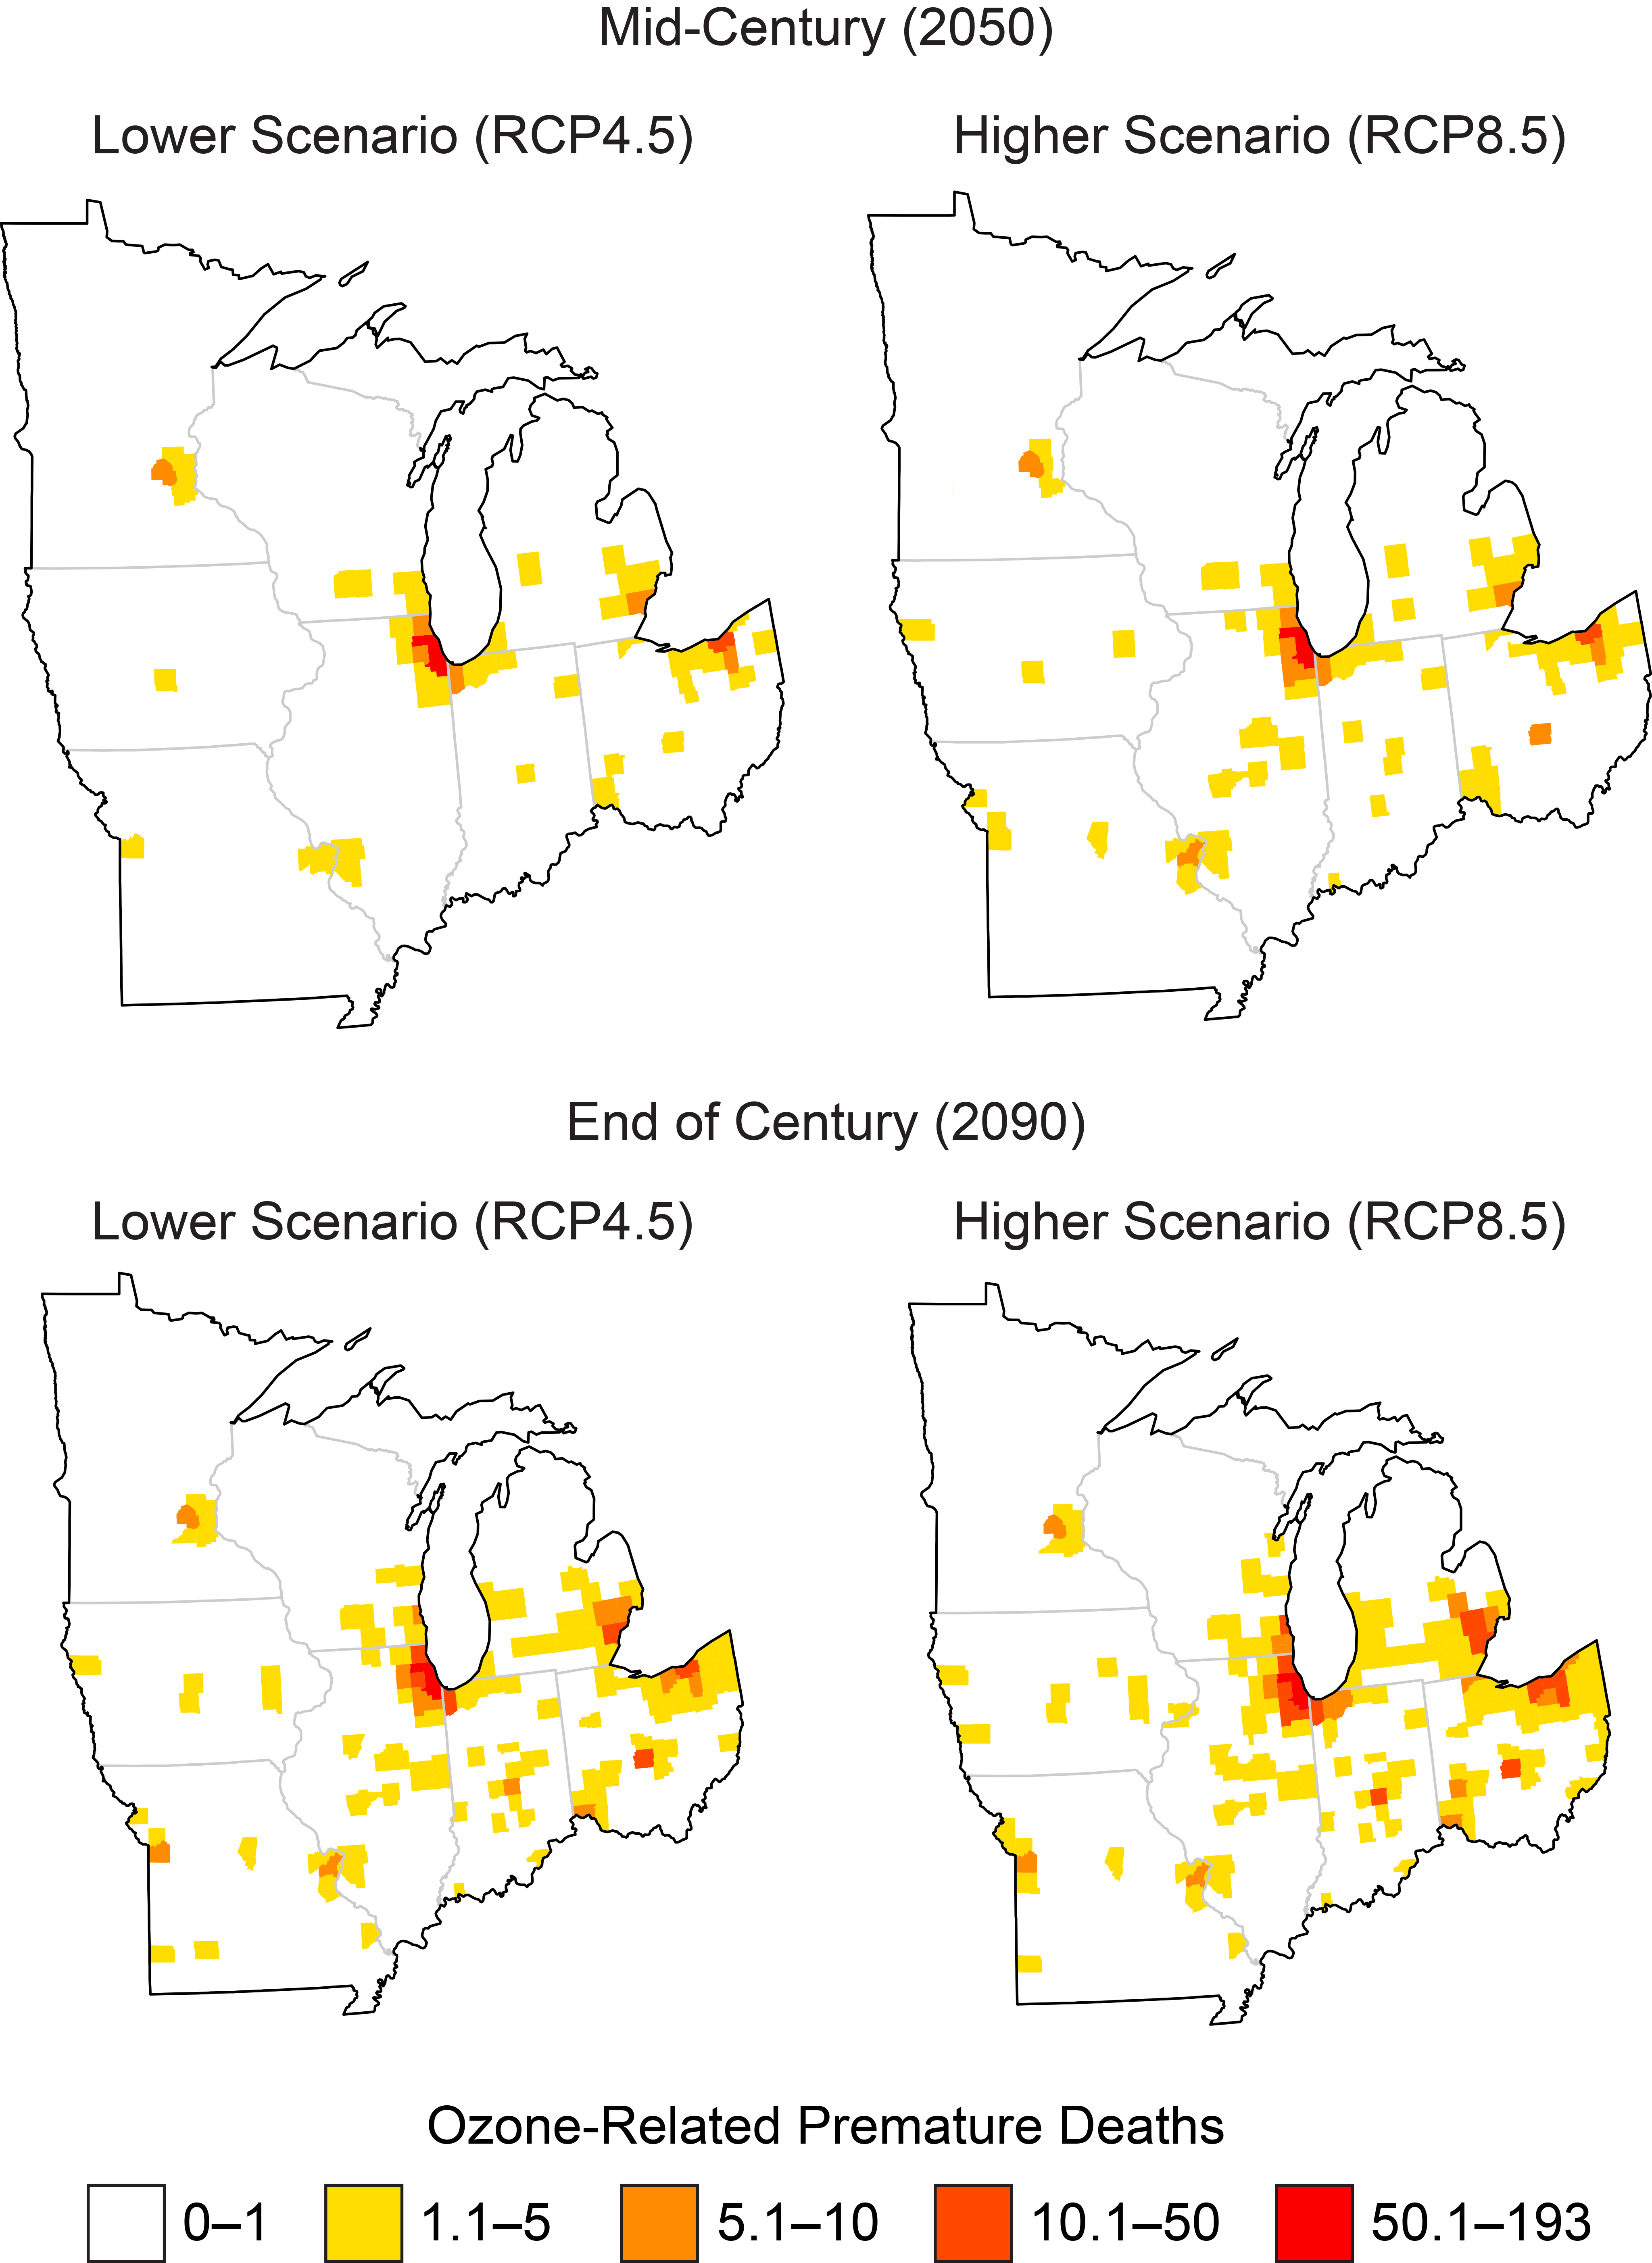
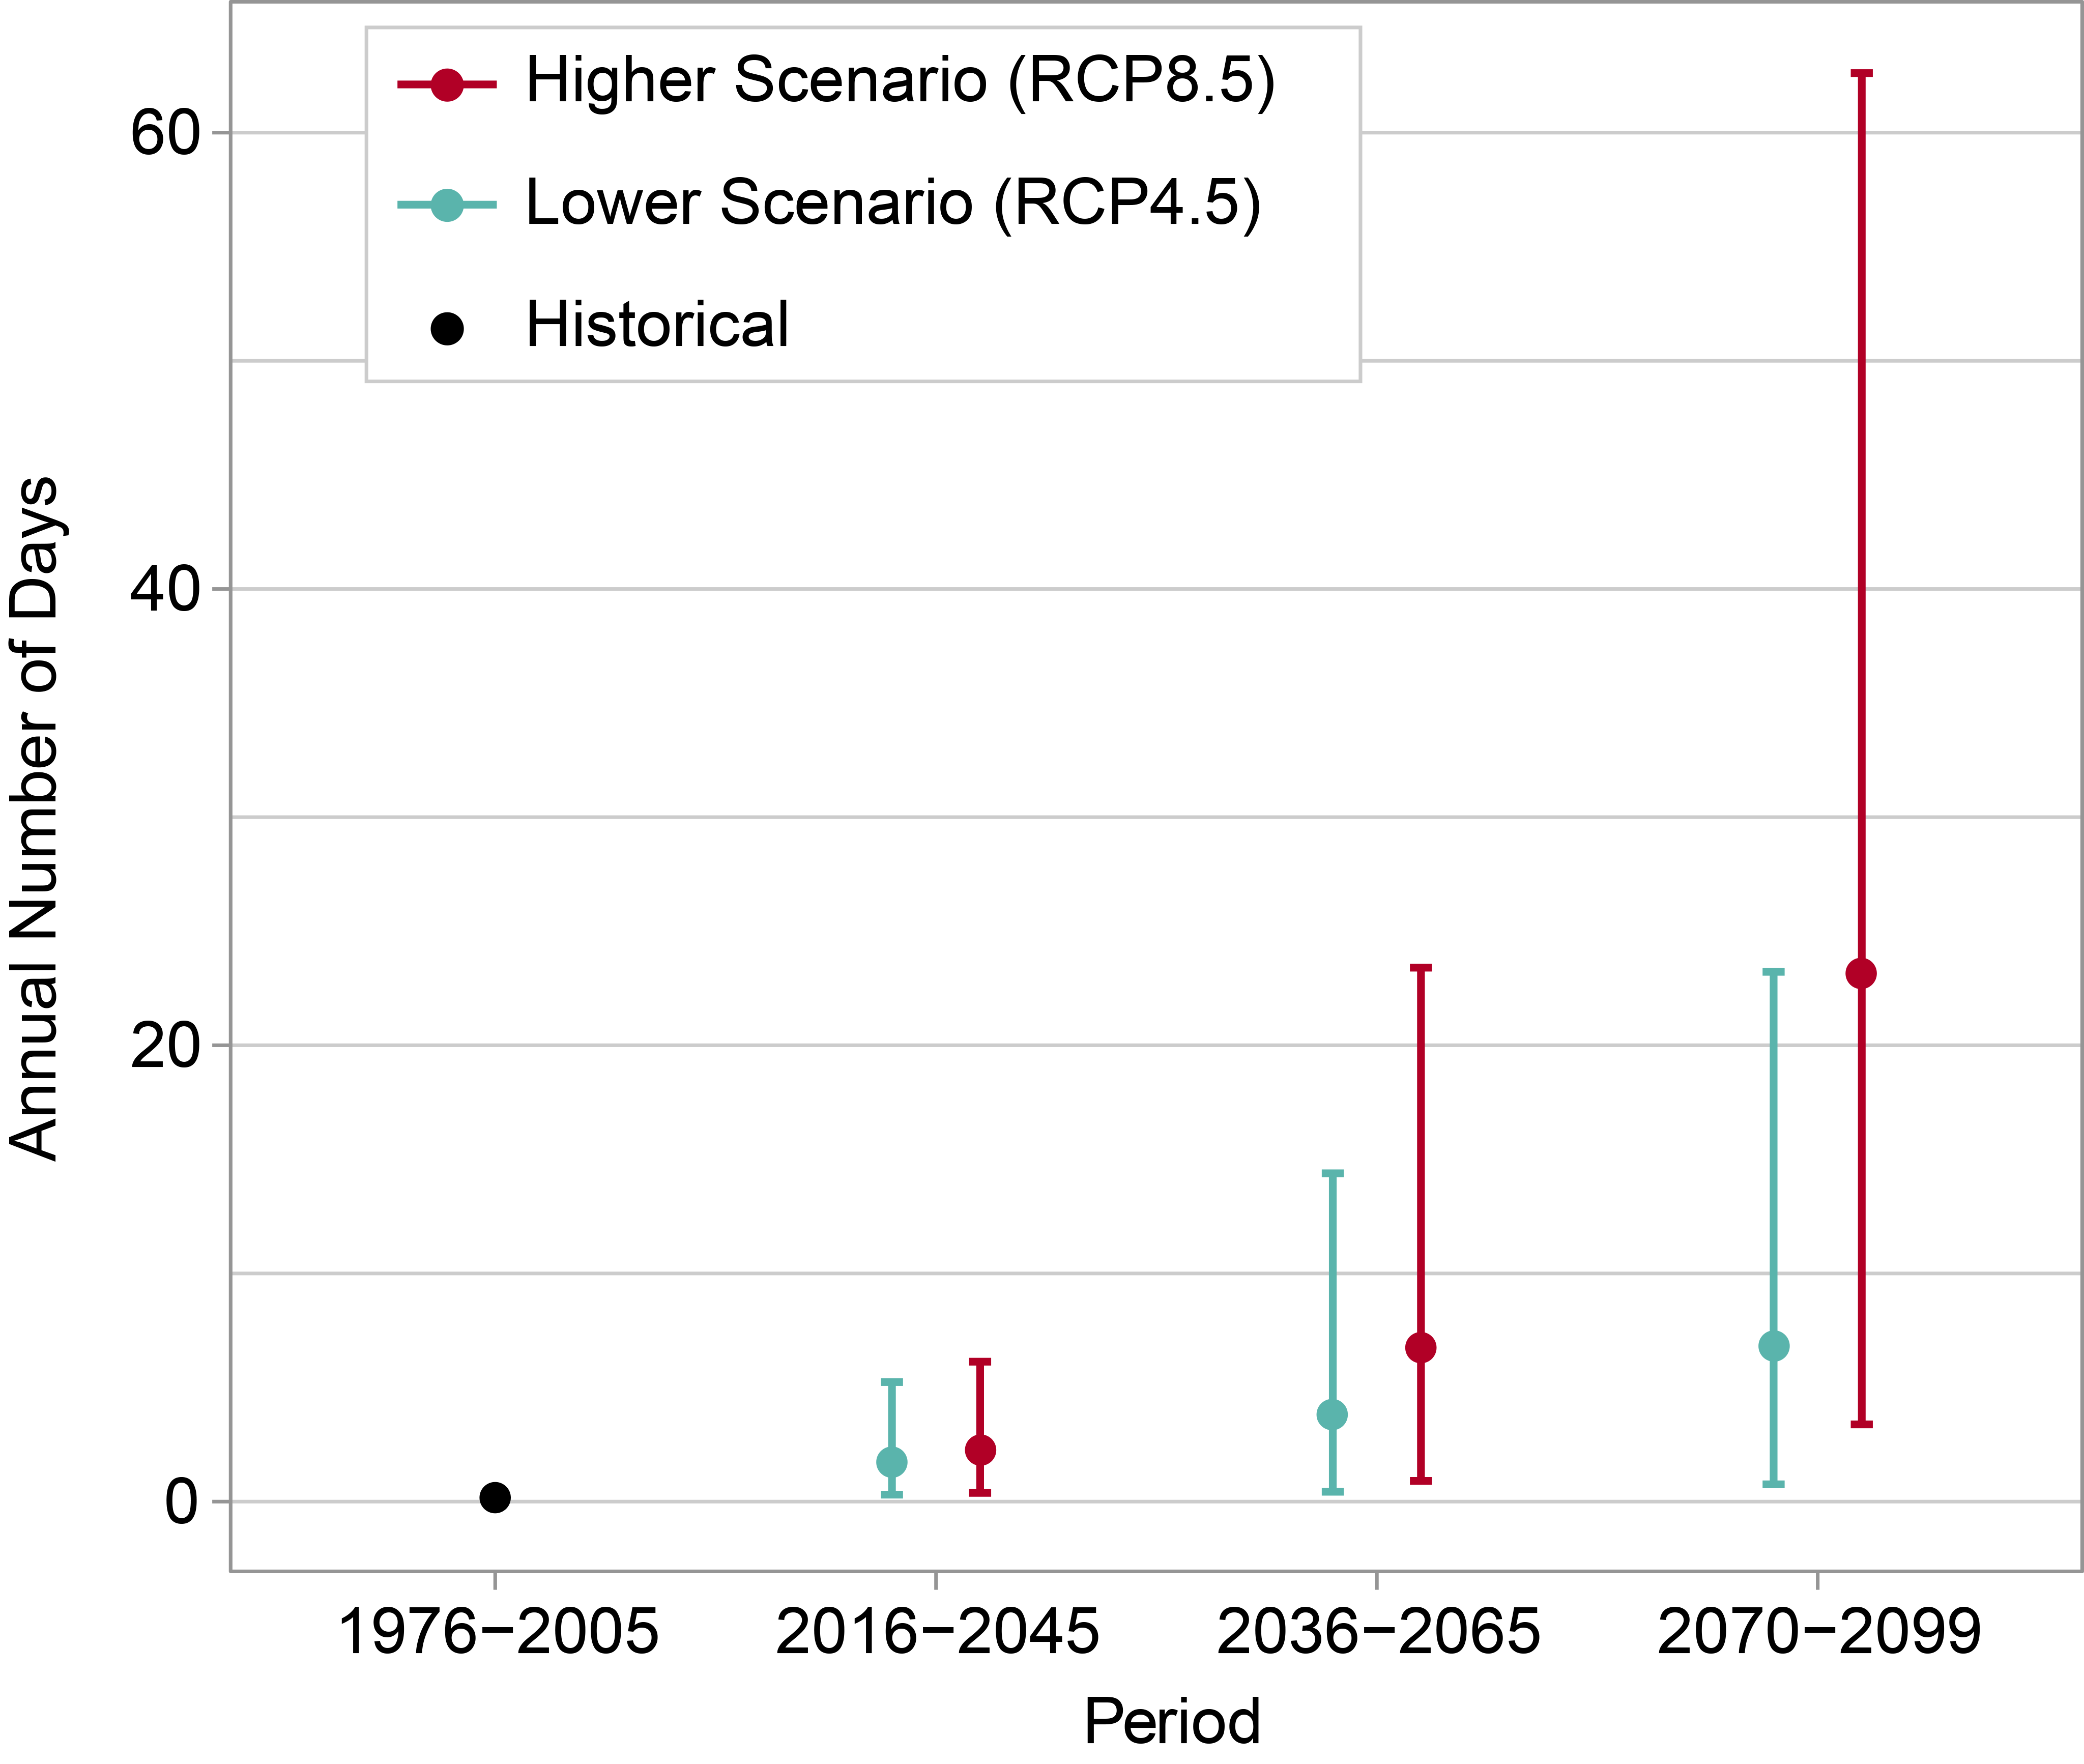
There is strong evidence that increasing temperatures and precipitation in the Midwest will occur by the middle and end of the 21st century.27 The impacts of these changes on human health are broadly captured in the 2016 U.S. Global Change Research Program’s Climate and Health Assessment.26 Air quality, including particulate matter and ground-level ozone, is positively associated with increased temperatures and has been well-documented to show deleterious impacts on morbidity and mortality.231 Likewise, increased temperatures have been shown in communities in the Midwest, as well as across the United States, to have substantial impacts on health and well-being.232,233,235,236,333,334 The frequency of extreme rainfall events in the Midwest has increased in recent decades, and this trend is projected to continue.193 Studies have shown that extreme rainfall events lead to disease, injury, and death.237 Increases in seasonal temperatures and shifting precipitation patterns have been well documented to be correlated with increased pollen production, allergenicity, and pollen season length.230,231 Similarly, there is agreement that shifting temperature and precipitation patterns are making habitats more suitable for disease-carrying vectors to move northward toward the Midwest region.242,243,250,335,336,337 The disease burden and economic projections primarily are based on EPA estimates.28
Access to basic preventive care measures quantifiably reduces disease burden for climate-sensitive exposures.238,240 Gray literature indicates that public health practitioners are dedicated to increasing capacity for adapting to climate change through classic public health activities such as conducting vulnerability assessments, employing communication and outreach campaigns, and investing in surveillance efforts.26,244,245,246,247,248
Major uncertainties
While the modeling performed by the EPA was completed using the best available information, there is uncertainty around the extent to which biophysical adaptations will protect midwestern populations from heat-, air pollution-, aeroallergen-, and vector-related illness and death. Likewise, while there is a general consensus regarding habitat suitability for disease-carrying vectors in the eastern and western United States, the degree to which the disease burden may increase or decrease is largely uncertain.
Description of confidence and likelihood
Based on the evidence, there is very high confidence that climate change is very likely to impact midwesterners’ health.
Key Message 5: Transportation and Infrastructure
Storm water management systems, transportation networks, and other critical infrastructure are already experiencing impacts from changing precipitation patterns and elevated flood risks (medium confidence). Green infrastructure is reducing some of the negative impacts by using plants and open space to absorb storm water (medium confidence). The annual cost of adapting urban storm water systems to more frequent and severe storms is projected to exceed $500 million for the Midwest by the end of the century (medium confidence).
Description of evidence base
The patterns of increased annual precipitation, and the size and frequency of heavy precipitation events in the Midwest, are shown in numerous studies and highlighted in Melillo et al. (2014)27 and Easterling et al. (2017).193 Increases in annual precipitation of 5% to 15% are reported across the Midwest region.193 In addition, both the frequency and the intensity of heavy precipitation events in the Midwest have increased since 1901.193
For the early 21st century (2016–2045), both lower and higher scenarios (RCP4.5 and RCP8.5) indicate that average annual precipitation could increase by 1% to 5% across the Midwest, suggesting that the observed increases are likely to continue. By mid-century (2036–2065), both scenarios (RCP4.5 and RCP8.5) indicate precipitation increases of 1% to 5% in Missouri and Iowa and 5% to 10% increases in states to the north and east. By late century (2070–2089), precipitation is expected to increase by 5% to 15% over present day, with slightly larger increases in the higher scenario (RCP8.5). Model simulations suggest that most of these increases will occur in winter and spring over the 21st century. Similar to annual precipitation, the amounts from the annual maximum one-day precipitation events (a measure of heavy precipitation events) are projected to increase over time in the Midwest. The size of the events could increase by 5% to 15% by late century.193
Gray literature documents that heavy rains in the Midwest are overwhelming storm water management systems, leading to property damage. Kenward et al. (2016)256 provide examples of rain-related sewage overflows in the Midwest. These include an overflow of 681 million gallons during heavy rains in April 2015 in Milwaukee and an overflow of over 100 million gallons from December 26–28, 2015, in St. Louis. Winters et al. (2015)37 document that failure of storm water management systems in heavy rain leads to property damage, including basement backups.
The disruption of transportation networks by heavy precipitation in the Midwest has been documented by collecting contemporary news reports and by compiling state government reports. Posey (2016)338 relates that four storms between April 2013 and April 2014 forced evacuations or damaged cars in St. Louis, Missouri. In the same period, there were 18 flood-related closures on Missouri roads, a figure that excludes closures on small local roads. Flooding in May 2017 led to the closure of more than 400 roads across Missouri, a figure that again excludes local roads. Closed roadways included multiple stretches of Interstate 44, as well as sections of I-55, affecting interstate traffic between St. Louis and Memphis.339 News reports document that the same stretch of I-44 was shut down during the floods of December 2015–January 2016.340
Flood-related disruptions to Midwest barge and rail traffic in 2013 were documented by several articles in Journal of Commerce, a shipping trade magazine.265,266 WorkBoat, a trade journal of the inland shipping industry, documents that Mississippi River navigation has been halted by flooding in 2013, 2015, 2016, and 2017. It also documents low river conditions affecting navigation in 2012 and 2015.267,268,269,270,341 Disruptions to rail service caused by the floods of 2017 were documented in news media accounts.342 Changon (2009)343 documents that flooding in 2008 resulted in extensive damage to railroads in Illinois and adjacent states, with costs exceeding $150 million due to direct damage and lost revenue.
Although there is ample documentation of transportation systems in the Midwest being disrupted by floods in recent years, there is a lack of long-term time series data on disruptions with which to determine whether these incidents are becoming more frequent. Development of long-term data on transportation disruptions in the Midwest is a research need. It is clear that flood frequency and severity on major rivers in the Midwest have increased in recent decades, although additional research is needed on the relative contributions of climate change and land-use change to increases in flood risk.344,345,346
The EPA estimated economic costs related to infrastructure and transportation in the Midwest, including costs associated with bridge scour and pavement degradation.28 The use of green infrastructure to reduce impacts associated with heavy precipitation is also documented in gray literature, including municipal planning documents. Using planted areas to absorb rainfall and reduce runoff has become a common approach to storm water management.223,275,276,347,348,349,350 Dechannelization and restoration of streams as a technique for improving storm water management is described in Trice (2013)282 and Milwaukee Metropolitan Sewer District (2017).281 Preservation of open space is described in Ducks Unlimited (2017)279 and the Ozaukee Washington Land Trust (2016).280 The use of urban forestry as an adaptation method is documented in the Minneapolis Marq2 Project (2017)277 and the Cleveland Tree Plan (2015).278 Projected costs to storm water systems are based on EPA projections.28
Major uncertainties
Although there is very high confidence that flood risk is increasing in the Midwest, there remains uncertainty about the relative contributions of climate change and land-use change. There is, however, sufficient evidence that changing precipitation patterns are leading to changes in hydrology in the Midwest,351,352,353,354,355 and that heavier precipitation patterns are consistent with projections from climate models, to justify a rating of medium confidence to the assertion that climate change is contributing to changes in flooding risk. There is high confidence that local governments and nongovernmental organizations are turning to green infrastructure solutions as a response to increased flooding risk. Additional research is needed to quantify the aggregate benefits of these approaches.
While it is clear that flood frequency and severity on major rivers in the Midwest have increased in recent decades, it must be emphasized that the change in precipitation levels is not the only factor contributing to the increase in flood risk. Land-use change, particularly the destruction of floodplains by levee systems, has also been documented as a key contributor to increasing flood risk in the Midwest.344,345,346 On smaller streams, tile drainage systems have been shown to exacerbate flood risk.24 Determining the relative contribution of land-use change and climate change to increases in riverine flood risk is an important research need.
Description of confidence and likelihood
There is medium confidence that climate change is contributing to increased flood risk in the Midwest; there is medium confidence that green infrastructure is reducing flood risk. There is much uncertainty associated with specific numerical projections. This leads to medium confidence that costs will exceed $500 million. However, the EPA projections are sufficient to provide high confidence that increasing the capacity of existing storm water systems in order to maintain current levels of service would require significant expenditures on the part of urban sewer districts.
Key Message 6: Community Vulnerability and Adaptation
At-risk communities in the Midwest are becoming more vulnerable to climate change impacts such as flooding, drought, and increases in urban heat islands (as likely as not, high confidence). Tribal nations are especially vulnerable because of their reliance on threatened natural resources for their cultural, subsistence, and economic needs (likely, medium confidence). Integrating climate adaptation into planning processes offers an opportunity to better manage climate risks now (medium confidence). Developing knowledge for decision-making in cooperation with vulnerable communities and tribal nations will help to build adaptive capacity and increase resilience (high confidence).
Description of evidence base
Limited evidence in the scientific literature indicates that at-risk communities in the Midwest will be increasingly vulnerable to the impacts of climate change, including increased flooding resulting from increased variation in precipitation patterns and changing lake levels,285 urban heat islands,287 and an intensification of heat and drought (see also the impacts and associated references in the previous sections).286
Several recent survey reports28,283,284 project negative climate impacts for tribal nations and Indigenous communities, especially as a result of an increased frequency of extreme precipitation events.283 Tribal nations are especially vulnerable to climate impacts because of their reliance on natural resources, 127 the isolation of rural communities, and potential shifts of species out of sovereign land.309,310 Climate change thus poses a threat to tribal culture, sovereignty, health, and way of life.39
Gray literature,293 survey reports,32 and scientific literature292 point to a few initiatives to integrate adaptation into municipal planning processes and utilize participatory methodologies to evaluate and manage climate risk.
A growing body of research indicates that interaction between producers of climate information, intermediaries, and end users plays a critical role in increasing climate knowledge integration and use for adaptation in the Midwest.224,294,300,308 Limited evidence links the implementation of adaptation actions identified as a result of these collaborations to reduced sensitivity.304,305,306
Major uncertainties
Limited research specific to the Midwest region contributes to uncertainty around the specific vulnerabilities of at-risk communities, including urban and rural communities and tribal nations. Though climate change planning and action in both Midwest cities and rural areas are underway, documentation remains low, few examples exist in the public literature of the failure or success of efforts to mainstream climate action into municipal governance, and attempts to assess vulnerabilities, especially in poor urban communities, frequently encounter climate justice barriers. Likewise, the number, scope, and nature of tribal adaptation plans remain undocumented, as does the degree of implementation of these plans and the manner in which Traditional Ecological Knowledge is incorporated.
Description of confidence and likelihood
There is high confidence that communities in the Midwest will as likely as not be increasingly vulnerable to climate change impacts such as flooding, urban heat islands, and drought. Similarly, there is medium confidence that tribal nations in the Midwest are likely to be especially vulnerable because of their reliance on threatened natural resources for their cultural, subsistence, and economic needs. Due to limited documentation in the literature, there is medium confidence that integrating adaptation into planning processes will offer an opportunity to manage climate risk better. Finally, there is high confidence that developing knowledge for decision-making in cooperation with vulnerable communities and tribal nations will help to decrease sensitivity and build adaptive capacity.