This chapter is based on the collective effort of 32 authors, 3 review editors, and 18 contributing authors comprising the writing team for the Climate Science Special Report (CSSR),208 a featured U.S. Global Change Research Project (USGCRP) deliverable and Volume I of the Fourth National Climate Assessment (NCA4). An open call for technical contributors took place in March 2016, and a federal science steering committee appointed the CSSR team. CSSR underwent three rounds of technical federal review, external peer review by the National Academies of Sciences, Engineering, and Medicine, and a review that was open to public comment. Three in-person Lead Authors Meetings were conducted at various stages of the development cycle to evaluate comments received, assign drafting responsibilities, and ensure cross-chapter coordination and consistency in capturing the state of climate science in the United States. In October 2016, an 11-member core writing team was tasked with capturing the most important CSSR key findings and generating an Executive Summary. The final draft of this summary and the underlying chapters was compiled in June 2017.
The NCA4 Chapter 2 author team was pulled exclusively from CSSR experts tasked with leading chapters and/or serving on the Executive Summary core writing team, thus representing a comprehensive cross-section of climate science disciplines and supplying the breadth necessary to synthesize CSSR content. NCA4 Chapter 2 authors are leading experts in climate science trends and projections, detection and attribution, temperature and precipitation change, severe weather and extreme events, sea level rise and ocean processes, mitigation, and risk analysis. The chapter was developed through technical discussions first promulgated by the literature assessments, prior efforts of USGCRP,208 e-mail exchanges, and phone consultations conducted to craft this chapter and subsequent deliberations via phone and e-mail exchanges to hone content for the current application. The team placed particular emphasis on the state of science, what was covered in USGCRP,208 and what is new since the release of the Third NCA in 2014.1
Key Message 1: Observed Changes in Global Climate
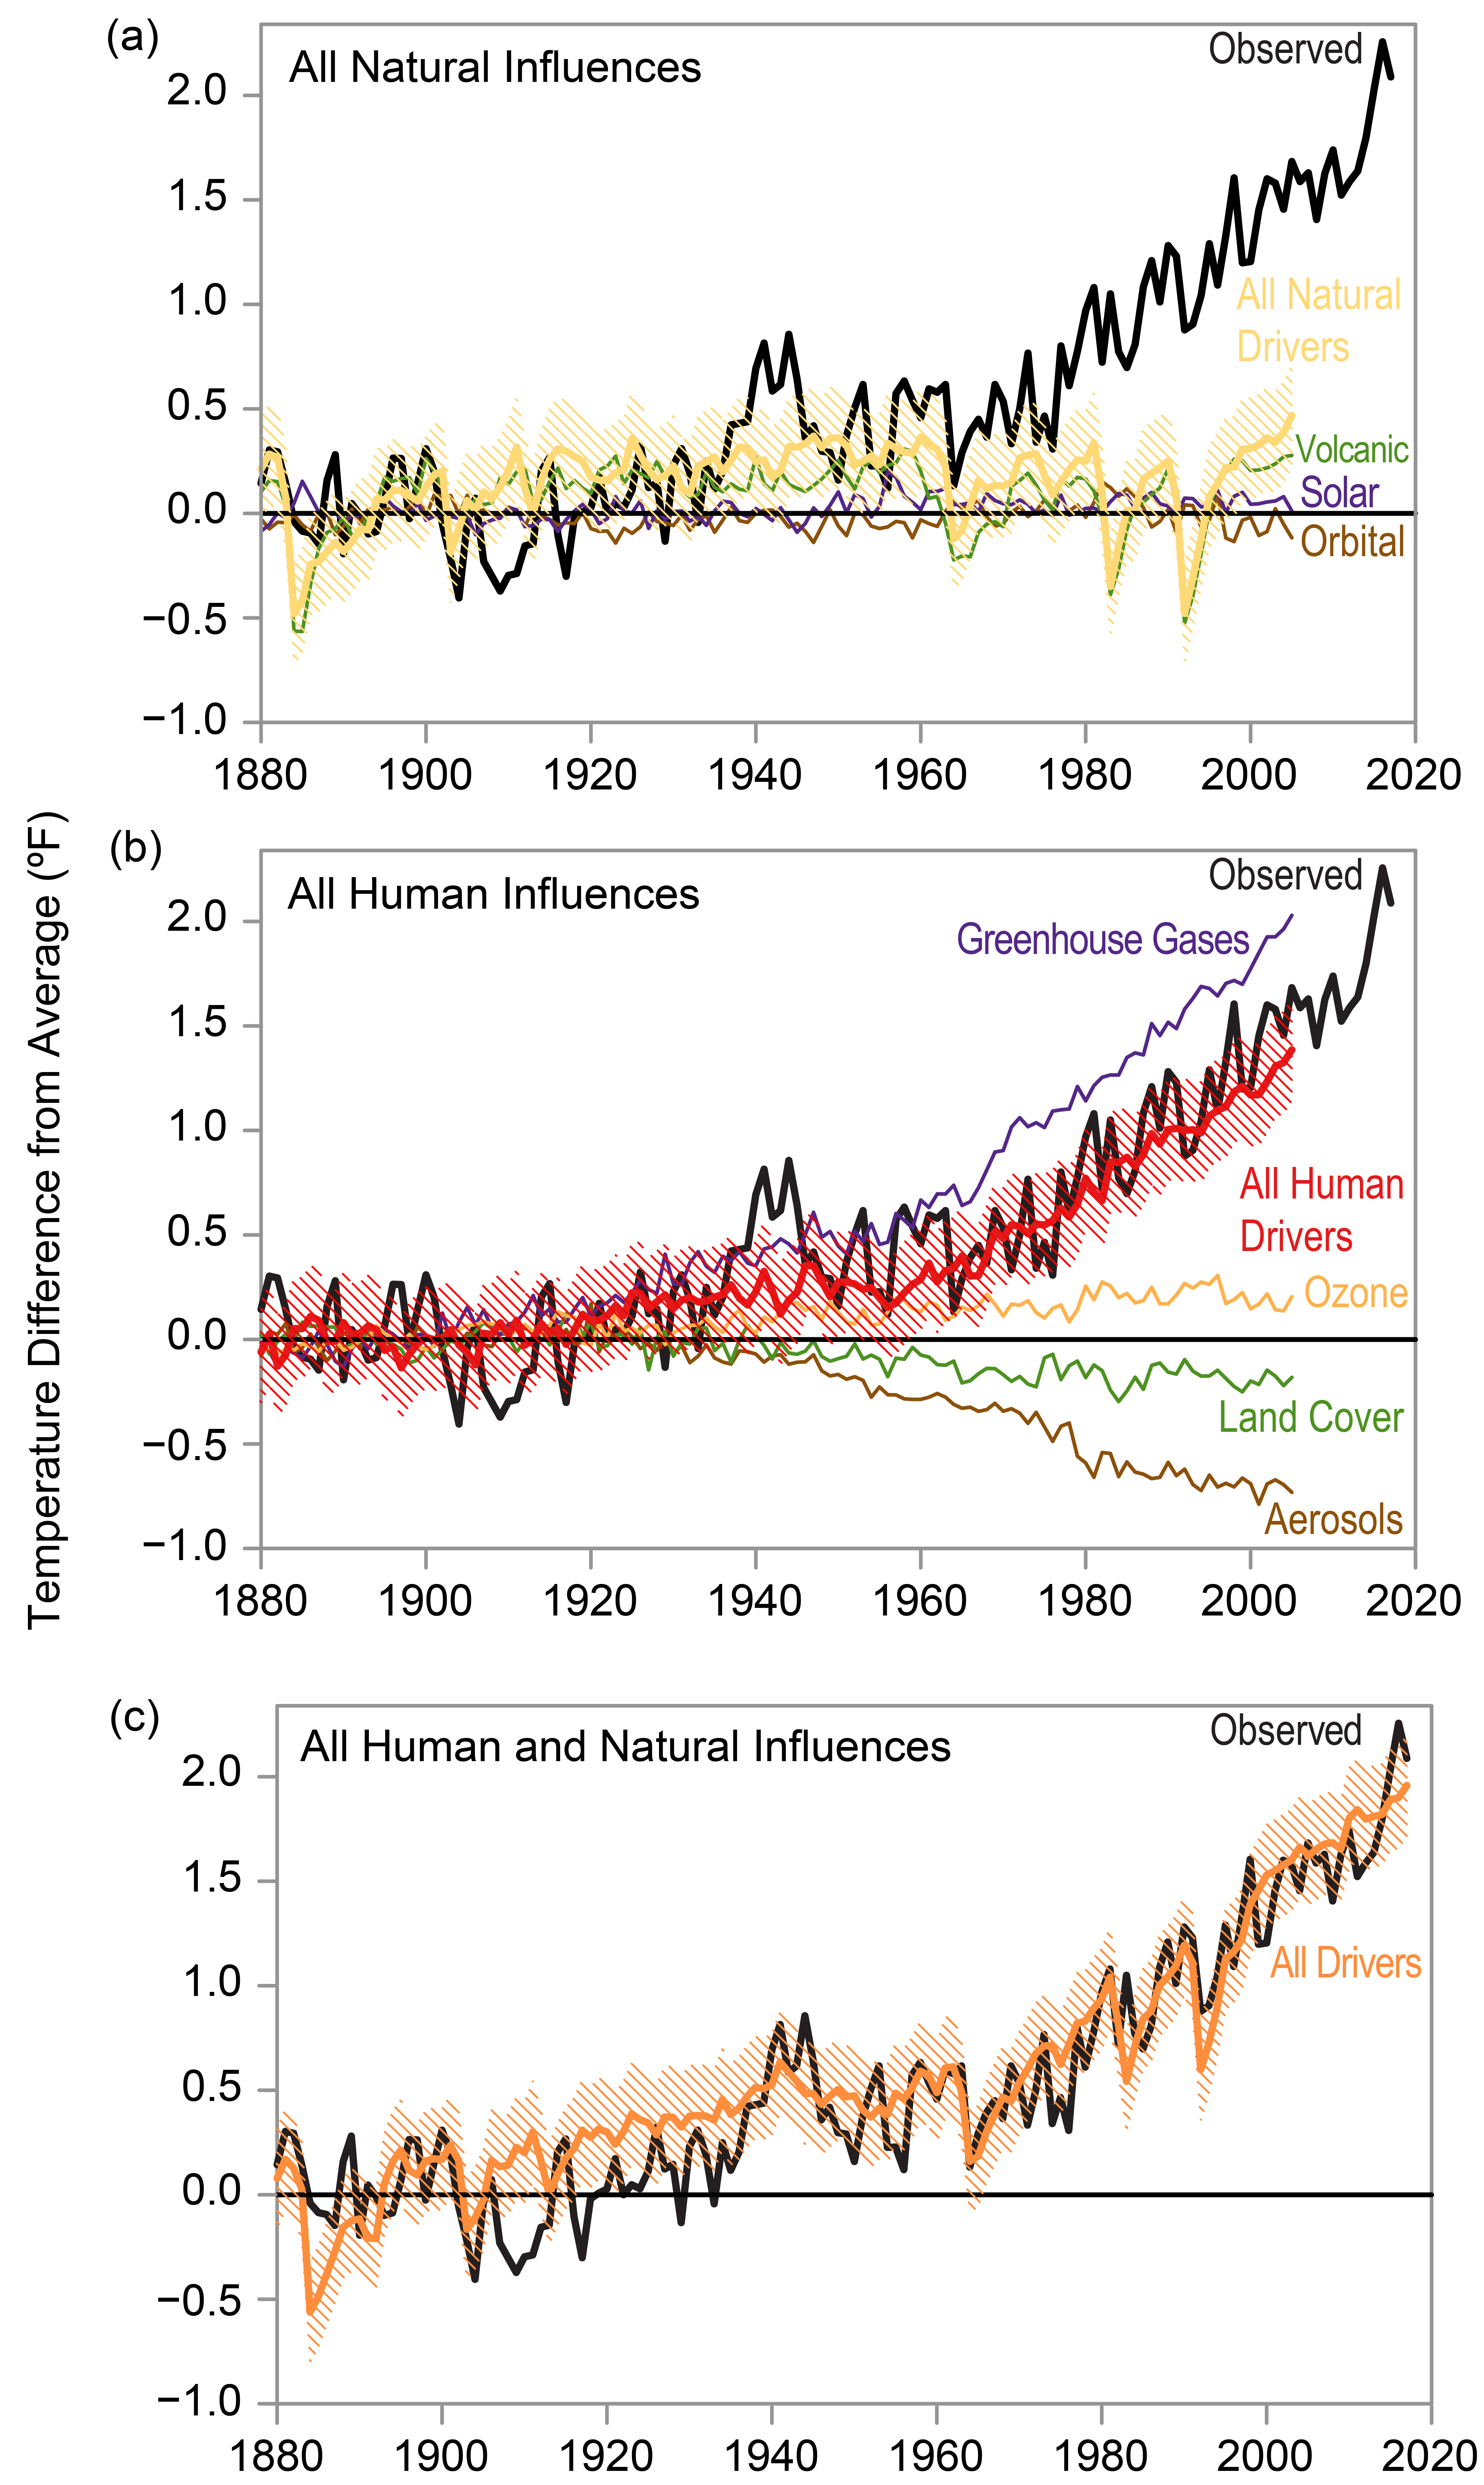
Global climate is changing rapidly compared to the pace of natural variations in climate that have occurred throughout Earth’s history. Global average temperature has increased by about 1.8°F from 1901 to 2016, and observational evidence does not support any credible natural explanations for this amount of warming; instead, the evidence consistently points to human activities, especially emissions of greenhouse or heat-trapping gases, as the dominant cause. (Very High Confidence)
Description of evidence base
The Key Message and supporting text summarize extensive evidence documented in the climate science literature and are similar to statements made in previous national (NCA3)1 and international249 assessments. The human effects on climate have been well documented through many papers in the peer-reviewed scientific literature (e.g., see Fahey et al. 201718 and Knutson et al. 201716 for more discussion of supporting evidence).
The finding of an increasingly strong positive forcing over the industrial era is supported by observed increases in atmospheric temperatures (see Wuebbles et al. 201710) and by observed increases in ocean temperatures.10,57,76 The attribution of climate change to human activities is supported by climate models, which are able to reproduce observed temperature trends when radiative forcing from human activities is included and considerably deviate from observed trends when only natural forcings are included (Wuebbles et al. 2017; Knutson et al. 2017, Figure 3.110,16).
Major uncertainties
Key remaining uncertainties relate to the precise magnitude and nature of changes at global, and particularly regional, scales and especially for extreme events and our ability to simulate and attribute such changes using climate models. The exact effects from land-use changes relative to the effects from greenhouse gas emissions need to be better understood.
The largest source of uncertainty in radiative forcing (both natural and anthropogenic) over the industrial era is quantifying forcing by aerosols. This finding is consistent across previous assessments (e.g., IPCC 2007, IPCC 2013249,250).
Recent work has highlighted the potentially larger role of variations in ultraviolet solar irradiance, versus total solar irradiance, in solar forcing. However, this increase in solar forcing uncertainty is not sufficiently large to reduce confidence that anthropogenic activities dominate industrial-era forcing.
Description of confidence and likelihood
There is very high confidence for a major human influence on climate.
Assessments of the natural forcings of solar irradiance changes and volcanic activity show with very high confidence that both forcings are small over the industrial era relative to total anthropogenic forcing. Total anthropogenic forcing is assessed to have become larger and more positive during the industrial era, while natural forcings show no similar trend.
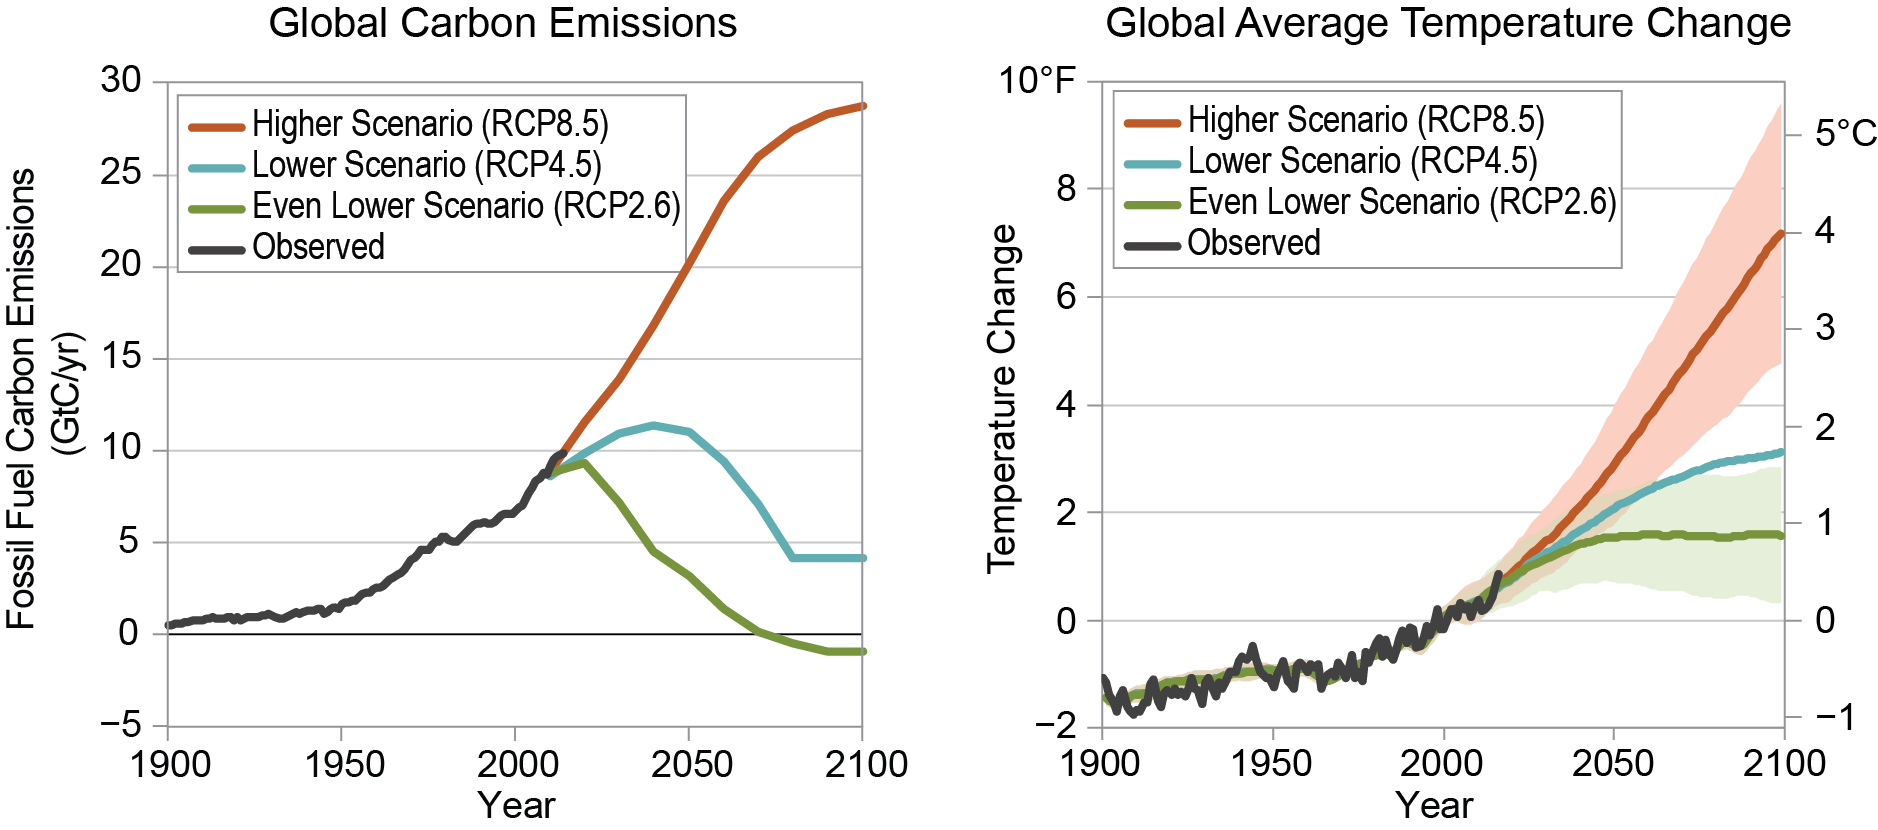
Key Message 2: Future Changes in Global Climate
Earth’s climate will continue to change over this century and beyond (very high confidence). Past mid-century, how much the climate changes will depend primarily on global emissions of greenhouse gases and on the response of Earth’s climate system to human-induced warming (very high confidence). With significant reductions in emissions, global temperature increase could be limited to 3.6°F (2°C) or less compared to preindustrial temperatures (high confidence). Without significant reductions, annual average global temperatures could increase by 9°F (5°C) or more by the end of this century compared to preindustrial temperatures (high confidence).
Description of evidence base
The Key Message and supporting text summarize extensive evidence documented in the climate science literature and are similar to statements made in previous national (NCA3)1 and international249 assessments. The projections for future climate have been well documented through many papers in the peer reviewed scientific literature (e.g., see Hayhoe et al. 201724 for descriptions of the scenarios and the models used).
Major uncertainties
Key remaining uncertainties relate to the precise magnitude and nature of changes at global, and particularly regional scales, and especially for extreme events and our ability to simulate and attribute such changes using climate models. Of particular importance are remaining uncertainties in the understanding of feedbacks in the climate system, especially in ice–albedo and cloud cover feedbacks. Continued improvements in climate modeling to represent the physical processes affecting the Earth’s climate system are aimed at reducing uncertainties. Enhanced monitoring and observation programs also can help improve the understanding needed to reduce uncertainties.
Description of confidence and likelihood
There is very high confidence for continued changes in climate and high confidence for the levels shown in the Key Message.
Key Message 3: Warming and Acidifying Oceans
The world’s oceans have absorbed 93% of the excess heat from human-induced warming since the mid-20th century and are currently absorbing more than a quarter of the carbon dioxide emitted to the atmosphere annually from human activities, making the oceans warmer and more acidic (very high confidence). Increasing sea surface temperatures, rising sea levels, and changing patterns of precipitation, winds, nutrients, and ocean circulation are contributing to overall declining oxygen concentrations in many locations (high confidence).
Description of evidence base
The Key Message and supporting text summarize the evidence documented in climate science literature as summarized in Rhein et al. (2013).31 Oceanic warming has been documented in a variety of data sources, most notably by the World Ocean Circulation Experiment (WOCE),251 Argo,252 and the Extended Reconstructed Sea Surface Temperature v4 (ERSSTv4).253 There is particular confidence in calculated warming for the time period since 1971 due to increased spatial and depth coverage and the level of agreement among independent sea surface temperature (SST) observations from satellites, surface drifters and ships, and independent studies using differing analyses, bias corrections, and data sources.20,33,68 Other observations such as the increase in mean sea level rise (see Sweet et al. 201776) and reduced Arctic/Antarctic ice sheets (see Taylor et al. 2017122) further confirm the increase in thermal expansion. For the purpose of extending the selected time periods back from 1900 to 2016 and analyzing U.S. regional SSTs, the ERSSTv4253 is used. For the centennial time scale changes over 1900–2016, warming trends in all regions are statistically significant with the 95% confidence level. U.S. regional SST warming is similar between calculations using ERSSTv4 in this report and those published by Belkin (2016),254 suggesting confidence in these findings.
Evidence for oxygen trends arises from extensive global measurements of WOCE after 1989 and individual profiles before that.43 The first basin-wide dissolved oxygen surveys were performed in the 1920s.255 The confidence level is based on globally integrated O2 distributions in a variety of ocean models. Although the global mean exhibits low interannual variability, regional contrasts are large.
Major uncertainties
Uncertainties in the magnitude of ocean warming stem from the disparate measurements of ocean temperature over the last century. There is high confidence in warming trends of the upper ocean temperature from 0–700 m depth, whereas there is more uncertainty for deeper ocean depths of 700–2,000 m due to the short record of measurements from those areas. Data on warming trends at depths greater than 2,000 m are even more sparse. There are also uncertainties in the timing and reasons for particular decadal and interannual variations in ocean heat content and the contributions that different ocean basins play in the overall ocean heat uptake.
Uncertainties in ocean oxygen content (as estimated from the intermodel spread) in the global mean are moderate mainly because ocean oxygen content exhibits low interannual variability when globally averaged. Uncertainties in long-term decreases of the global averaged oxygen concentration amount to 25% in the upper 1,000 m for the 1970–1992 period and 28% for the 1993–2003 period. Remaining uncertainties relate to regional variability driven by mesoscale eddies and intrinsic climate variability such as ENSO.
Description of confidence and likelihood
There is very high confidence in measurements that show increases in the ocean heat content and warming of the ocean, based on the agreement of different methods. However, long-term data in total ocean heat uptake in the deep ocean are sparse, leading to limited knowledge of the transport of heat between and within ocean basins.
Major ocean deoxygenation is taking place in bodies of water inland, at estuaries, and in the coastal and the open ocean (high confidence). Regionally, the phenomenon is exacerbated by local changes in weather, ocean circulation, and continental inputs to the oceans.
Key Message 4: Rising Global Sea Levels
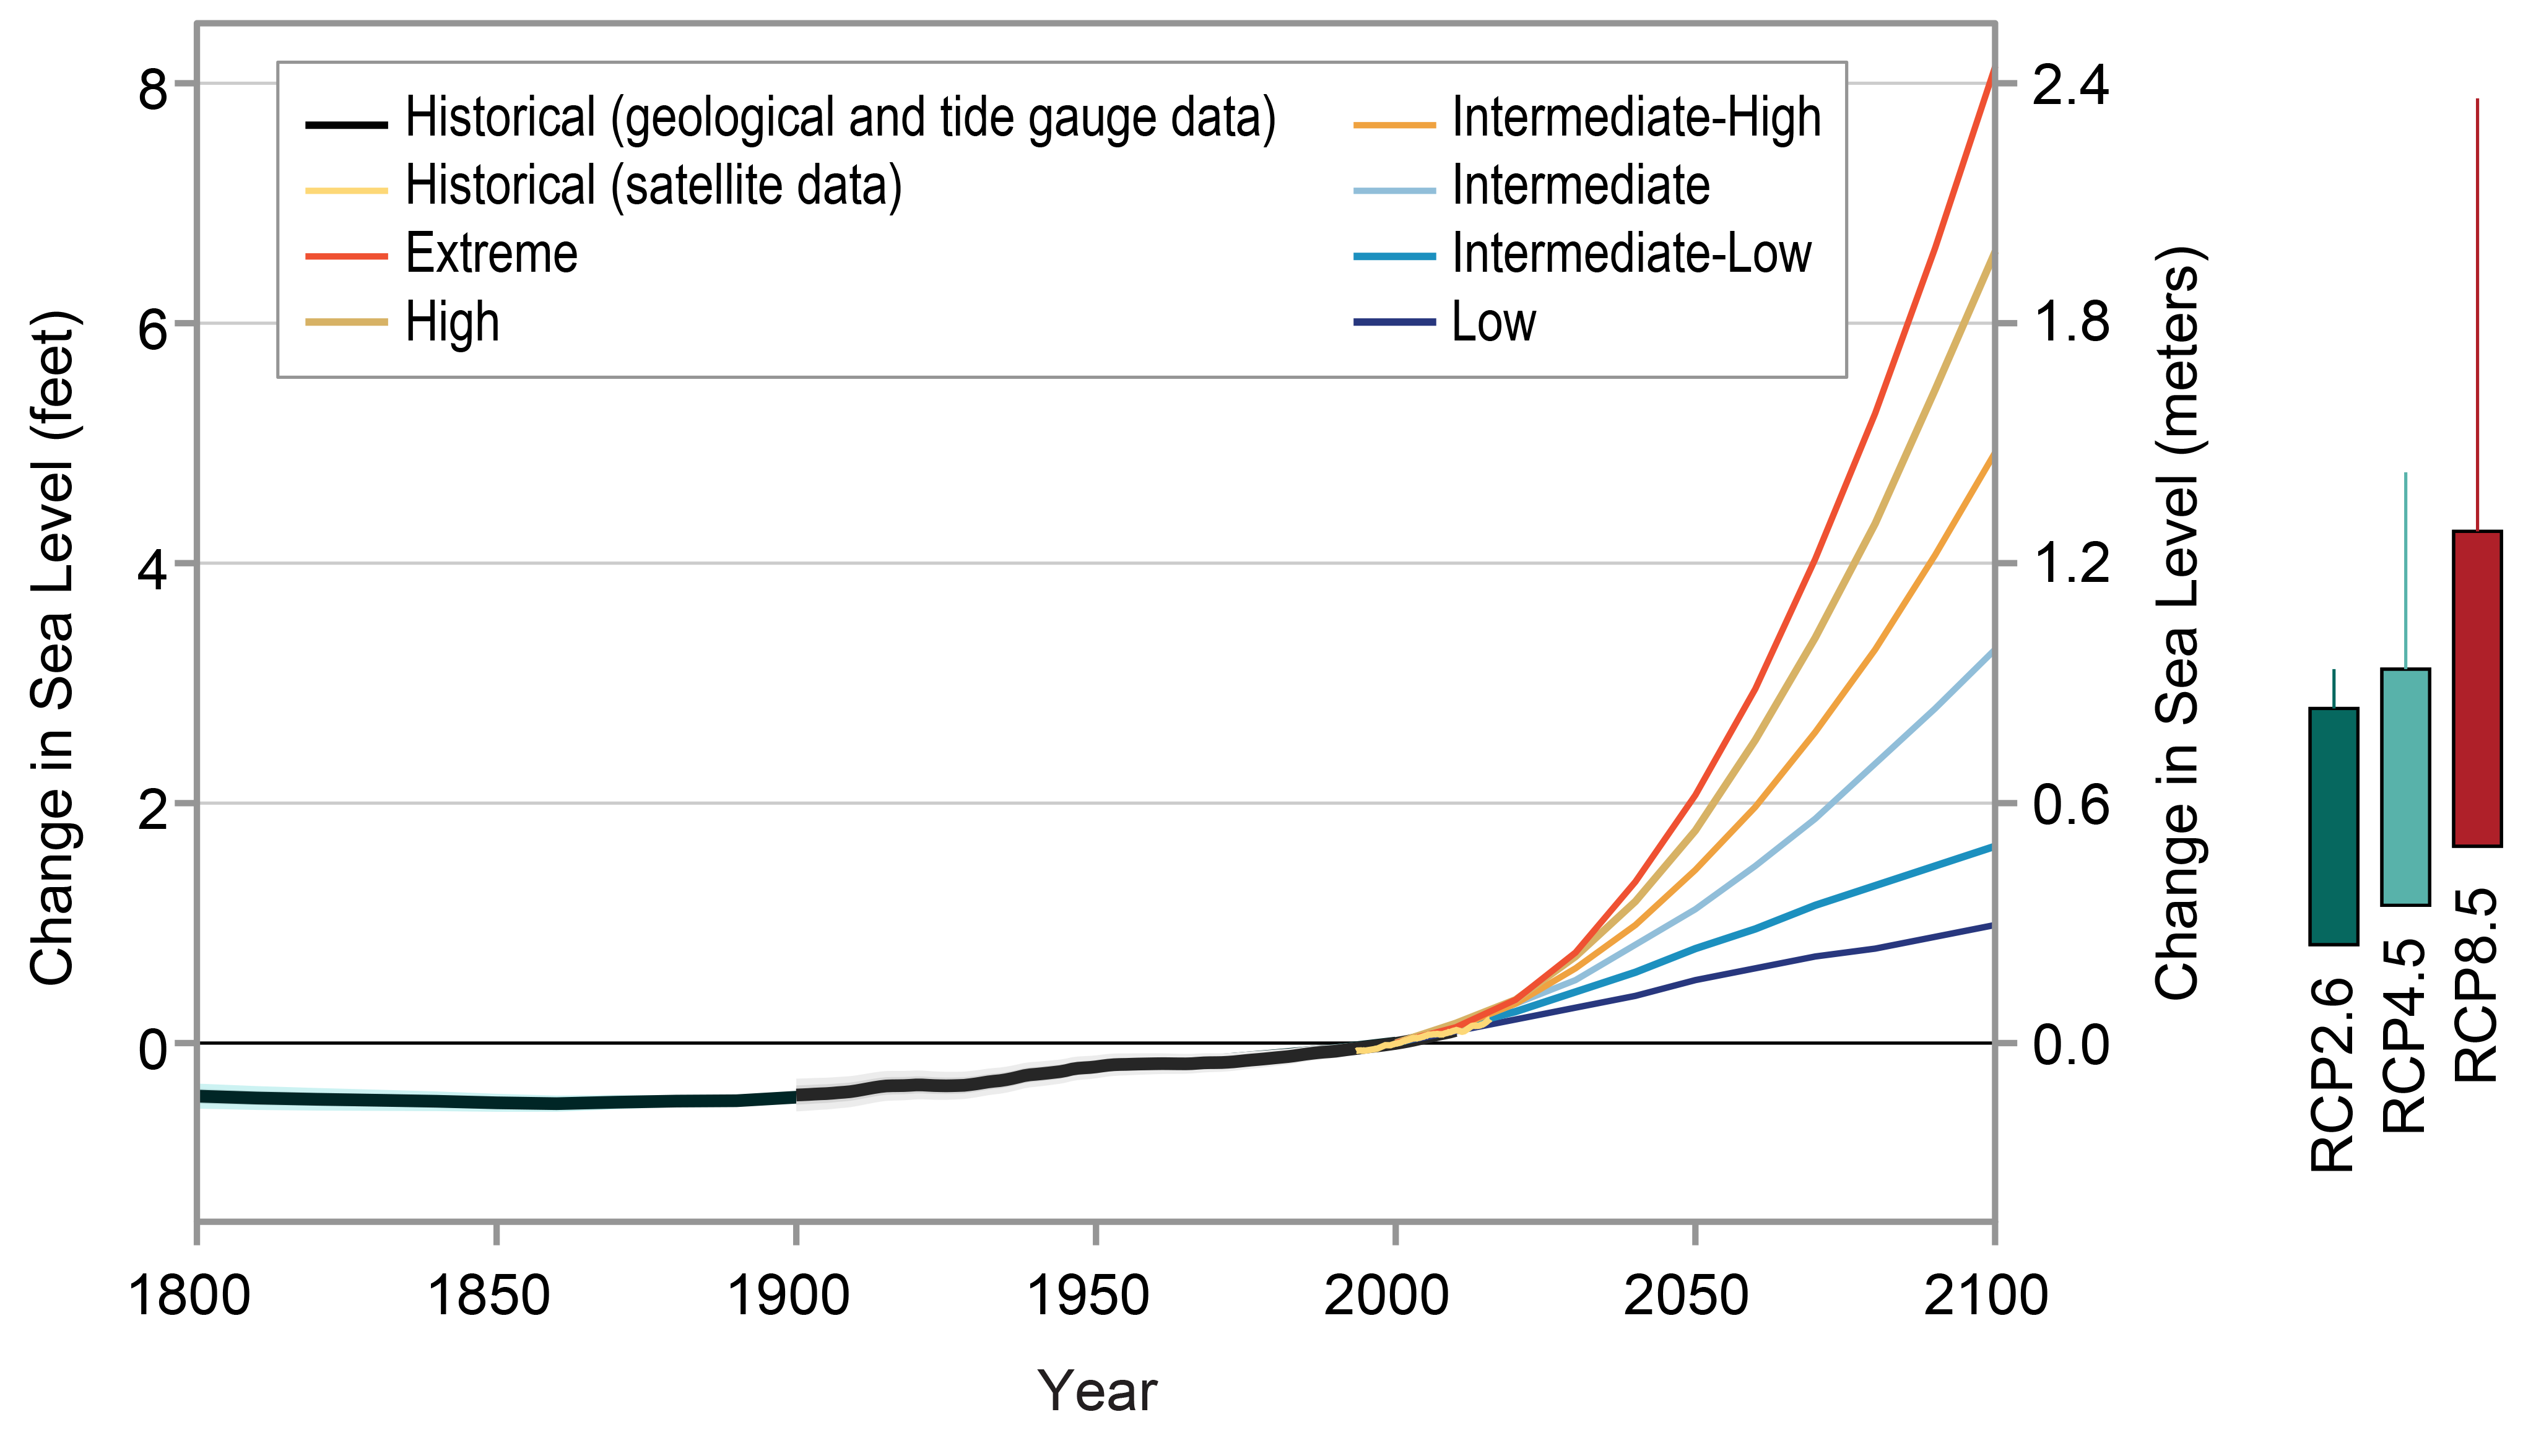
Global average sea level has risen by about 7–8 inches (16–21 cm) since 1900, with almost half this rise occurring since 1993 as oceans have warmed and land-based ice has melted (very high confidence). Relative to the year 2000, sea level is very likely to rise 1 to 4 feet (0.3 to 1.3 m) by the end of the century (medium confidence). Emerging science regarding Antarctic ice sheet stability suggests that, for higher scenarios, a rise exceeding 8 feet (2.4 m) by 2100 is physically possible, although the probability of such an extreme outcome cannot currently be assessed.
Description of evidence base
Multiple researchers, using different statistical approaches, have integrated tide gauge records to estimate global mean sea level (GMSL) rise since the late 19th century (e.g., Church and White 2006, 2011; Hay et al. 2015; Jevrejeva et al. 200961,73,74,256). The most recent published rate estimates are 1.2 ± 0.2 mm/year73 or 1.5 ± 0.2 mm/year74 over 1901–1990. Thus, these results indicate about 4–5 inches (11–14 cm) of GMSL rise from 1901 to 1990. Tide gauge analyses indicate that GMSL rose at a considerably faster rate of about 0.12 inches/year (3 mm/year) since 1993,73,74 a result supported by satellite data indicating a trend of 0.13 inches/year (3.4 ± 0.4 mm/year) over 1993–2015 (update to Nerem et al. 2010;75 see also Sweet et al. 2017,57 Figure 12.3a). These results indicate an additional GMSL rise of about 3 inches (7 cm) since 1990. Thus, total GMSL rise since 1900 is about 7–8 inches (18–21 cm).
The finding regarding the historical context of the 20th-century change is based upon Kopp et al. (2016),58 who conducted a meta-analysis of geological regional sea level (RSL) reconstructions, spanning the last 3,000 years, from 24 locations around the world, as well as tide gauge data from 66 sites and the tide-gauge-based GMSL reconstruction of Hay et al. (2015).73 By constructing a spatiotemporal statistical model of these datasets, they identified the common global sea level signal over the last three millennia, and its uncertainties. They found a 95% probability that the average rate of GMSL change over 1900–2000 was greater than during any preceding century in at least 2,800 years.
The lower bound of the very likely range is based on a continuation of the observed, approximately 3 mm/year rate of GMSL rise. The upper end of the very likely range is based on estimates for a higher scenario (RCP8.5) from three studies producing fully probabilistic projections across multiple RCPs. Kopp et al.(2014)77 fused multiple sources of information accounting for the different individual process contributing to GMSL rise. Kopp et al. (2016)58 constructed a semi-empirical sea level model calibrated to the Common Era sea level reconstruction. Mengel et al. (2016)257 constructed a set of semi-empirical models of the different contributing processes. All three studies show negligible scenario dependence in the first half of this century but increasing in prominence in the second half of the century. A sensitivity study by Kopp et al. (2014),77 as well as studies by Jevrejeva et al. (2014)78 and by Jackson and Jevrejeva (2016),258 used frameworks similar to Kopp et al. (2016)58 but incorporated an expert elicitation study on ice sheet stability.259 (This study was incorporated in the main results of Kopp et al. 201477 with adjustments for consistency with Church et al. 2013.56) These studies extend the very likely range for RCP8.5 as high as 5–6 feet (160–180 cm; see Kopp et al. 2014, sensitivity study; Jevrejeva et al. 2014; Jackson and Jevrejeva 2016).77,78,258
As described in Sweet et al. (2017),57 Miller et al. (2013),260 and Kopp et al. (2017),77 several lines of arguments exist that support a plausible worst-case GMSL rise scenario in the range of 2.0 m to 2.7 m by 2100. Pfeffer et al. (2008)261 constructed a “worst-case” 2.0 m scenario, based on acceleration of mass loss from Greenland, that assumed a 30 cm GMSL contribution from thermal expansion. However, Sriver et al. (2012)262 find a physically plausible upper bound from thermal expansion exceeding 50 cm (an additional ~20-cm increase). The ~60 cm maximum contribution by 2100 from Antarctica in Pfeffer et al. (2008)261 could be exceeded by ~30 cm, assuming the 95th percentile for Antarctic melt rate (~22 mm/year) of the Bamber and Aspinall (2013)259 expert elicitation study is achieved by 2100 through a linear growth in melt rate. The Pfeffer et al. (2008)261 study did not include the possibility of a net decrease in land-water storage due to groundwater withdrawal; Church et al. (2013)56 find a likely land-water storage contribution to 21st century GMSL rise of −1 cm to +11 cm. These arguments all point to the physical plausibility of GMSL rise in excess of 8 feet (240 cm).
Additional arguments come from model results examining the effects of marine ice-cliff collapse and ice-shelf hydro-fracturing on Antarctic loss rates.80 To estimate the effect of incorporating the DeConto and Pollard (2016)80 projections of Antarctic ice sheet melt, Kopp et al. (2017)81 substituted the bias-corrected ensemble of DeConto and Pollard80 into the Kopp et al. (2014)77 framework. This elevates the projections for 2100 to 3.1–8.9 feet (93–243 cm) for RCP8.5, 1.6–5.2 feet (50–158 cm) for RCP4.5, and 0.9–3.2 feet (26–98 cm) for RCP2.6. DeConto and Pollard80 is just one study, not designed in a manner intended to produce probabilistic projections, and so these results cannot be used to ascribe probability; they do, however, support the physical plausibility of GMSL rise in excess of 8 feet.
Very likely ranges, 2030 relative to 2000 in cm (feet)
|
Kopp et al. (2014)77 |
Kopp et al. (2016)58 |
Kopp et al. (2017)81 DP16 |
Mengel et al. (2016)257 |
| RCP8.5 (higher) |
11–18 (0.4–0.6) |
8–15 (0.3–0.5) |
6–22 (0.2–0.7) |
7–12 (0.2–0.4) |
| RCP4.5 (lower) |
10–18 (0.3–0.6) |
8–15 (0.3–0.5) |
6–23 (0.2–0.8) |
7–12 (0.2–0.4) |
| RCP2.6 (very low) |
10–18 (0.3–0.6) |
8–15 (0.3–0.5) |
6–23 (0.2–0.8) |
7–12 (0.2–0.4) |
Very likely ranges, 2050 relative to 2000 in cm (feet)
|
Kopp et al. (2014)77 |
Kopp et al. (2016)58 |
Kopp et al. (2017)81 DP16 |
Mengel et al. (2016)257 |
| RCP8.5 (higher) |
21–38 (0.7–1.2) |
16–34 (0.5–1.1) |
17–48 (0.6–1.6) |
15–28 (0.5–0.9) |
| RCP4.5 (lower) |
18–35 (0.6–1.1) |
15–31 (0.5–1.0) |
14–43 (0.5–1.4) |
14–25 (0.5–0.8) |
| RCP2.6 (very low) |
18–33 (0.6–1.1) |
14–29 (0.5–1.0) |
12–41 (0.4–1.3) |
13–23 (0.4–0.8) |
Very likely ranges, 2100 relative to 2000 in cm (feet)
|
Kopp et al. (2014)77 |
Kopp et al. (2016)58 |
Kopp et al. (2017)81 DP16 |
Mengel et al. (2016)257 |
| RCP8.5 (higher) |
55–121 (1.8–4.0) |
52–131 (1.7–4.3) |
93–243 (3.1–8.0) |
57–131 (1.9–4.3) |
| RCP4.5 (lower) |
36–93 (1.2–3.1) |
33–85 (1.1–2.8) |
50–158 (1.6–5.2) |
37–77 (1.2–2.5) |
| RCP2.6 (very low) |
29–82 (1.0–2.7) |
24–61 (0.8–2.0) |
26–98 (0.9–3.2) |
28–56 (0.9–1.8) |
Major uncertainties
Uncertainties in reconstructed GMSL change relate to the sparsity of tide gauge records, particularly before the middle of the 20th century, and to different statistical approaches for estimating GMSL change from these sparse records. Uncertainties in reconstructed GMSL change before the twentieth century also relate to the sparsity of geological proxies for sea level change, the interpretation of these proxies, and the dating of these proxies. Uncertainty in attribution relates to the reconstruction of past changes and the magnitude of unforced variability.
Since NCA3, multiple different approaches have been used to generate probabilistic projections of GMSL rise, conditional upon the RCPs. These approaches are in general agreement. However, emerging results indicate that marine-based sectors of the Antarctic ice sheet are more unstable than previous modeling indicated. The rate of ice sheet mass changes remains challenging to project.
Description of confidence and likelihood
This Key Message is based upon multiple analyses of tide gauge and satellite altimetry records, on a meta-analysis of multiple geological proxies for pre-instrumental sea level change, and on both statistical and physical analyses of the human contribution to GMSL rise since 1900.
It is also based upon multiple methods for estimating the probability of future sea level change and on new modeling results regarding the stability of marine-based ice in Antarctica.
Confidence is very high in the rate of GMSL rise since 1900, based on multiple different approaches to estimating GMSL rise from tide gauges and satellite altimetry. Confidence is high in the substantial human contribution to GMSL rise since 1900, based on both statistical and physical modeling evidence. There is medium confidence that the magnitude of the observed rise since 1900 is unprecedented in the context of the previous 2,700 years, based on meta-analysis of geological proxy records.
There is very high confidence that GMSL rise over the next several decades will be at least as fast as a continuation of the historical trend over the last quarter century would indicate. There is medium confidence in the upper end of very likely ranges for 2030 and 2050. Due to possibly large ice sheet contributions, there is low confidence in the upper end of very likely ranges for 2100. Based on multiple projection methods, there is high confidence that differences between scenarios are small before 2050 but significant beyond 2050.
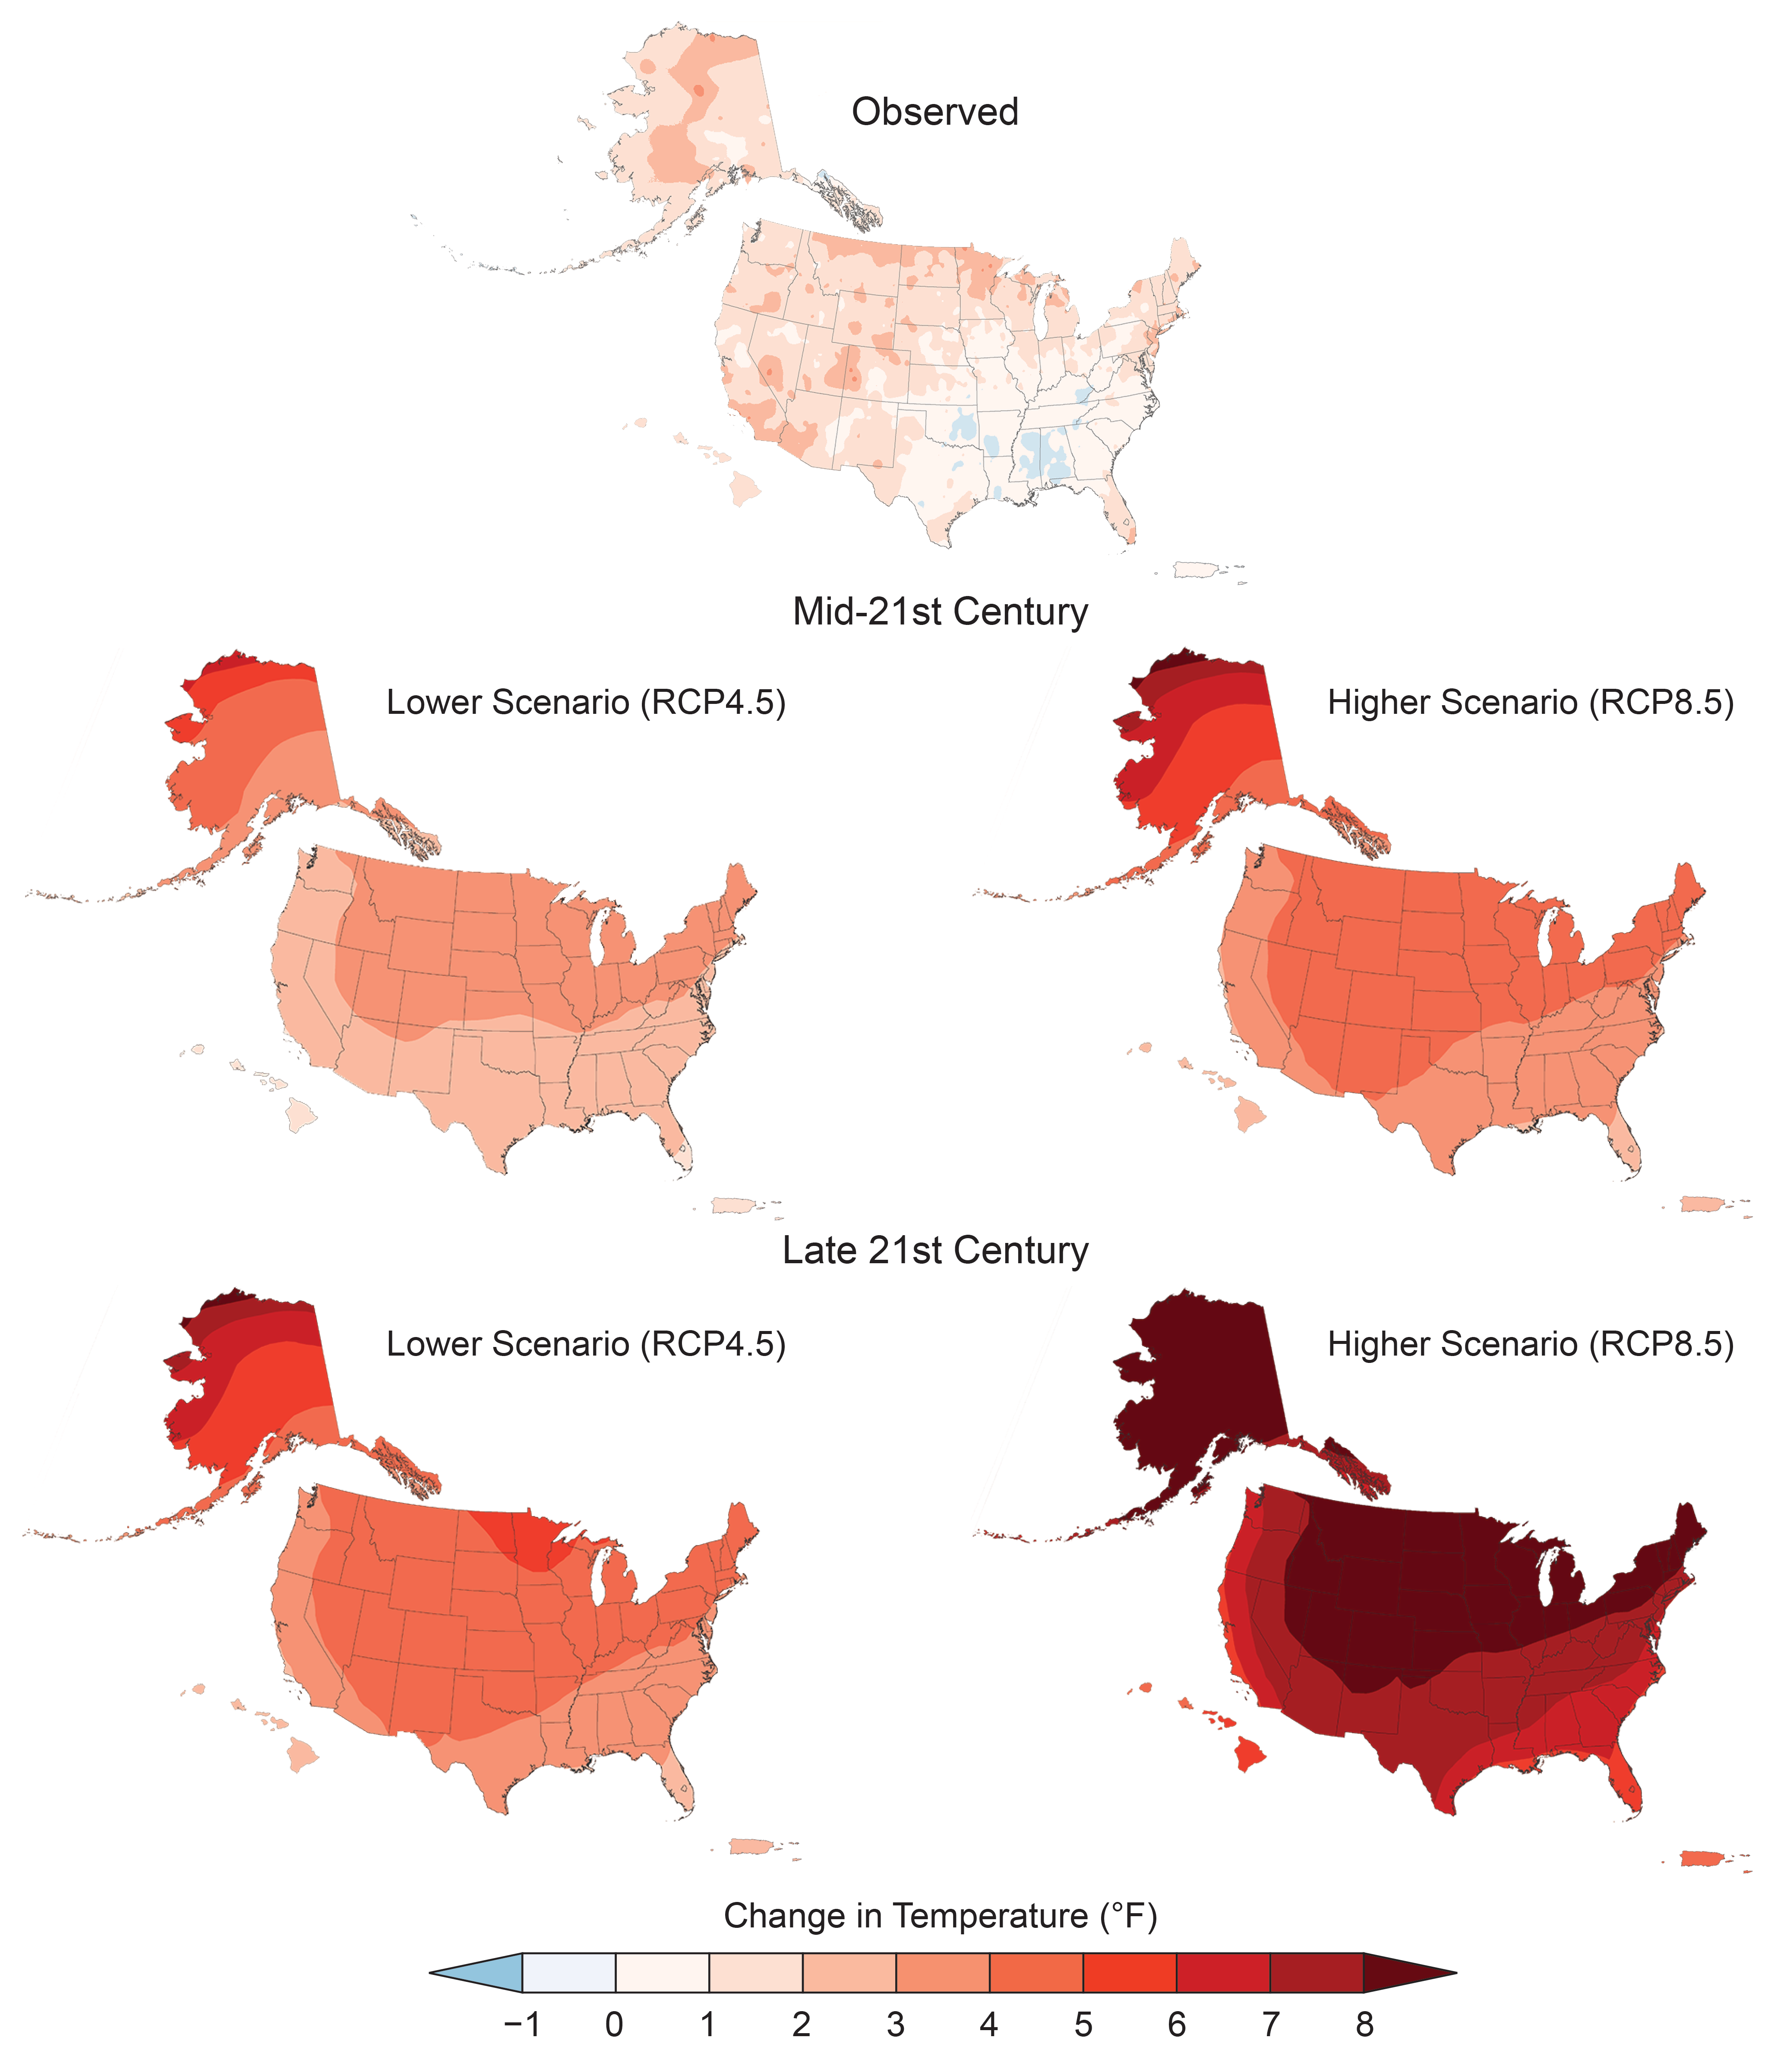
Key Message 5: Increasing U.S. Temperatures
Annual average temperature over the contiguous United States has increased by 1.2ºF (0.7°C) over the last few decades and by 1.8°F (1°C) relative to the beginning of the last century (very high confidence). Additional increases in annual average temperature of about 2.5°F (1.4°C) are expected over the next few decades regardless of future emissions, and increases ranging from 3°F to 12°F (1.6°–6.6°C) are expected by the end of century, depending on whether the world follows a higher or lower future scenario, with proportionally greater changes in high temperature extremes (high confidence).
Description of evidence base
The Key Message and supporting text summarize extensive evidence documented in the climate science literature. Similar statements about changes exist in other reports (e.g., NCA3,1 Climate Change Impacts in the United States,263 SAP 1.1: Temperature trends in the lower atmosphere).264
Evidence for changes in U.S. climate arises from multiple analyses of data from in situ, satellite, and other records undertaken by many groups over several decades. The primary dataset for surface temperatures in the United States is nClimGrid,85,152 though trends are similar in the U.S. Historical Climatology Network, the Global Historical Climatology Network, and other datasets. Several atmospheric reanalyses (e.g., 20th Century Reanalysis, Climate Forecast System Reanalysis, ERA-Interim, and Modern Era Reanalysis for Research and Applications) confirm rapid warming at the surface since 1979, and observed trends closely track the ensemble mean of the reanalyses.265 Several recently improved satellite datasets document changes in middle tropospheric temperatures.7,266 Longer-term changes are depicted using multiple paleo analyses (e.g., Trouet et al. 2013, Wahl and Smerdon 2012).86,267
Evidence for changes in U.S. climate arises from multiple analyses of in situ data using widely published climate extremes indices. For the analyses presented here, the source of in situ data is the Global Historical Climatology Network–Daily dataset.268 Changes in extremes were assessed using long-term stations with minimal missing data to avoid network-induced variability on the long-term time series. Cold wave frequency was quantified using the Cold Spell Duration Index,269 heat wave frequency was quantified using the Warm Spell Duration Index,269 and heat wave intensity was quantified using the Heat Wave Magnitude Index Daily.270 Station-based index values were averaged into 4° grid boxes, which were then area-averaged into a time series for the contiguous United States. Note that a variety of other threshold and percentile-based indices were also evaluated, with consistent results (e.g., the Dust Bowl was consistently the peak period for extreme heat). Changes in record-setting temperatures were quantified, as in Meehl et al. (2016).13
Projections are based on global model results and associated downscaled products from CMIP5 for a lower scenario (RCP4.5) and a higher scenario (RCP8.5). Model weighting is employed to refine projections for each RCP. Weighting parameters are based on model independence and skill over North America for seasonal temperature and annual extremes. The multimodel mean is based on 32 model projections that were statistically downscaled using the LOcalized Constructed Analogs technique.247 The range is defined as the difference between the average increase in the three coolest models and the average increase in the three warmest models. All increases are significant (i.e., more than 50% of the models show a statistically significant change, and more than 67% agree on the sign of the change).271
Major uncertainties
The primary uncertainties for surface data relate to historical changes in station location, temperature instrumentation, observing practice, and spatial sampling (particularly in areas and periods with low station density, such as the intermountain West in the early 20th century). Much research has been done to account for these issues, resulting in techniques that make adjustments at the station level to improve the homogeneity of the time series (e.g., Easterling and Peterson 1995, Menne and Williams 2009272,273). Further, Easterling et al. (1996)274 examined differences in area-averaged time series at various scales for homogeneity-adjusted temperature data versus non-adjusted data and found that when the area reached the scale of the NCA regions, little differences were found. Satellite records are similarly impacted by non-climatic changes such as orbital decay, diurnal sampling, and instrument calibration to target temperatures. Several uncertainties are inherent in temperature-sensitive proxies, such as dating techniques and spatial sampling.
Global climate models are subject to structural and parametric uncertainty, resulting in a range of estimates of future changes in average temperature. This is partially mitigated through the use of model weighting and pattern scaling. Furthermore, virtually every ensemble member of every model projection contains an increase in temperature by mid- and late-century. Empirical downscaling introduces additional uncertainty (e.g., with respect to stationarity).
Description of confidence and likelihood
There is very high confidence in trends since 1895, based on the instrumental record, since this is a long-term record with measurements made with relatively high precision. There is high confidence for trends that are based on surface/satellite agreement since 1979, since this is a shorter record. There is medium confidence for trends based on paleoclimate data, as this is a long record but with relatively low precision.
There is very high confidence in observed changes in average annual and seasonal temperature and observed changes in temperature extremes over the United States, as these are based upon the convergence of evidence from multiple data sources, analyses, and assessments including the instrumental record.
There is high confidence that the range of projected changes in average temperature and temperature extremes over the United States encompasses the range of likely change, based upon the convergence of evidence from basic physics, multiple model simulations, analyses, and assessments.
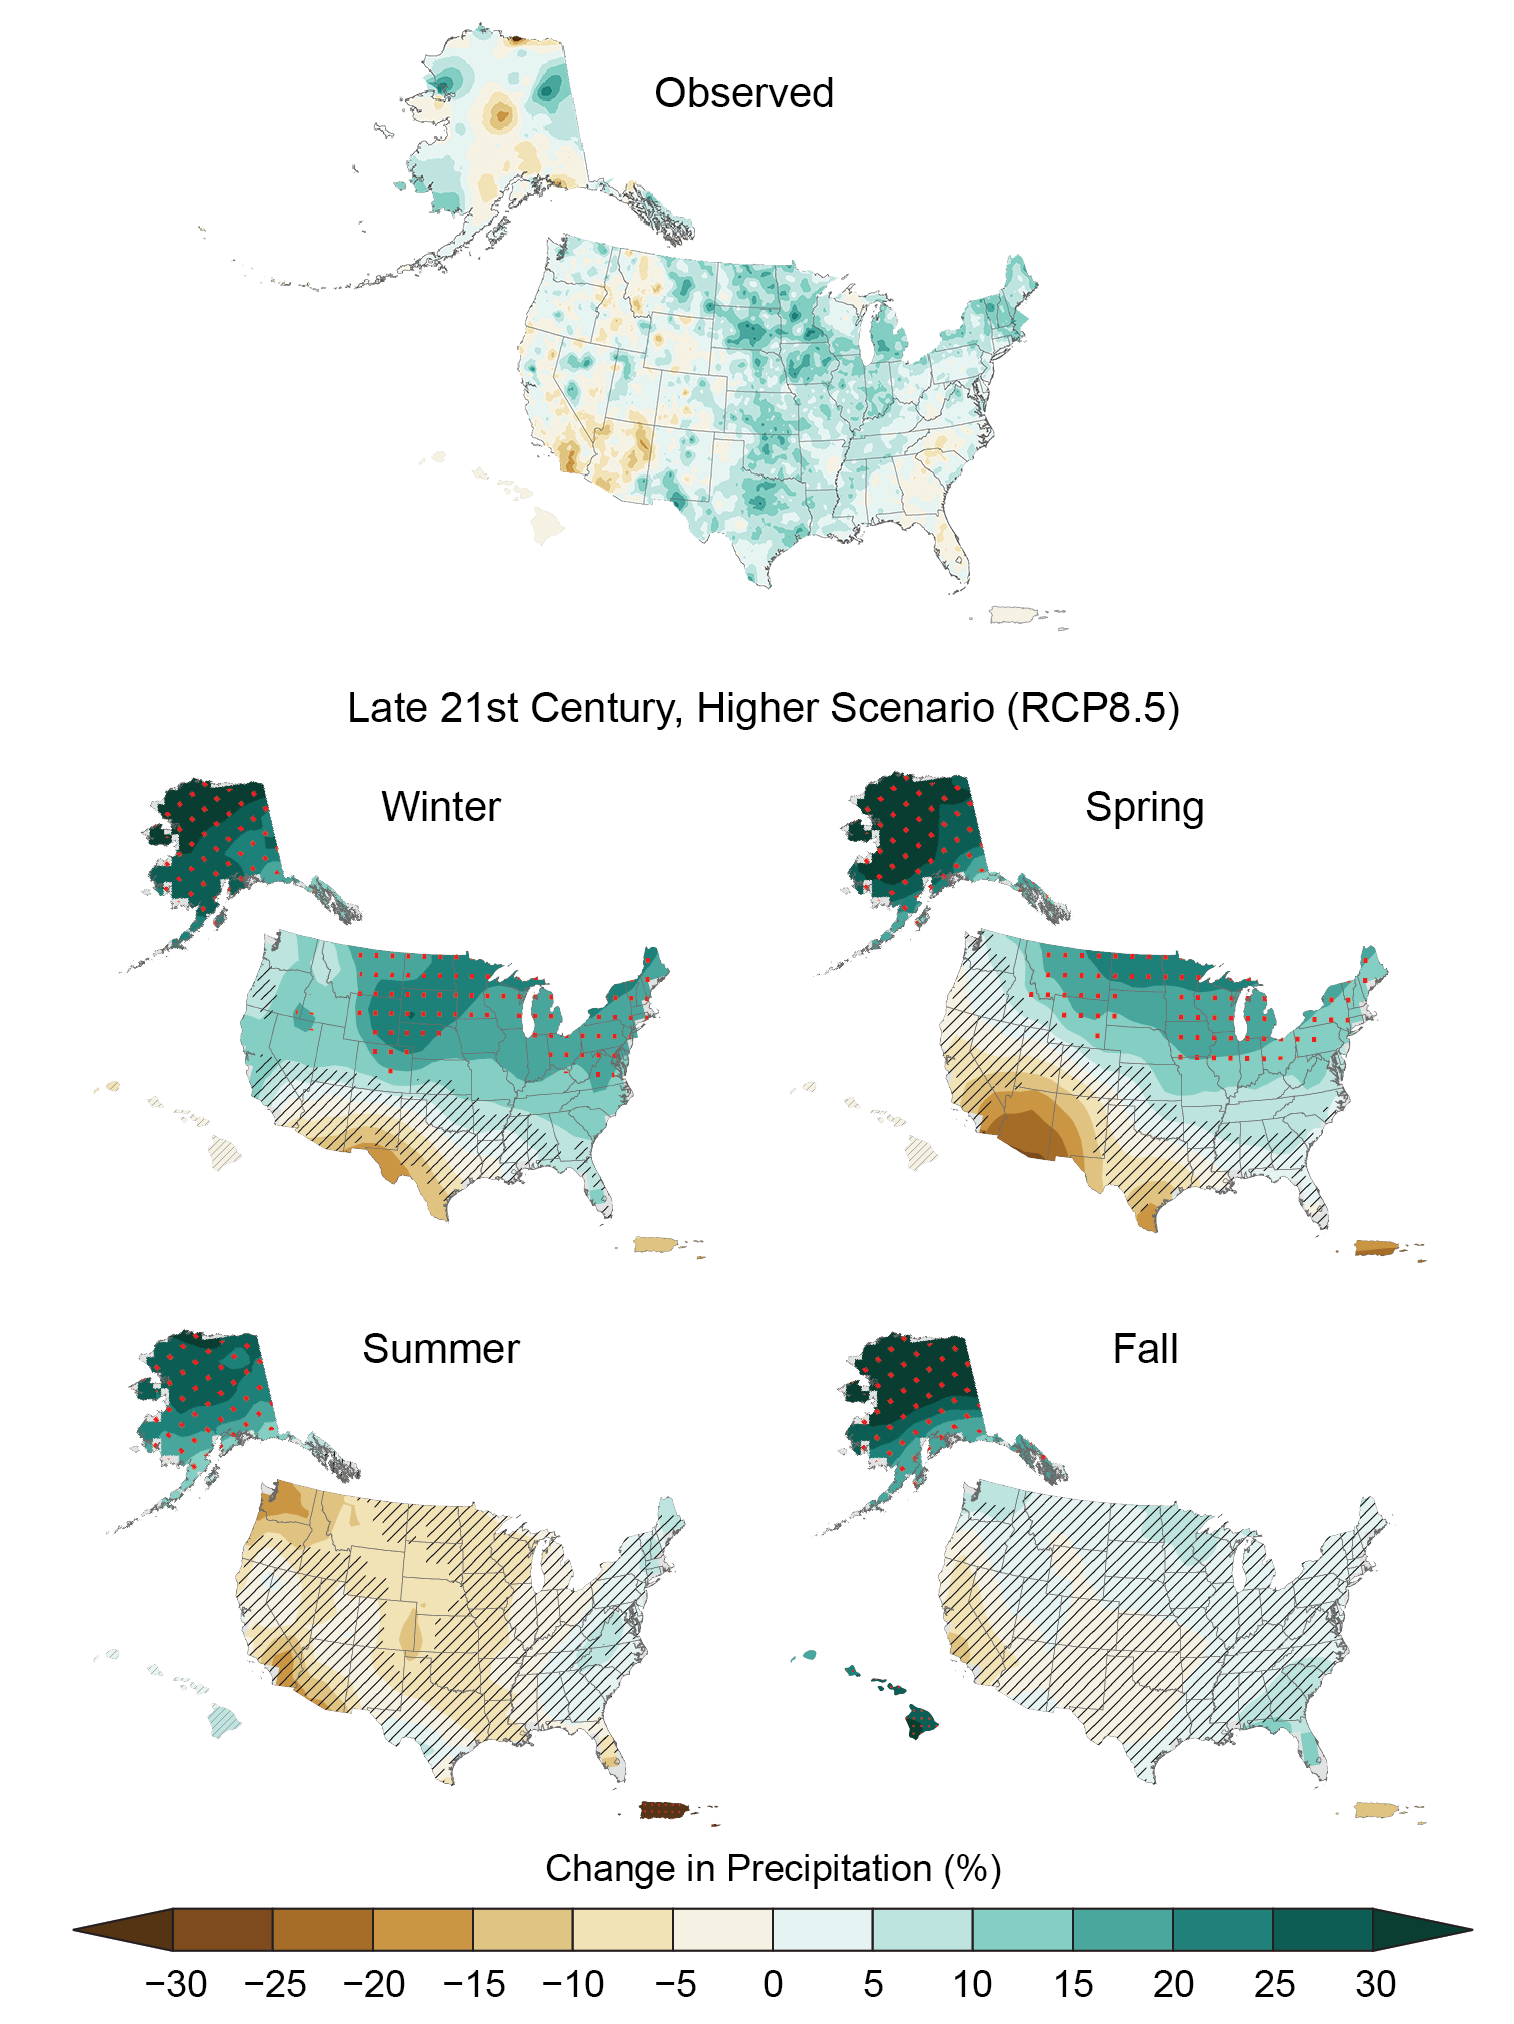
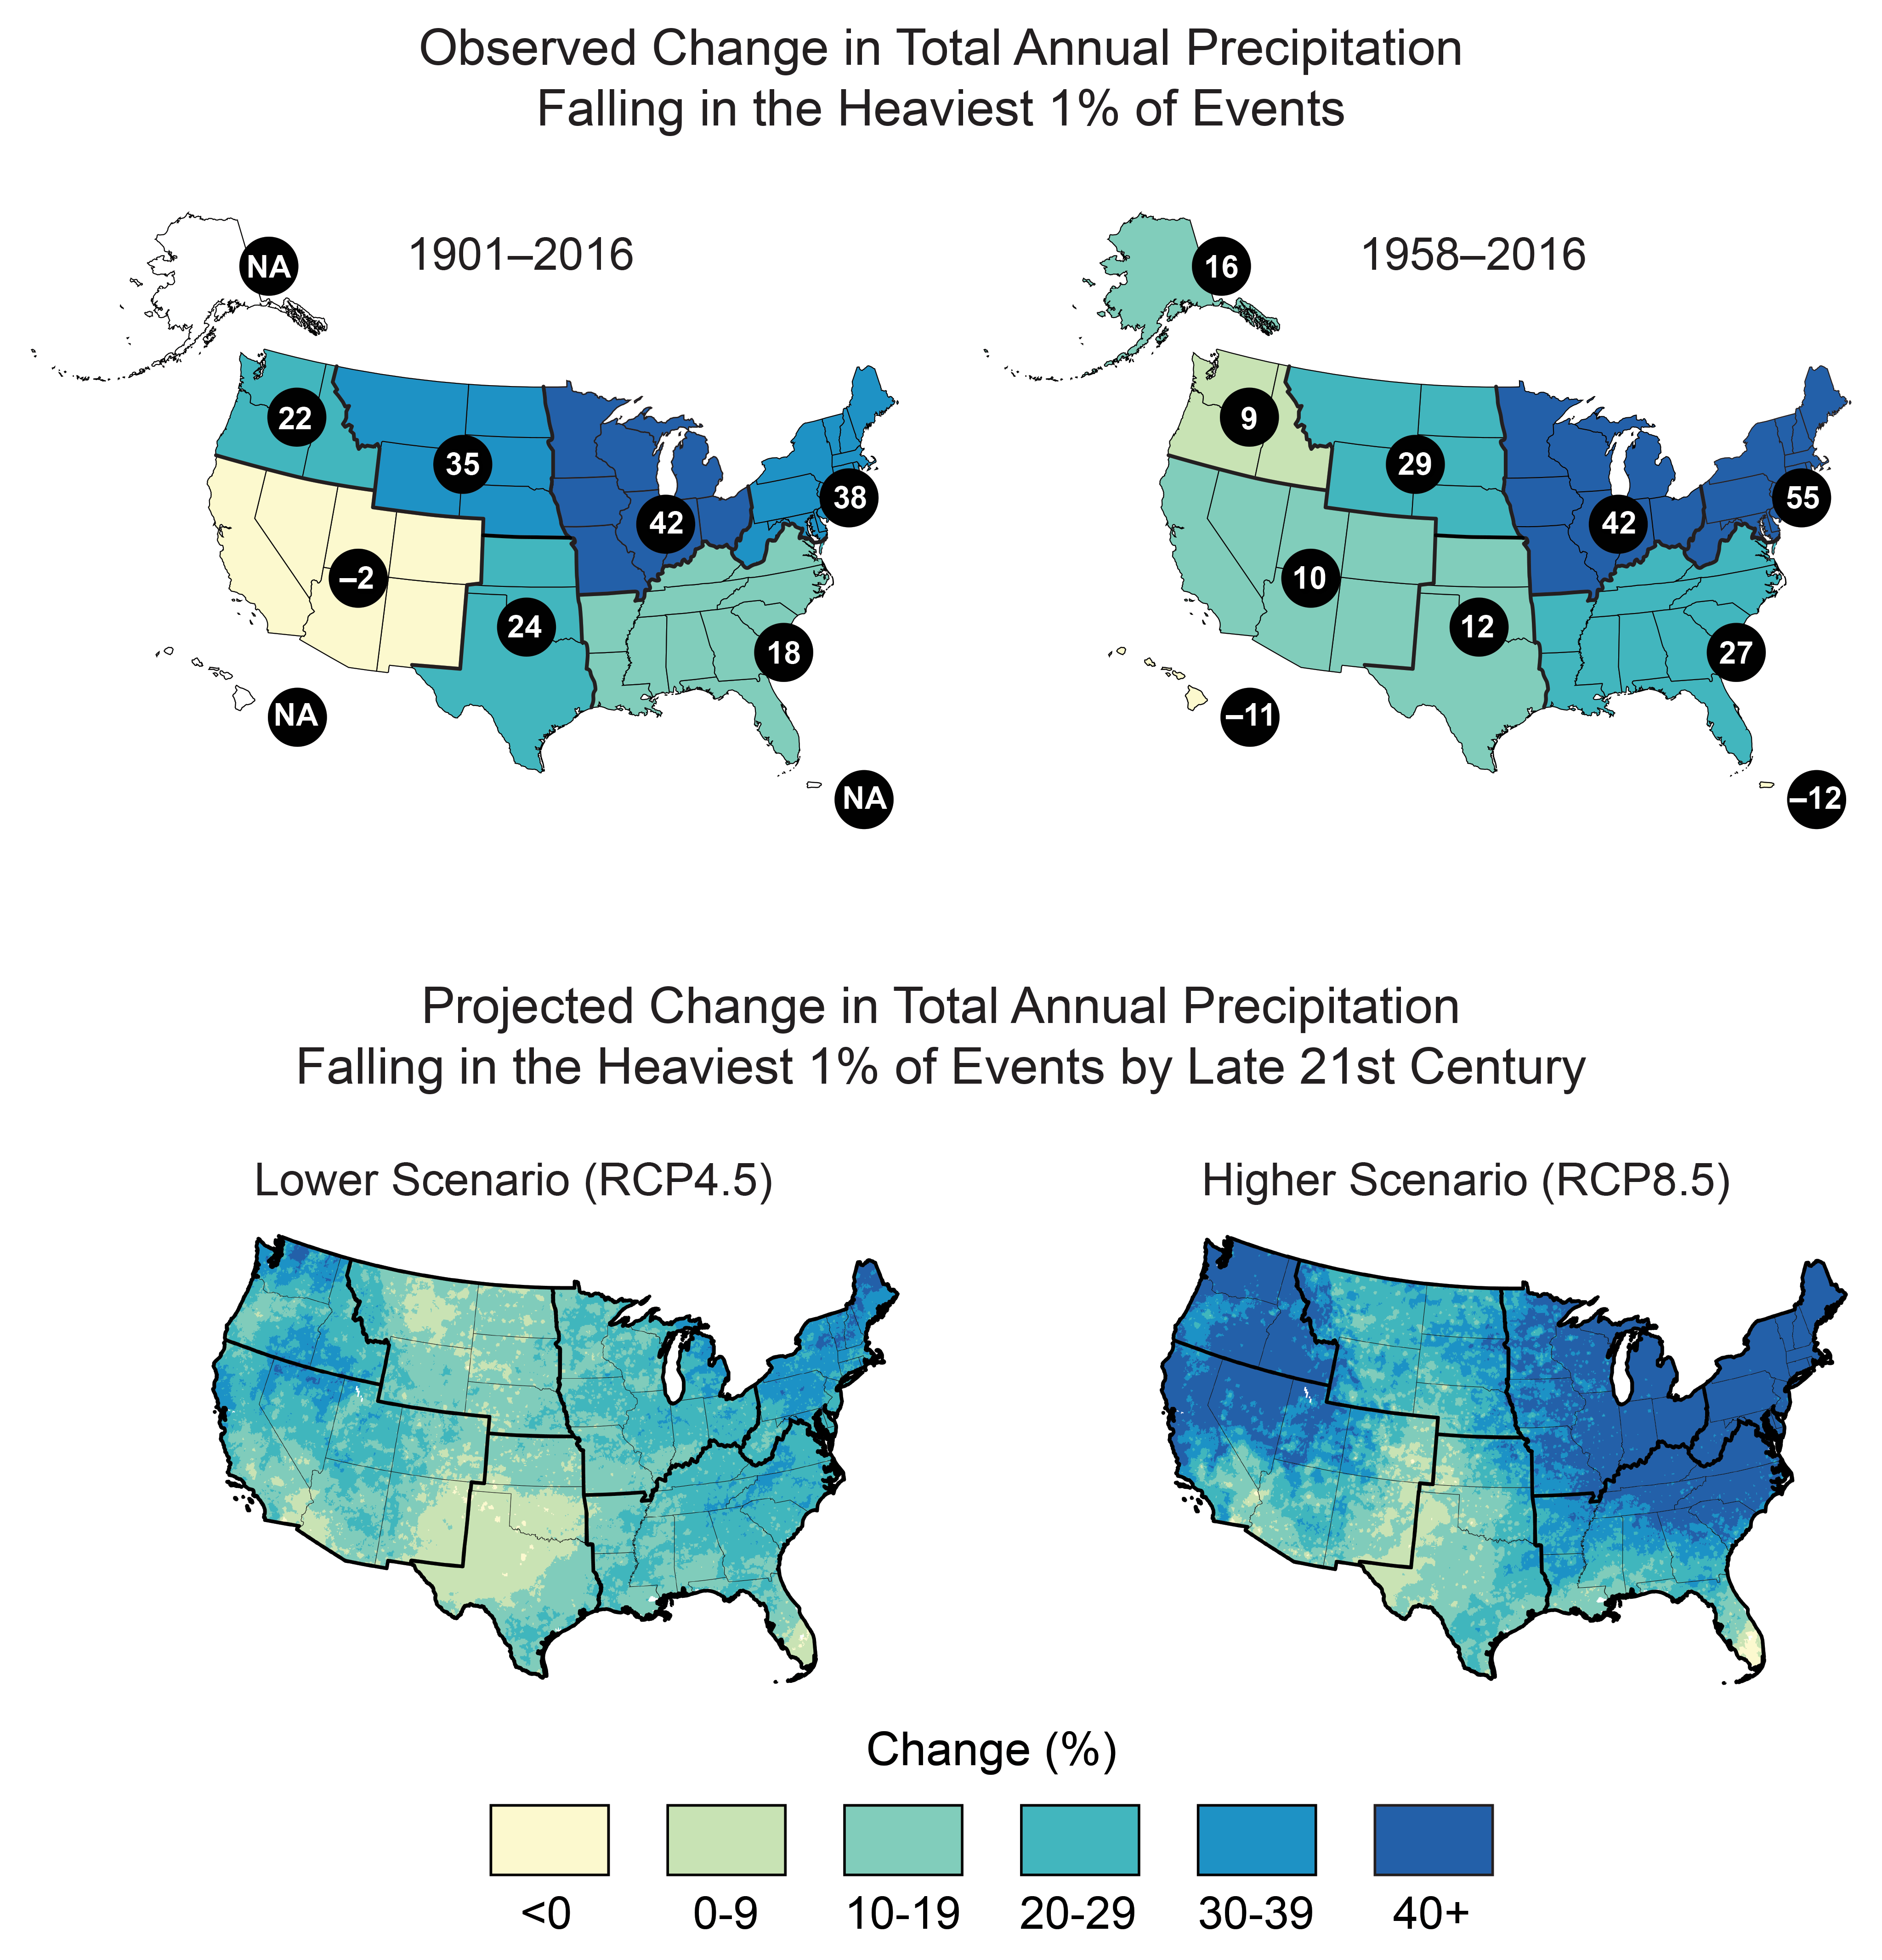
Key Message 6: Changing U.S. Precipitation
Annual precipitation since the beginning of the last century has increased across most of the northern and eastern United States and decreased across much of the southern and western United States. Over the coming century, significant increases are projected in winter and spring over the Northern Great Plains, the Upper Midwest, and the Northeast (medium confidence). Observed increases in the frequency and intensity of heavy precipitation events in most parts of the United States are projected to continue (high confidence). Surface soil moisture over most of the United States is likely to decrease (medium confidence), accompanied by large declines in snowpack in the western United States (high confidence) and shifts to more winter precipitation falling as rain rather than snow (medium confidence).
Description of evidence base
The Key Message and supporting text summarize extensive evidence documented in the climate science peer-reviewed literature and previous National Climate Assessments (e.g., Karl et al. 2009, Walsh et al. 201488,263). Evidence of long-term changes in precipitation is based on analysis of daily precipitation observations from the U.S. Cooperative Observer Network (http://www.nws.noaa.gov/om/coop/) and shown in Easterling et al. (2017),94 Figure 7.1. Published work, such as the Third National Climate Assessment and Figure 7.194, show important regional and seasonal differences in U.S. precipitation change since 1901.
Numerous papers have been written documenting observed changes in heavy precipitation events in the United States (e.g., Kunkel et al. 2003, Groisman et al. 2004275,276), which were cited in the Third National Climate Assessment, as well as those cited in this assessment. Although station-based analyses (e.g., Westra et al. 2013277) do not show large numbers of statistically significant station-based trends, area averaging reduces the noise inherent in station-based data and produces robust increasing signals (see Easterling et al. 2017,94 Figures 7.2 and 7.3). Evidence of long-term changes in precipitation is based on analysis of daily precipitation observations from the U.S. Cooperative Observer Network (http://www.nws.noaa.gov/om/coop/) and shown in Easterling et al. (2017),94 Figures 7.2, 7.3, and 7.4.
Evidence of historical changes in snow cover extent and reduction in extreme snowfall years is consistent with our understanding of the climate system’s response to increasing greenhouse gases. Furthermore, climate models continue to consistently show future declines in snowpack in the western United States. Recent model projections for the eastern United States also confirm a future shift from snowfall to rainfall during the cold season in colder portions of the central and eastern United States. Each of these changes is documented in the peer-reviewed literature and cited in the main text of this chapter.
Evidence of future change in precipitation is based on climate model projections and our understanding of the climate system’s response to increasing greenhouse gases, and on regional mechanisms behind the projected changes. In particular, Figure 7.7 in Easterling et al. (2017)94 documents projected changes in the 20-year return period amount using the LOCA data, and Figure 7.694 shows changes in 2-day totals for the 5-year return period using the CMIP5 suite of models. Each figure shows robust changes in extreme precipitation events as they are defined in the figure. However, Figure 7.594 shows changes in seasonal and annual precipitation and shows where confidence in the changes is higher based on consistency between the models, and there are large areas where the projected change is uncertain.
Major uncertainties
The main issue that relates to uncertainty in historical trends is the sensitivity of observed precipitation trends to the spatial distribution of observing stations and to historical changes in station location, rain gauges, the local landscape, and observing practices. These issues are mitigated somewhat by new methods to produce spatial grids152 through time.
This includes the sensitivity of observed snow changes to the spatial distribution of observing stations and to historical changes in station location, rain gauges, and observing practices, particularly for snow. Future changes in the frequency and intensity of meteorological systems causing heavy snow are less certain than temperature changes.
A key issue is how well climate models simulate precipitation, which is one of the more challenging aspects of weather and climate simulation. In particular, comparisons of model projections for total precipitation (from both CMIP3 and CMIP5; see Sun et al. 2015271) by NCA3 region show a spread of responses in some regions (e.g., Southwest) such that they are opposite from the ensemble average response. The continental United States is positioned in the transition zone between expected drying in the subtropics and projected wetting in the mid- and higherlatitudes. There are some differences in the location of this transition between CMIP3 and CMIP5 models, and thus there remains uncertainty in the exact location of the transition zone.
Description of confidence and likelihood
Confidence is medium that precipitation has increased and high that heavy precipitation events have increased in the United States. Furthermore, confidence is also high that the important regional and seasonal differences in changes documented here are robust.
Based on evidence from climate model simulations and our fundamental understanding of the relationship of water vapor to temperature, confidence is high that extreme precipitation will increase in all regions of the United States. However, based on the evidence and understanding of the issues leading to uncertainties, confidence is medium that more total precipitation is projected for the northern United States and less for the Southwest.
Based on the evidence and understanding of the issues leading to uncertainties, confidence is medium that average annual precipitation has increased in the United States. Furthermore, confidence is also medium that the important regional and seasonal differences in changes documented in the text and in Figure 7.1 in Easterling et al. (2017)94 are robust.
Given the evidence base and uncertainties, confidence is medium that snow cover extent has declined in the United States and medium that extreme snowfall years have declined in recent years. Confidence is high that western U.S. snowpack will decline in the future, and confidence is medium that a shift from snow domination to rain domination will occur in the parts of the central and eastern United States cited in the text, as well as that soil moisture in the surface (top 10cm) will decrease.
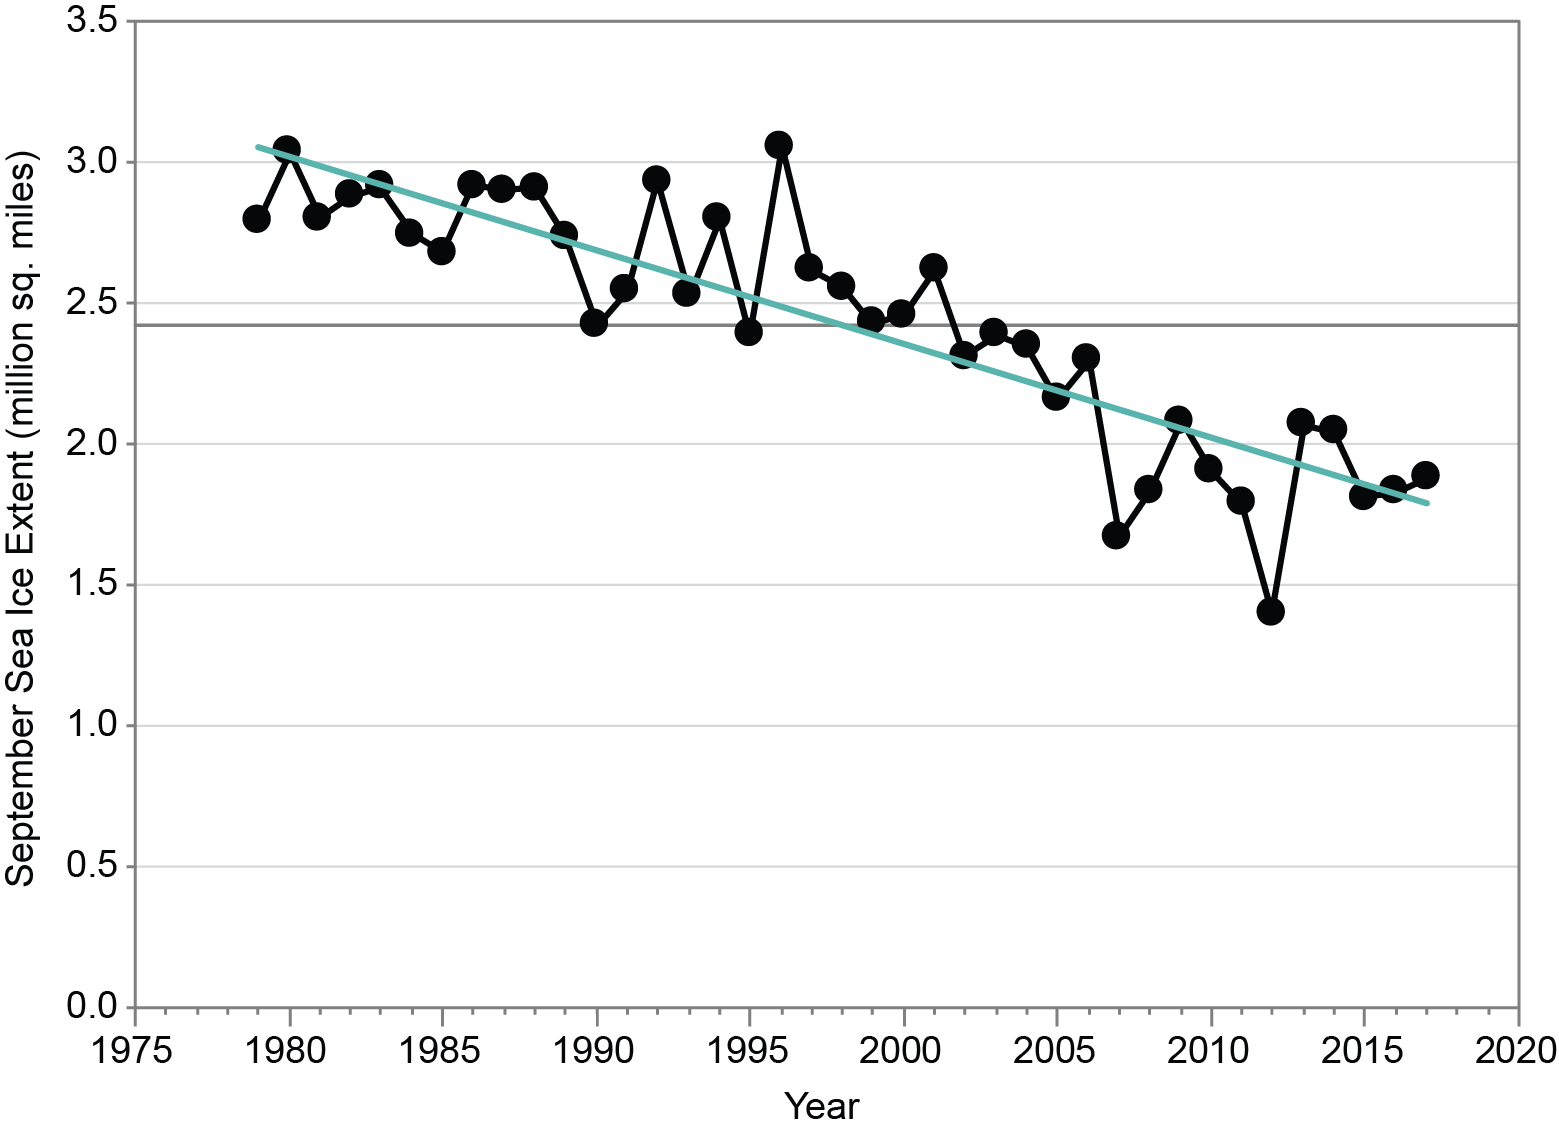
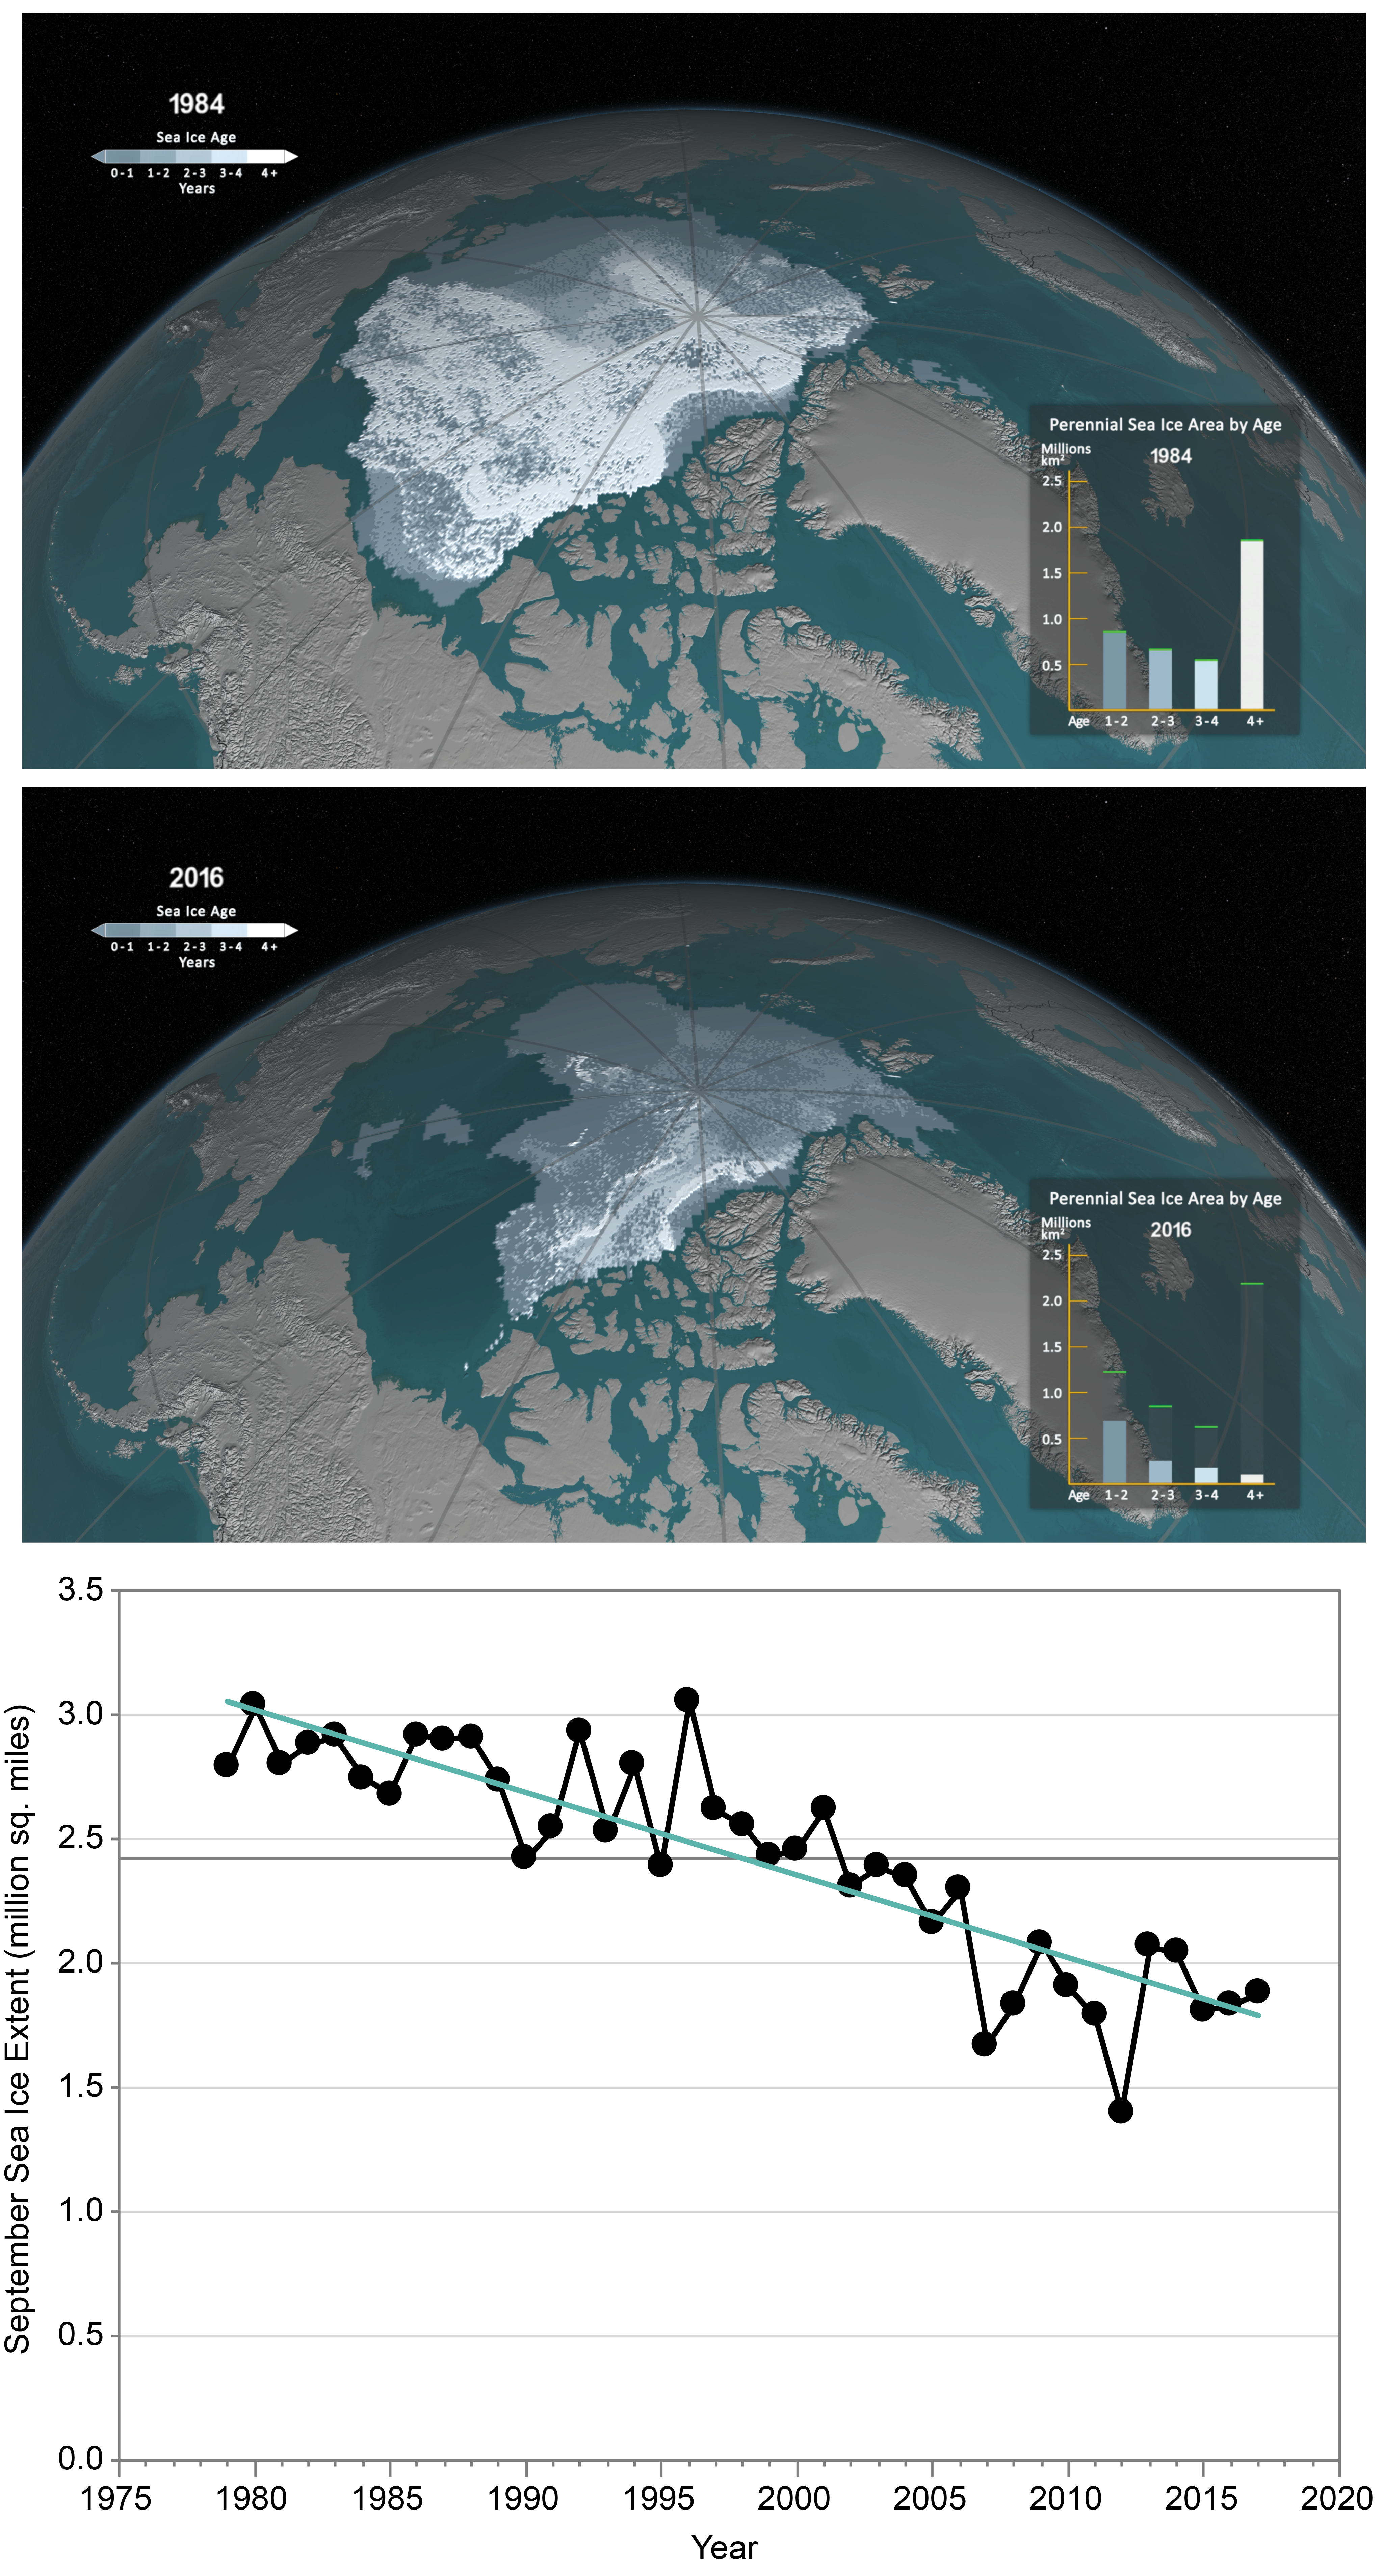
Key Message 7: Rapid Arctic Change
In the Arctic, annual average temperatures have increased more than twice as fast as the global average, accompanied by thawing permafrost and loss of sea ice and glacier mass (very high confidence). Arctic-wide glacial and sea ice loss is expected to continue; by mid-century, it is very likely that the Arctic will be nearly free of sea ice in late summer (very high confidence). Permafrost is expected to continue to thaw over the coming century as well, and the carbon dioxide and methane released from thawing permafrost has the potential to amplify human-induced warming, possibly significantly (high confidence).
Description of evidence base
Annual average near-surface air temperatures across Alaska and the Arctic have increased over the last 50 years at a rate more than twice the global average. Observational studies using ground-based observing stations and satellites analyzed by multiple independent groups support this finding. The enhanced sensitivity of the arctic climate system to anthropogenic forcing is also supported by climate modeling evidence, indicating a solid grasp of the underlying physics. These multiple lines of evidence provide very high confidence of enhanced arctic warming with potentially significant impacts on coastal communities and marine ecosystems.
This aspect of the Key Message is supported by observational evidence from ground-based observing stations, satellites, and data model temperature analyses from multiple sources and independent analysis techniques.117,118,119,120,121,136,278 For more than 40 years, climate models have predicted enhanced arctic warming, indicating a solid grasp of the underlying physics and positive feedbacks driving the accelerated arctic warming.26,279,280 Lastly, similar statements have been made in NCA3,1 IPCC AR5,120 and in other arctic-specific assessments such as the Arctic Climate Impacts Assessment281 and the Snow, Water, Ice and Permafrost in the Arctic assessment report.129
Permafrost is thawing, becoming more discontinuous, and releasing carbon dioxide (CO2) and methane (CH4). Observational and modeling evidence indicates that permafrost has thawed and released additional CO2 and CH4, indicating that the permafrost–carbon feedback is positive, accounting for additional warming of approximately 0.08ºC to 0.50ºC on top of climate model projections. Although the magnitude and timing of the permafrost–carbon feedback are uncertain due to a range of poorly understood processes (deep soil and ice wedge processes, plant carbon uptake, dependence of uptake and emissions on vegetation and soil type, and the role of rapid permafrost thaw processes such as thermokarst), emerging science and the newest estimates continue to indicate that this feedback is more likely on the larger side of the range. Impacts of permafrost thaw and the permafrost–carbon feedback complicate our ability to limit future temperature changes by adding a currently unconstrained radiative forcing to the climate system.
This part of the Key Message is supported by observational evidence of warming permafrost temperatures and a deepening active layer, in situ gas measurements, laboratory incubation experiments of CO2 and CH4 release, and model studies.126,127,282,283,284,285 Alaska and arctic permafrost characteristics have responded to increased temperatures and reduced snow cover in most regions since the 1980s, with colder permafrost warming faster than warmer permafrost.127,129,286 Large carbon soil pools (approximately half of the global below-ground organic carbon pool) are stored in permafrost soil,287,288 with the potential to be released. Thawing permafrost makes previously frozen organic matter available for microbial decomposition. In situ gas flux measurements have directly measured the release of CO2 and CH4 from arctic permafrost.289,290 The specific conditions of microbial decomposition, aerobic or anaerobic, determine the relative production of CO2 and CH4. This distinction is significant as CH4 is a much more powerful greenhouse gas than CO2.17 However, incubation studies indicate that 3.4 times more carbon is released under aerobic conditions than anaerobic conditions, leading to a 2.3 times stronger radiative forcing under aerobic conditions.284 Combined data and modeling studies suggest that the impact of the permafrost–carbon feedback on global temperatures could amount to +0.52° ± 0.38°F (+0.29° ± 0.21°C) by 2100.124 Chadburn et al. (2017)291 infer the sensitivity of permafrost area to globally averaged warming to be 1.5 million square miles (4 million square km), constraining a group of climate models with the observed spatial distribution of permafrost; this sensitivity is 20% higher than previous studies. Permafrost thaw is occurring faster than models predict due to poorly understood deep soil, ice wedge, and thermokarst processes.125,282,285,292 Additional uncertainty stems from the surprising uptake of methane from mineral soils293 and dependence of emissions on vegetation and soil properties.294 The observational and modeling evidence supports the Key Message that the permafrost–carbon feedback is positive (i.e., amplifies warming).
Arctic land and sea ice loss observed in the last three decades continues, in some cases accelerating. A diverse range of observational evidence from multiple data sources and independent analysis techniques provides consistent evidence of substantial declines in arctic sea ice extent, thickness, and volume since at least 1979, mountain glacier melt over the last 50 years, and accelerating mass loss from Greenland. An array of different models and independent analyses indicate that future declines in ice across the Arctic are expected, resulting in late summers in the Arctic very likely becoming ice free by mid-century.
This final aspect of the Key Message is supported by observational evidence from multiple ground-based and satellite-based observational techniques (including passive microwave, laser and radar altimetry, and gravimetry) analyzed by independent groups using different techniques reaching similar conclusions.127,128,131,136,257,295,296,297Additionally, the U.S. Geological Survey repeat photography database shows the glacier retreat for many Alaska glaciers (Taylor et al. 2017,122 Figure 11.4). Several independent model analysis studies using a wide array of climate models and different analysis techniques indicate that sea ice loss will continue across the Arctic, very likely resulting in late summers becoming nearly ice-free by mid-century.26,147,149
Major uncertainties
The lack of high-quality data and the restricted spatial resolution of surface and ground temperature data over many arctic land regions, coupled with the fact that there are essentially no measurements over the Central Arctic Ocean, hampers the ability to better refine the rate of arctic warming and completely restricts our ability to quantify and detect regional trends, especially over the sea ice. Climate models generally produce an arctic warming between two to three times the global mean warming. A key uncertainty is our quantitative knowledge of the contributions from individual feedback processes in driving the accelerated arctic warming. Reducing this uncertainty will help constrain projections of future arctic warming.
A lack of observations affects not only the ability to detect trends but also to quantify a potentially significant positive feedback to climate warming: the permafrost–carbon feedback. Major uncertainties are related to deep soil and thermokarst processes, as well as the persistence or degradation of massive ice (e.g., ice wedges) and the dependence of CO2 and CH4 uptake and production on vegetation and soil properties. Uncertainties also exist in relevant soil processes during and after permafrost thaw, especially those that control unfrozen soil carbon storage and plant carbon uptake and net ecosystem exchange. Many processes with the potential to drive rapid permafrost thaw (such as thermokarst) are not included in current Earth System Models.
Key uncertainties remain in the quantification and modeling of key physical processes that contribute to the acceleration of land and sea ice melting. Climate models are unable to capture the rapid pace of observed sea and land ice melt over the last 15 years; a major factor is our inability to quantify and accurately model the physical processes driving the accelerated melting. The interactions between atmospheric circulation, ice dynamics and thermodynamics, clouds, and specifically the influence on the surface energy budget are key uncertainties. Mechanisms controlling marine-terminating glacier dynamics, specifically the roles of atmospheric warming, seawater intrusions under floating ice shelves, and the penetration of surface meltwater to the glacier bed, are key uncertainties in projecting Greenland ice sheet melt.
Description of confidence and likelihood
There is very high confidence that the arctic surface and air temperatures have warmed across Alaska and the Arctic at a much faster rate than the global average is provided by the multiple datasets analyzed by multiple independent groups indicating the same conclusion. Additionally, climate models capture the enhanced warming in the Arctic, indicating a solid understanding of the underlying physical mechanisms.
There is high confidence that permafrost is thawing, becoming discontinuous, and releasing CO2 and CH4. Physically based arguments and observed increases in CO2 and CH4 emissions as permafrost thaws indicate that the feedback is positive. This confidence level is justified based on observations of rapidly changing permafrost characteristics.
There is very high confidence that arctic sea and land ice melt is accelerating and mountain glacier ice mass is declining, given the multiple observational sources and analysis techniques documented in the peer-reviewed climate science literature.
Key Message 8: Changes in Severe Storms
Human-induced change is affecting atmospheric dynamics and contributing to the poleward expansion of the tropics and the northward shift in Northern Hemisphere winter storm tracks since the 1950s (medium to high confidence). Increases in greenhouse gases and decreases in air pollution have contributed to increases in Atlantic hurricane activity since 1970 (medium confidence). In the future, Atlantic and eastern North Pacific hurricane rainfall (high confidence) and intensity (medium confidence) are projected to increase, as are the frequency and severity of landfalling “atmospheric rivers” on the West Coast (medium confidence).
Description of evidence base
The tropics have expanded poleward in each hemisphere over the period 1979–2009 (medium to high confidence) as shown by a large number of studies using a variety of metrics, observations, and reanalysis. Modeling studies and theoretical considerations illustrate that human activities like increases in greenhouse gases, ozone depletion, and anthropogenic aerosols cause a widening of the tropics. There is medium confidence that human activities have contributed to the observed poleward expansion, taking into account uncertainties in the magnitude of observed trends and a possible large contribution of natural climate variability.
The first part of the Key Message is supported by statements of the previous international IPCC AR5 assessment120 and a large number of more recent studies that examined the magnitude of the observed tropical widening and various causes.95,161,298,299,300,301,302,303,304,305 Additional evidence for an impact of greenhouse gas increases on the widening of the tropical belt and poleward shifts of the midlatitude jets is provided by the diagnosis of CMIP5 simulations.306,307 There is emerging evidence for an impact of anthropogenic aerosols on the tropical expansion in the Northern Hemisphere.308,309 Recent studies provide new evidence on the significance of internal variability on recent changes in the tropical width.302,310,311
Models are generally in agreement that tropical cyclones will be more intense and have higher precipitation rates, at least in most basins. Given the agreement among models and support of theory and mechanistic understanding, there is medium to high confidence in the overall projection, although there is some limitation on confidence levels due to the lack of a supporting detectable anthropogenic contribution to tropical cyclone intensities or precipitation rates.
The second part of the Key Message is also based on extensive evidence documented in the climate science literature and is similar to statements made in previous national (NCA3)1 and international249 assessments. Since these assessments, more recent downscaling studies have further supported these assessments (e.g., Knutson et al. 2015170), though pointing out that the changes (future increased intensity and tropical cyclone precipitation rates) may not occur in all basins.
Increases in atmospheric river frequency and intensity are expected along the U.S. West Coast, leading to the likelihood of more frequent flooding conditions, with uncertainties remaining in the details of the spatial structure of these systems along the coast (for example, northern vs. southern California). Evidence for the expectation of an increase in the frequency and severity of landfalling atmospheric rivers on the U.S. West Coast comes from the CMIP-based climate change projection studies of Dettinger (2011).163 Warner et al. (2015),164 Payne and Magnusdottir (2015),312 Gao et al. (2015),165 Radić et al. (2015),313 and Hagos et al. (2016).314 The close connection between atmospheric rivers and water availability and flooding is based on the present-day observation studies of Guan et al. (2010),315 Dettinger (2011),163 Ralph et al. (2006),316 Neiman et al. (2011),317 Moore et al. (2012),318 and Dettinger (2013).319
Major uncertainties
The rate of observed expansion of the tropics depends on which metric is used.161 The linkages between different metrics are not fully explored. Uncertainties also result from the utilization of reanalysis to determine trends and from limited observational records of free atmosphere circulation, precipitation, and evaporation. The dynamical mechanisms behind changes in the width of the tropical belt (e.g., tropical–extratropical interactions, baroclinic eddies) are not fully understood. There is also a limited understanding of how various climate forcings, such as anthropogenic aerosols, affect the width of the tropics. The coarse horizontal and vertical resolution of global climate models may limit the ability of these models to properly resolve latitudinal changes in the atmospheric circulation. Limited observational records affect the ability to accurately estimate the contribution of natural decadal to multi-decadal variability on observed expansion of the tropics.
A key uncertainty in tropical cyclones (TCs) is the lack of a supporting detectable anthropogenic signal in the historical data to add further confidence to these projections. As such, confidence in the projections is based on agreement among different modeling studies and physical understanding (for example, potential intensity theory for TC intensities and the expectation of stronger moisture convergence, and thus higher precipitation rates, in TCs in a warmer environment containing greater amounts of environmental atmospheric moisture). Additional uncertainty stems from uncertainty in both the projected pattern and magnitude of future SST.170
In terms of atmospheric rivers (ARs), a modest uncertainty remains in the lack of a supporting detectable anthropogenic signal in the historical data to add further confidence to these projections. However, the overall increase in ARs projected/expected is based to a very large degree on very high confidence that the atmospheric water vapor will increase. Thus, increasing water vapor coupled with little projected change in wind structure/intensity still indicates increases in the frequency/intensity of ARs. A modest uncertainty arises in quantifying the expected change at a regional level (for example, northern Oregon versus southern Oregon), given that there are some changes expected in the position of the jet stream that might influence the degree of increase for different locations along the west coast. Uncertainty in the projections of the number and intensity of ARs is introduced by uncertainties in the models’ ability to represent ARs and their interactions with climate.
Description of confidence and likelihood
There is medium to high confidence that the tropics and related features of the global circulation have expanded poleward is based upon the results of a large number of observational studies, using a wide variety of metrics and datasets, which reach similar conclusions. A large number of studies utilizing modeling of different complexity and theoretical considerations provide compounding evidence that human activities like increases in greenhouse gases, ozone depletion, and anthropogenic aerosols contributed to the observed poleward expansion of the tropics. Climate models forced with these anthropogenic drivers cannot explain the observed magnitude of tropical expansion, and some studies suggest a possibly large contribution of internal variability. These multiple lines of evidence lead to the conclusion of medium confidence that human activities contributed to observed expansion of the tropics.
Confidence is rated as high in tropical cyclone rainfall projections and medium in intensity projections since there are a number of publications supporting these overall conclusions, fairly well-established theory, general consistency among different studies, varying methods used in studies, and still a fairly strong consensus among studies. However, a limiting factor for confidence in the results is the lack of a supporting detectable anthropogenic contribution in observed tropical cyclone data.
There is low to medium confidence for increased occurrence of the most intense tropical cyclones for most basins, as there are relatively few formal studies focused on these changes, and the change in occurrence of such storms would be enhanced by increased intensities but reduced by decreased overall frequency of tropical cyclones.
Confidence in this finding on atmospheric rivers is rated as medium based on qualitatively similar projections among different studies.
Key Message 9: Increases in Coastal Flooding
Regional changes in sea level rise and coastal flooding are not evenly distributed across the United States; ocean circulation changes, sinking land, and Antarctic ice melt will result in greater-than-average sea level rise for the Northeast and western Gulf of Mexico under lower scenarios and most of the U.S. coastline other than Alaska under higher scenarios (very high confidence). Since the 1960s, sea level rise has already increased the frequency of high tide flooding by a factor of 5 to 10 for several U.S. coastal communities. The frequency, depth, and extent of tidal flooding is expected to continue to increase in the future (high confidence), as is the more severe flooding associated with coastal storms, such as hurricanes and nor’easters (low confidence).
Description of evidence base
The part of the Key Message regarding the existence of geographic variability is based upon a broader observational, modeling, and theoretical literature. The specific differences are based upon the scenarios described by the Federal Interagency Sea Level Rise Task Force.76 The processes that cause geographic variability in regional sea level (RSL) change are also reviewed by Kopp et al. (2015).320 Long tide gauge datasets reveal where RSL rise is largely driven by vertical land motion due to glacio-isostatic adjustment and fluid withdrawal along many U.S. coastlines.321,322 These observations are corroborated by glacio-isostatic adjustment models, by global positioning satellite (GPS) observations, and by geological data (e.g., Engelhart and Horton 2012323). The physics of the gravitational, rotational, and flexural “static-equilibrium fingerprint” response of sea level to redistribution of mass from land ice to the oceans is well-established.324,325 GCM studies indicate the potential for a Gulf Stream contribution to sea level rise in the U.S. Northeast.326,327 Kopp et al. (2014)77 and Slangen et al. (2014)59 accounted for land motion (only glacial isostatic adjustment for Slangen et al.), fingerprint, and ocean dynamic responses. Comparing projections of local RSL change and GMSL change in these studies indicates that local rise is likely to be greater than the global average along the U.S. Atlantic and Gulf Coasts and less than the global average in most of the Pacific Northwest. Sea level rise projections in this report were developed by a Federal Interagency Sea Level Rise Task Force.76
The frequency, extent, and depth of extreme event-driven (e.g., 5- to 100-year event probabilities) coastal flooding relative to existing infrastructure will continue to increase in the future as local RSL rises.57,76,77,328,329,330,331,332,333 These projections are based on modeling studies of future hurricane characteristics and associated increases in major storm surge risk amplification. Extreme flood probabilities will increase regardless of changes in storm characteristics, which may exacerbate such changes. Model-based projections of tropical storms and related major storm surges within the North Atlantic mostly agree that intensities and frequencies of the most intense storms will increase this century.190,334,335,336,337 However, the projection of increased hurricane intensity is more robust across models than the projection of increased frequency of the most intense storms. A number of models project a decrease in the overall number of tropical storms and hurricanes in the North Atlantic, although high-resolution models generally project increased mean hurricane intensity (e.g., Knutson et al. 2013190). In addition, there is model evidence for a change in tropical cyclone tracks in warm years that minimizes the increase in landfalling hurricanes in the U.S. mid-Atlantic or Northeast.338
Major uncertainties
Since NCA3,1 multiple authors have produced global or regional studies synthesizing the major process that causes global and local sea level change to diverge. The largest sources of uncertainty in the geographic variability of sea level change are ocean dynamic sea level change and, for those regions where sea level fingerprints for Greenland and Antarctica differ from the global mean in different directions, the relative contributions of these two sources to projected sea level change.
Uncertainties remain large with respect to the precise change in future risk of a major coastal impact at a specific location from changes in the most intense tropical cyclone characteristics and tracks beyond changes imposed from local sea level rise.
Description of confidence and likelihood
Because of the enumerated physical processes, there is very high confidence that RSL change will vary across U.S. coastlines. There is high confidence in the likely differences of RSL change from GMSL change under different levels of GMSL change, based on projections incorporating the different relevant processes. There is low confidence that the flood risk at specific locations will be amplified from a major tropical storm this century.
Key Message 10: Long-Term Changes
The climate change resulting from human-caused emissions of carbon dioxide will persist for decades to millennia. Self-reinforcing cycles within the climate system have the potential to accelerate human-induced change and even shift Earth’s climate system into new states that are very different from those experienced in the recent past. Future changes outside the range projected by climate models cannot be ruled out (very high confidence), and due to their systematic tendency to underestimate temperature change during past warm periods, models may be more likely to underestimate than to overestimate long-term future change (medium confidence).
Description of evidence base
This Key Message is based on a large body of scientific literature recently summarized by Lenton et al. (2008),197 NRC (2013),339 and Kopp et al. (2016).198 As NRC (2013)339 states, “A study of Earth’s climate history suggests the inevitability of ‘tipping points’—thresholds beyond which major and rapid changes occur when crossed—that lead to abrupt changes in the climate system” and “Can all tipping points be foreseen? Probably not. Some will have no precursors, or may be triggered by naturally occurring variability in the climate system. Some will be difficult to detect, clearly visible only after they have been crossed and an abrupt change becomes inevitable.” As IPCC AR5 WG1 Chapter 12, Section 12.5.526 further states, “A number of components or phenomena within the Earth system have been proposed as potentially possessing critical thresholds (sometimes referred to as tipping points) beyond which abrupt or nonlinear transitions to a different state ensues.” Collins et al. (2013)26 further summarize critical thresholds that can be modeled and others that can only be identified.
This Key Message is also based on the conclusions of IPCC AR5 WG1,249 specifically Chapter 7;196 the state of the art of global models is briefly summarized in Hayhoe et al. (2017).24 This Key Message is also based upon the tendency of global climate models to underestimate, relative to geological reconstructions, the magnitude of both long-term global mean warming and the amplification of warming at high latitudes in past warm climates (e.g., Salzmann et al. 2013, Goldner et al. 2014, Caballeo and Huber 2013, Lunt et al. 2012199,201,340,341).
Major uncertainties
The largest uncertainties are 1) whether proposed tipping elements actually undergo critical transitions, 2) the magnitude and timing of forcing that will be required to initiate critical transitions in tipping elements, 3) the speed of the transition once it has been triggered, 4) the characteristics of the new state that results from such transition, and 5) the potential for new positive feedbacks and tipping elements to exist that are yet unknown.
The largest uncertainties in models are structural: are the models including all the important components and relationships necessary to model the feedbacks and, if so, are these correctly represented in the models?
Description of confidence and likelihood
There is very high confidence in the likelihood of the existence of positive feedbacks and tipping elements based on a large body of literature published over the last 25 years that draws from basic physics, observations, paleoclimate data, and modeling.
There is very high confidence that some feedbacks can be quantified, others are known but cannot be quantified, and others may yet exist that are currently unknown.
There is very high confidence that the models are incomplete representations of the real world; and there is medium confidence that their tendency is to under- rather than overestimate the amount of long-term future change.


